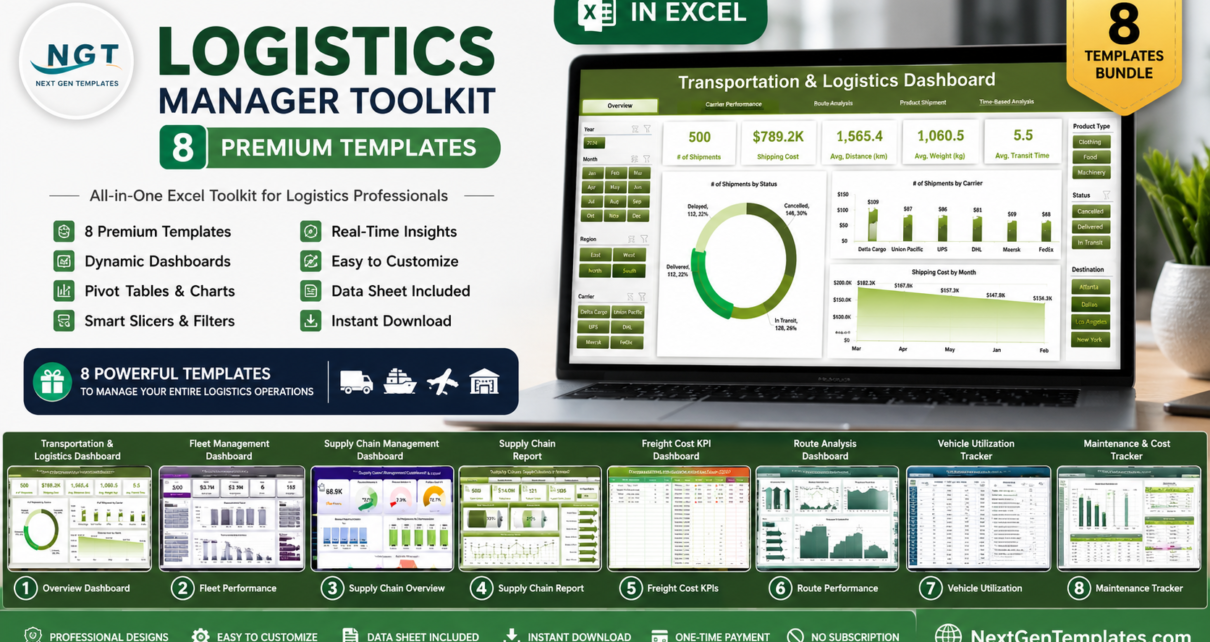
Running a modern logistics operation means watching a dozen moving parts at once — shipments, carriers, routes, supply chain flow, vehicle fleets and freight budgets. The Logistics Manager Toolkit brings all of that into one affordable, Excel-only package. It bundles 8 premium dashboards that are normally sold separately for a combined $122.92, and gives them to you for a single price of $73.99 — an instant saving of $48.93 (40% off). No BI software, no subscriptions, no coding.
🚛 Logistics Manager Toolkit — 8 Excel Dashboards
$122.92 $73.99 (Save 40%)
Why a Logistics Bundle Makes Sense
Most logistics teams don’t need just one report — they need a connected view across transport, supply chain and fleet. Buying those dashboards one at a time is slower and more expensive. This bundle solves both problems: you get a coordinated set of Excel dashboards that share the same plug-and-play philosophy — structured input tables, PivotTables, slicers, KPI cards and ready-made charts — so once you learn one, you know them all. Everything runs offline in Microsoft Excel, which means no per-seat SaaS fees and no IT approvals to get started.
Key Features of the Toolkit
Every dashboard in the Logistics Manager Toolkit is built for real operational decisions, not just pretty charts. Across the eight files you get:
- End-to-end coverage — transportation, carrier performance, route analysis, supply chain, fleet and freight cost in one toolkit.
- Dynamic filtering — slicers for month, carrier, route, product type and vehicle so you can drill into exactly what matters.
- Auto-updating KPIs — on-time %, total cost, cost-per-mile, utilization, lead time and more refresh with a single click.
- Cost visibility — dedicated freight and fleet cost views to keep budgets under control.
- Zero coding — replace the sample data with your own and hit “Refresh All”; the visuals do the rest.
- Report-ready layouts — clean, printable pages for operations reviews and board decks.
What’s Included in the Bundle
Here are the eight Excel dashboards you’ll receive, each also available individually on NextGenTemplates:
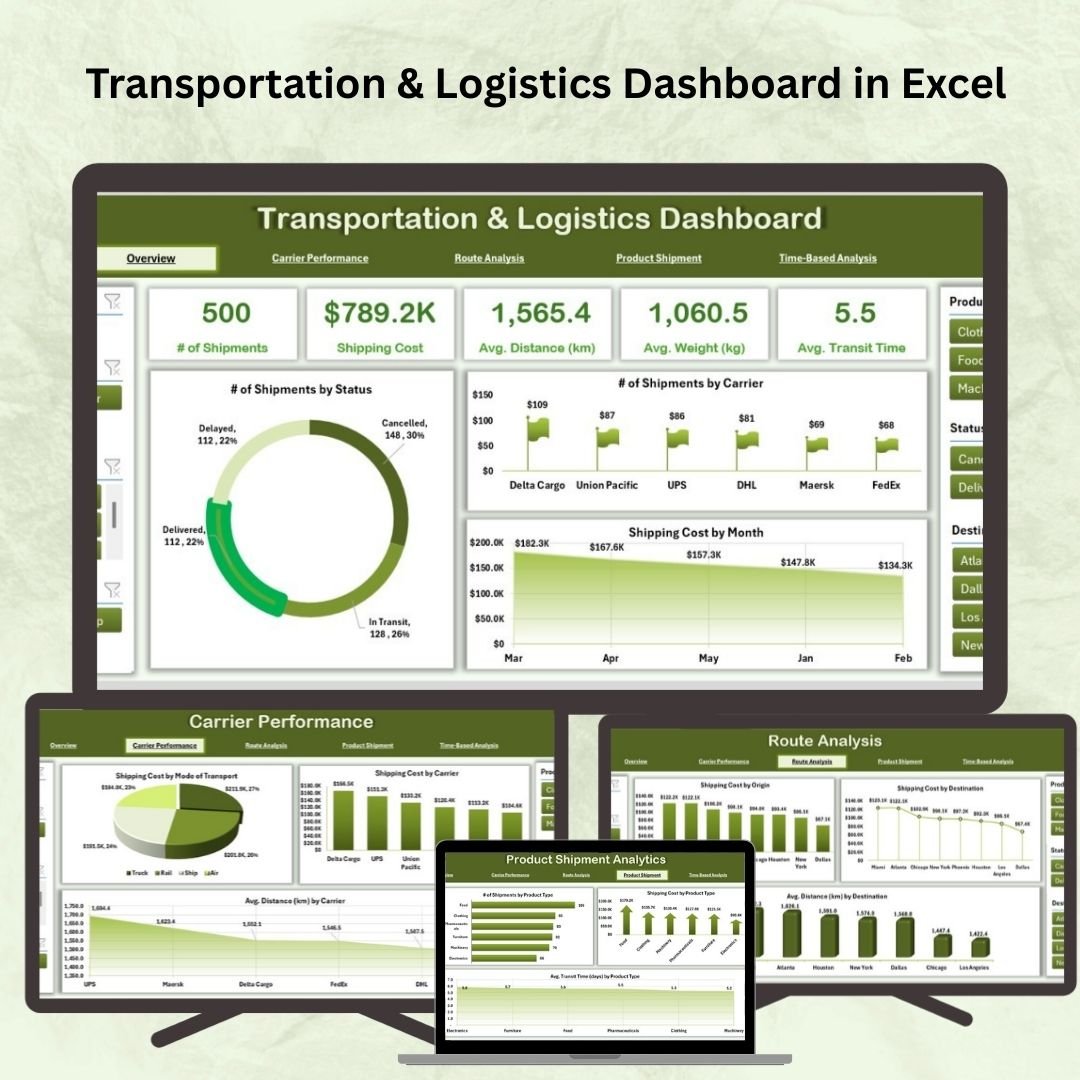
1. Transportation & Logistics Dashboard in Excel
A 5-page command center covering an operations overview, carrier performance, route analysis, product shipment analytics and time-based trends. Ideal for executive reporting and carrier negotiations. View the individual product →
2. Supply Chain Management Dashboard in Excel
A broad view of suppliers, procurement, inventory and delivery performance so you can manage your whole supply chain from a single workbook. View the individual product →

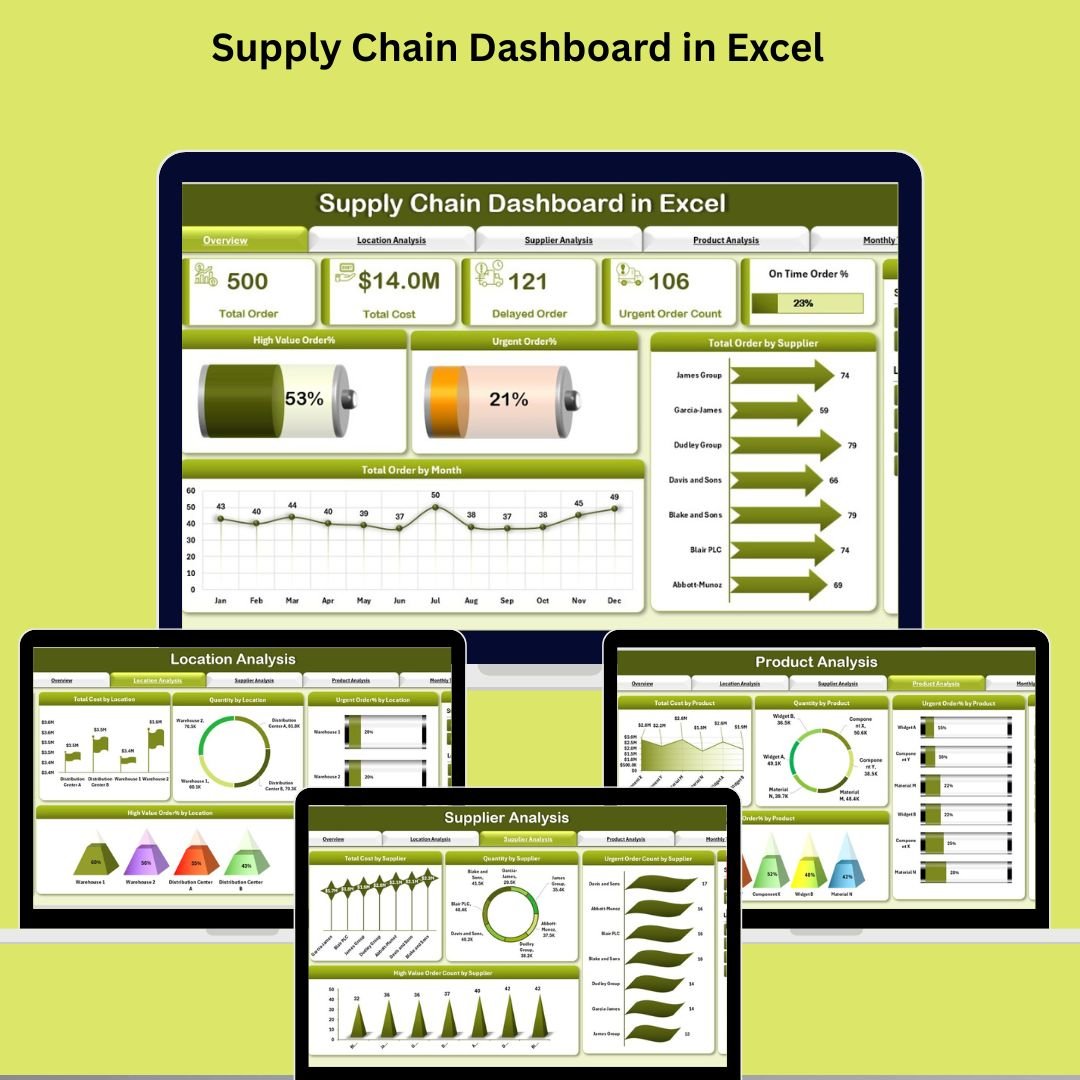
3. Supply Chain Dashboard in Excel
A tighter, KPI-focused view of order fulfillment, lead times and stock health for quick day-to-day operational decisions. View the individual product →
4. Freight Cost KPI Dashboard in Excel
Zero in on freight spend, cost-per-shipment and cost-per-mile so transportation budgets never surprise you. View the individual product →

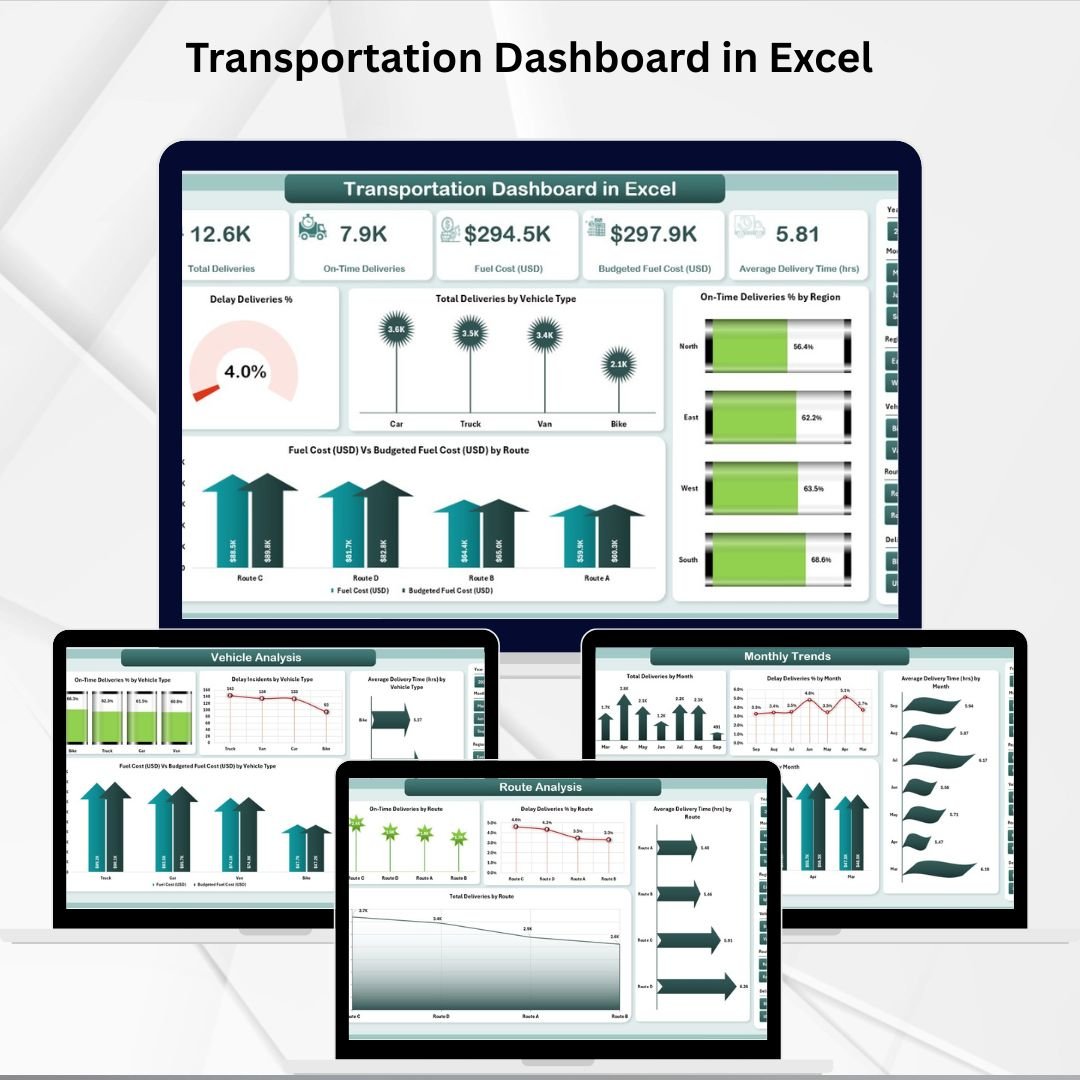
5. Transportation Dashboard in Excel
Track delivery performance, transport modes and on-time rates with clean, slicer-driven visuals. View the individual product →
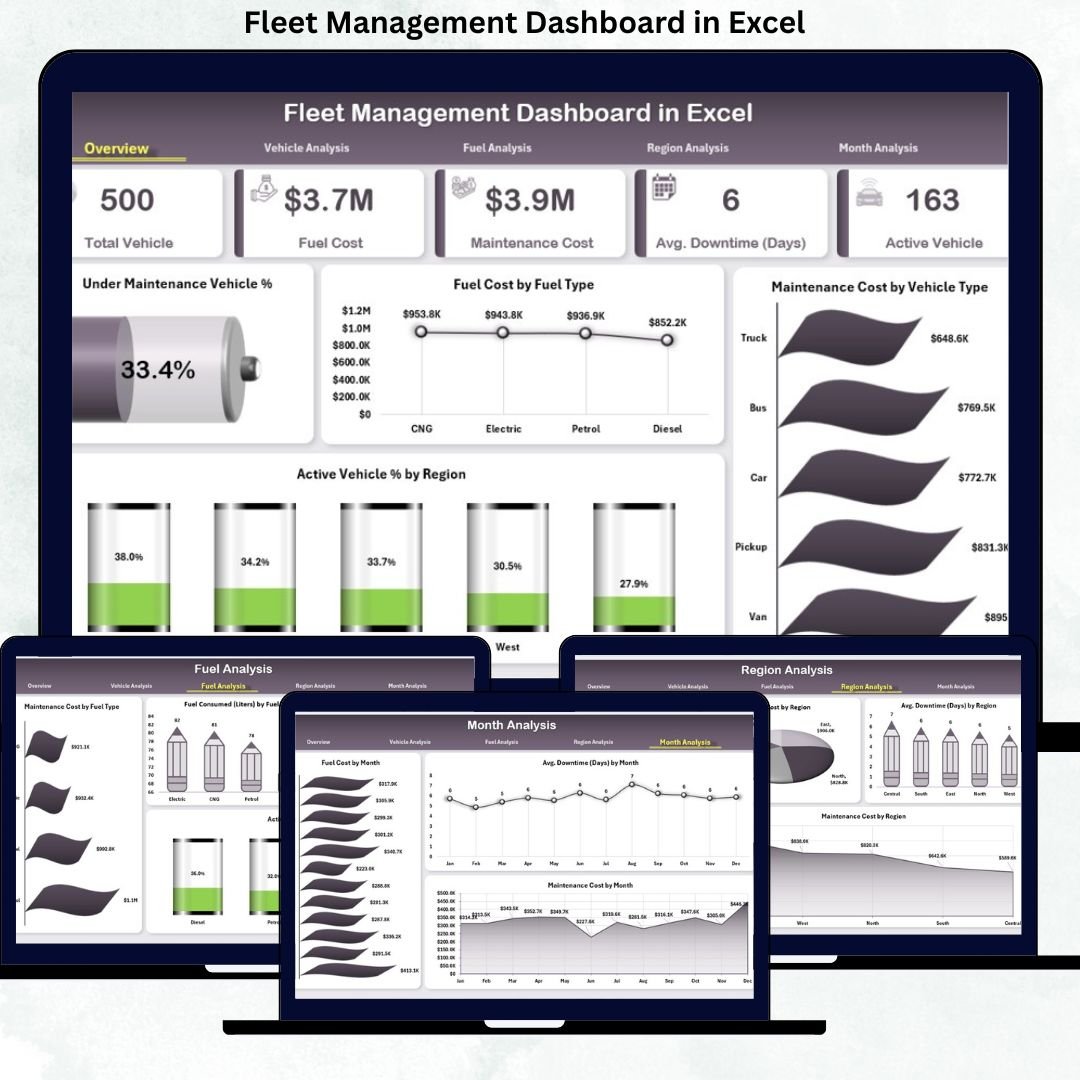
6. Fleet Management Dashboard in Excel
Manage your vehicle fleet end-to-end: utilization, trips, fuel, maintenance schedules and running costs. View the individual product →
7. Fleet Management KPI Dashboard in Excel
A KPI-first fleet scorecard for utilization %, downtime, cost-per-km and maintenance tracking. View the individual product →

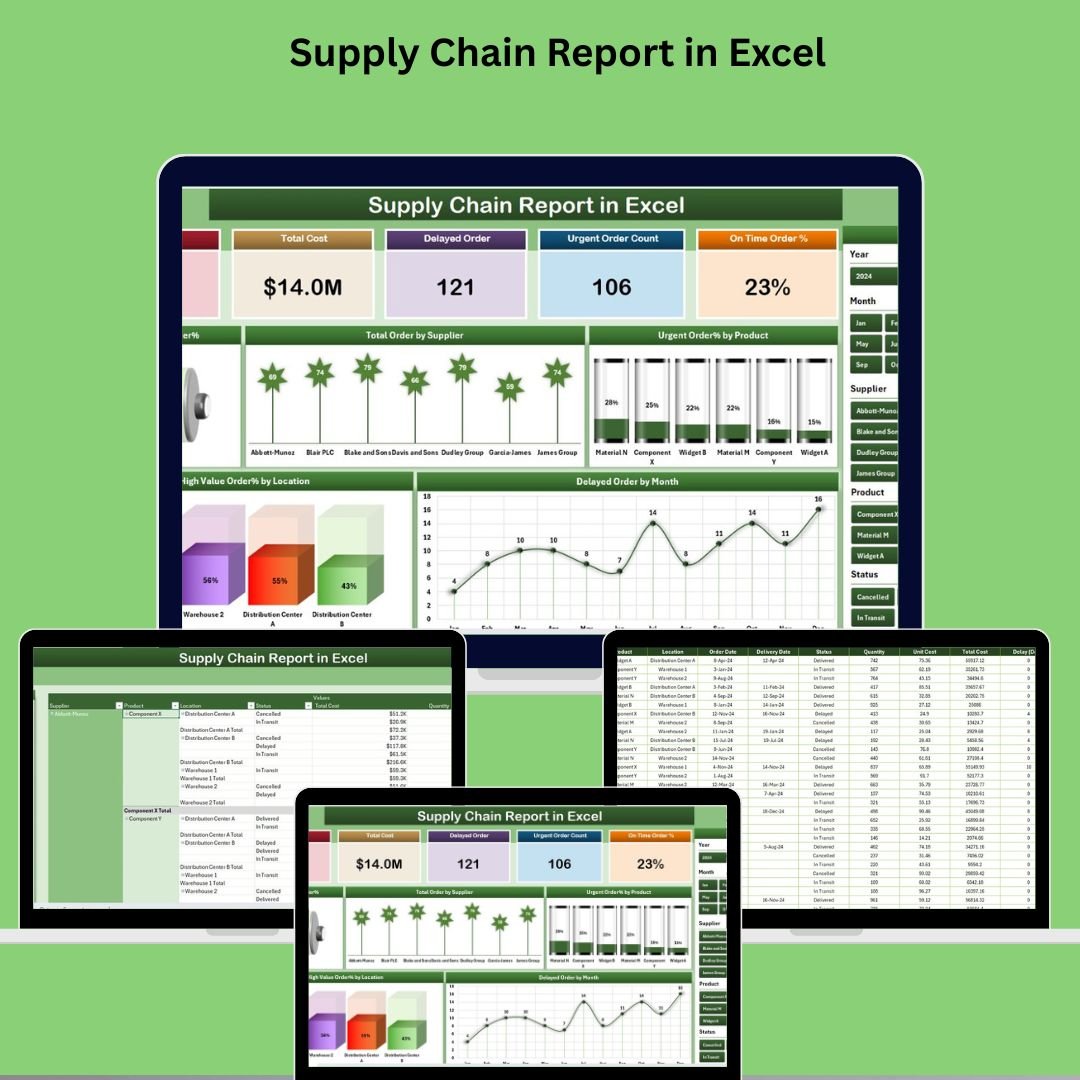
8. Supply Chain Report in Excel
A ready-to-fill reporting template that turns raw supply chain data into a clean, shareable summary for stakeholders. View the individual product →
Smart Comparison — Individual vs Bundle
| # | Template | Platform | Individual Price |
|---|---|---|---|
| 1 | Transportation & Logistics Dashboard | Excel | $17.99 |
| 2 | Supply Chain Management Dashboard | Excel | $17.99 |
| 3 | Supply Chain Dashboard | Excel | $17.99 |
| 4 | Freight Cost KPI Dashboard | Excel | $12.99 |
| 5 | Transportation Dashboard | Excel | $17.99 |
| 6 | Fleet Management Dashboard | Excel | $17.99 |
| 7 | Fleet Management KPI Dashboard | Excel | $12.99 |
| 8 | Supply Chain Report | Excel | $6.99 |
| Individual Total | $122.92 | ||
| Bundle Price | $73.99 | ||
| You Save | $48.93 (40%) | ||
Advantages of Buying the Bundle
Beyond the obvious 40% discount, buying the toolkit as a set has practical benefits. You get a consistent design language across every dashboard, so your team spends less time learning and more time analyzing. You get coverage across departments — transport, supply chain and fleet — which makes cross-functional reporting far easier. And because everything lives in Excel, you can customize freely: add columns, tweak formulas, rebrand colors and merge data without waiting on a vendor.
Best Practices for Deploying the Toolkit
- Standardize your data columns first. Align your shipment, route and vehicle fields with the templates’ input tables so refreshing is instant.
- Set a refresh routine. Update data weekly or monthly and use “Refresh All” so KPIs stay current.
- Use slicers for reviews. Filter by carrier, route or period live during operations meetings instead of exporting static screenshots.
- Keep a master copy. Save an untouched version of each template so you always have a clean starting point.
- Combine views for board reporting. Pull the overview pages from transport, supply chain and fleet into one deck for a single source of truth.
Explore More Templates
Looking for more? Browse the full Logistics & Transportation templates, our Excel Dashboards collection, and read more Excel tutorials on PK: An Excel Expert.
Frequently Asked Questions
What software do I need to use the Logistics Manager Toolkit?
Just Microsoft Excel. Every dashboard is built with native PivotTables, slicers, formulas and charts — no Power BI, no add-ins and no subscriptions.
How much do I save by buying the bundle?
The eight dashboards cost $122.92 when purchased individually. The bundle is $73.99, so you save $48.93 — a 40% discount.
Can I customize the dashboards?
Yes. Because they’re standard Excel files, you can add columns, change formulas, rebrand colors and adapt them to your own data freely.
Is the sample data included?
Yes. Each template ships with realistic sample data so you can see how it works, then simply replace it with your own.
Who is this toolkit best for?
Logistics and transport managers, supply chain analysts, fleet and operations managers, and eCommerce or retail teams who want enterprise-grade analytics without enterprise software costs.
Do I get free updates?
You receive the current versions of all eight templates on purchase. Keep an eye on your account and our channels for improved editions.
Ready to Streamline Your Logistics Reporting?
Get all 8 Excel dashboards for $73.99 (save $48.93)
🎥 For step-by-step walkthroughs of these dashboards, visit our YouTube channel.