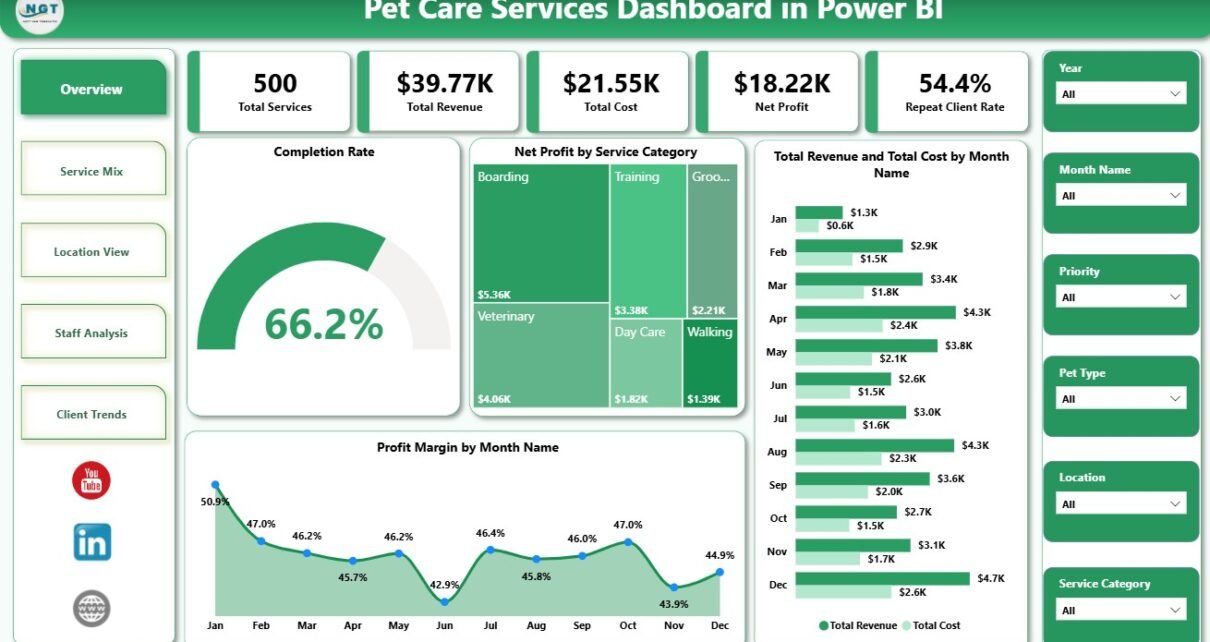
The Pet Care Services Dashboard in Power BI is a ready-to-use reporting template for grooming salons, pet daycare centers, boarding facilities, trainers, veterinary support teams, and multi-location pet service businesses. It includes 5 Power BI pages, 5 headline KPI cards, multiple slicers, and 15 chart views for service volume, revenue, cost, net profit, repeat clients, completion rate, locations, staff, booking channels, pet types, and priority trends.
Many pet care teams can export daily service records, but still lack a clean monthly dashboard for decisions. This template turns those exported rows into visual analysis in Power BI Desktop, helping owners and managers review service profitability, staff contribution, client behavior, and location performance without rebuilding visuals from scratch.
Click here to purchase Pet Care Services Dashboard in Power BI
Key Features of Pet Care Services Dashboard in Power BI
- 5 report pages: Overview, Service Mix, Location View, Staff Analysis, and Client Trends.
- 5 KPI cards: Total Services, Total Revenue, Total Cost, Net Profit, and Repeat Client Rate.
- Multiple slicers: Filter the dashboard quickly by the available business dimensions in your data.
- Service profitability: Compare revenue, cost, net profit, and profit margin across categories and months.
- Staff analysis: Review repeat client rate, satisfaction score, revenue, and cost by staff member.
- Location and booking insights: Compare completed services, total services, and revenue by booking channel.
- Client trend review: Analyze quarterly net profit, monthly completed services, and service priority mix.
Dashboard Pages Explanation
1. Overview Page
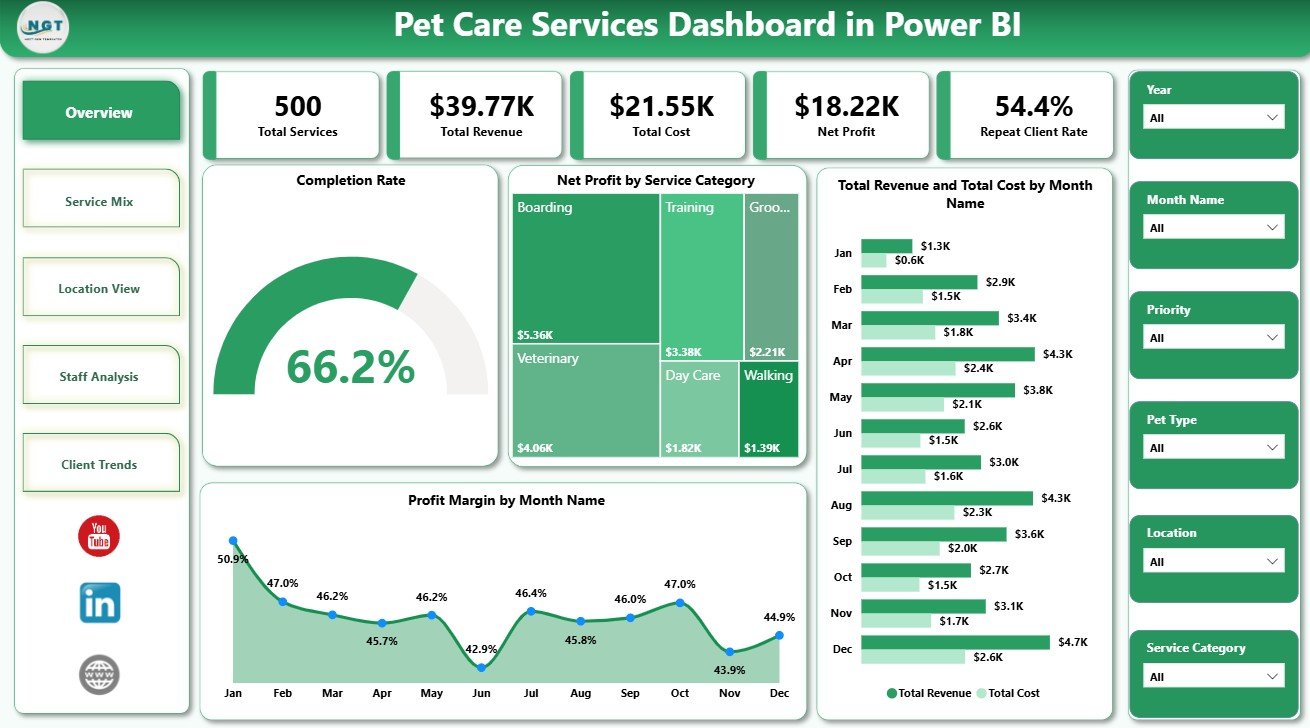
The Overview page is the executive snapshot. At the top, it shows Total Services, Total Revenue, Total Cost, Net Profit, and Repeat Client Rate so you can review business health before drilling into deeper service, staff, location, and client views.
Completion Rate by Service Status shows how services are distributed across completed, pending, cancelled, or other statuses in your dataset. It helps managers identify service follow-up needs, bottlenecks, and operational reliability.
Net Profit by Service Category compares which service categories contribute the most bottom-line value. Use this chart to decide whether grooming, boarding, daycare, training, wellness, or other service lines deserve more focus.
Total Revenue and Total Cost by Month Name compares income and delivery cost month by month. It is useful for seeing whether revenue growth is also creating cost pressure.
Profit Margin by Month Name shows how margin changes across the year. A high-revenue month with weak margin can signal discounting, staffing pressure, or rising service costs.
Pet Care Services Dashboard in Power BI
2. Service Mix
The Service Mix page helps you understand the distribution of pet service demand and revenue. It gives managers a clear way to compare pet type, service category, cost, revenue, and staff volume from one page.
Total Revenue by Pet Type shows which pet types contribute the most revenue. This can guide service packaging, staffing skills, and promotional focus.
Total Revenue and Total Cost by Service Category compares income and expense by service line. It helps identify high-revenue categories that may also need cost control.
Total Services by Staff Member shows workload by employee. Use it to review staff allocation and see whether service volume is balanced.
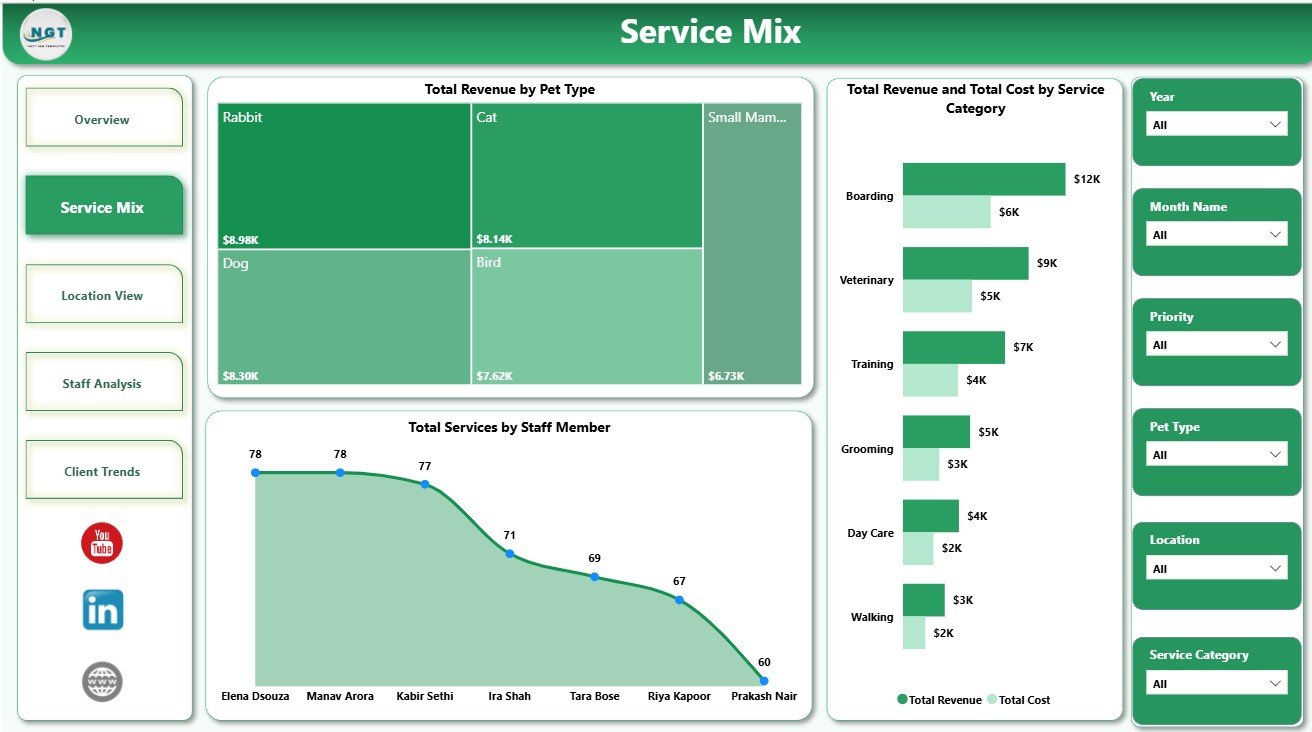
Service Mix
3. Location View
The Location View tab is built for pet service businesses that operate across branches, neighborhoods, stores, clinics, or service areas. It helps owners compare where work is completed and which channels generate revenue.
Completed Services by Location compares completed workload across locations. It helps identify busy branches, underused locations, and areas that may need operational support.
Total Revenue by Booking Channel shows which booking channels bring in the most revenue. Owners can compare website, phone, app, walk-in, referral, or partner channels when those fields exist in the data.
Total Services by Location compares total service volume by branch or area. Pair it with completed-service analysis to understand throughput and demand.
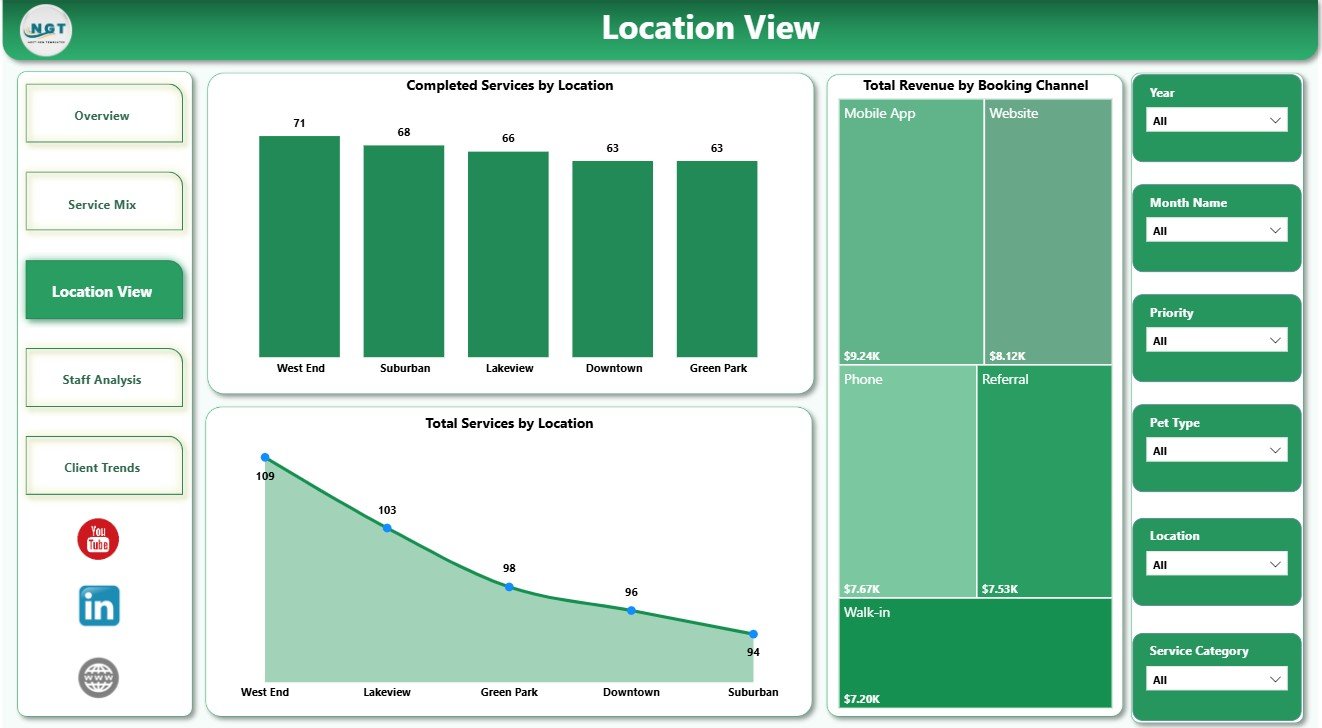
Location View
4. Staff Analysis
The Staff Analysis page supports manager review, coaching, scheduling, and service-quality conversations. Instead of relying on opinion, managers can compare repeat clients, satisfaction, revenue, and cost by staff member.
Repeat Client Rate by Staff Member helps identify employees associated with stronger client retention. This can reveal service quality, rapport, and repeat booking behavior.
Average Satisfaction Score by Staff Member shows customer experience by employee. Managers can recognize strong performers and plan training where satisfaction needs support.
Total Revenue and Total Cost by Staff Member compares each employee’s revenue contribution against related cost. It is useful for scheduling, coaching, and service assignment decisions.
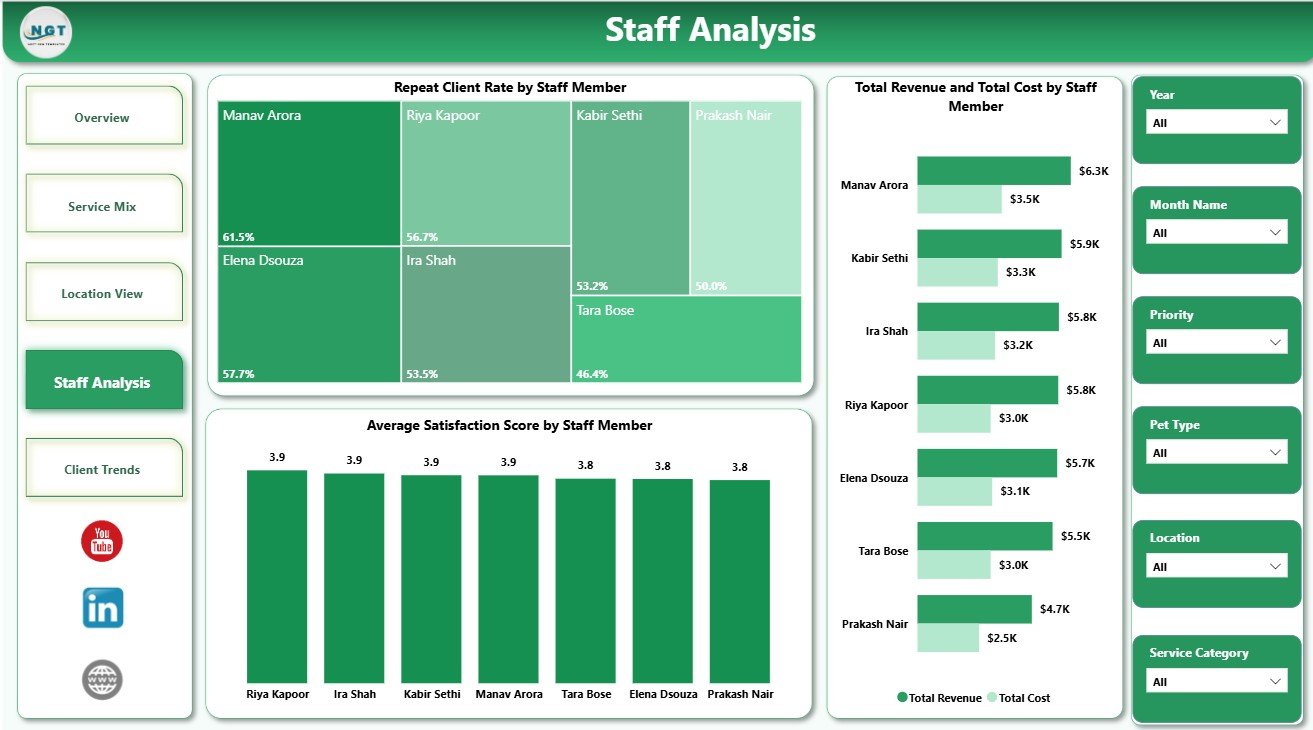
Staff Analysis
5. Client Trends
The Client Trends page is designed for longer-term review. It helps owners understand whether profit, completion, and priority mix are changing across months and quarters.
Net Profit by Quarter shows profitability across the year. This helps owners identify strong quarters, slow periods, and seasonal performance changes.
Completed Services by Month Name tracks completed workload by month. It can support staffing, promotion timing, and capacity planning.
Total Services by Priority shows how service volume is distributed across priority levels. It helps managers understand urgency mix and whether high-priority services are taking too much capacity.
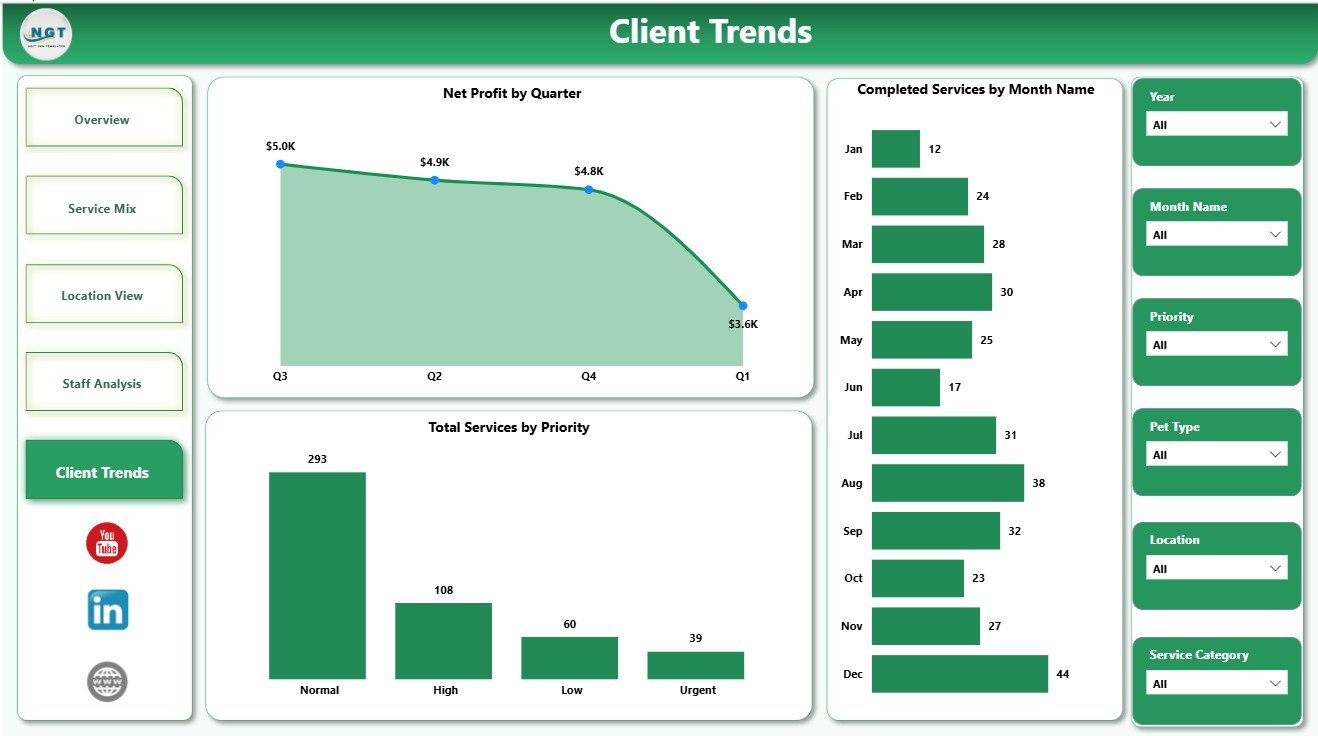
Client Trends
Pet Care Services Dashboard in Power BI vs. Tableau vs. Paid CRM/SaaS – Feature Comparison
| Feature | Pet Care Services Dashboard in Power BI | Tableau Dashboard | Paid Pet Care SaaS |
|---|---|---|---|
| Cost | $17.99 one-time sale price | Requires Tableau setup and licensing | Monthly or annual subscription |
| Platform | Power BI Desktop | Tableau Desktop or Cloud | Vendor-hosted web app |
| Setup time | Open .pbix file and replace sample data/source | Build or customize dashboard | Onboarding and configuration |
| Real-time team collaboration | Possible after publishing to Power BI Service | Possible with Tableau Cloud/Server | Usually included |
| Mobile access | Available through Power BI Service/mobile app | Available with paid cloud setup | Usually included |
| Customizable fields | Editable model, visuals, pages, and measures | Editable with Tableau skills | Often plan or admin dependent |
| Share with link | Available after publishing to Power BI Service | Available with cloud/server sharing | Vendor login controlled |
| Year-1 cost at 5 users | Template price plus your Power BI licensing choice | Often much higher licensing cost | Often hundreds or thousands |
| Pet service reporting | Included across 5 dashboard pages | Requires custom design | Depends on reporting module |
Who Should Use This Template
This template is best for pet grooming salons, dog daycare businesses, boarding centers, pet trainers, veterinary support service teams, franchise managers, and consultants who already have service records and want repeatable reporting in Power BI.
It is not a booking system, payment processor, customer messaging app, POS tool, inventory platform, or medical records system. Use it for analytics and management reporting, not for regulated veterinary documentation or operational scheduling.
Real-World Use Cases
Meera runs a grooming salon. She checks Net Profit by Service Category and Profit Margin by Month to decide which packages should be promoted next month.
James manages two daycare locations. He compares Completed Services by Location and Total Services by Priority to decide where additional staff coverage is needed.
Priya consults for a boarding business. She uses Repeat Client Rate by Staff Member and Average Satisfaction Score by Staff Member to prepare coaching recommendations.
Advantages of Pet Care Services Dashboard in Power BI
The biggest advantage is speed. The report already includes the pages, KPI cards, slicers, and visuals, so you can move from raw service records to dashboard review without designing everything manually.
The second advantage is flexibility. Because this is a Power BI file, you can edit visuals, measures, fields, themes, and pages as your pet care business grows. You also avoid the recurring cost of a full SaaS platform when you only need analytics.
Opportunities for Improvement
This dashboard depends on structured service data. If your booking export has missing dates, inconsistent staff names, blank categories, or mixed location spelling, you may need to clean the data before refresh. Future versions could add lifetime value, package profitability, marketing campaign analysis, and automated source connectors.
Best Practices
Keep your source data clean and consistent. Use the same spelling for staff members, service categories, booking channels, pet types, locations, priority values, and service statuses. Before refreshing the dashboard, check for blank dates, missing cost values, and duplicate records.
For official guidance on using Power BI Desktop, see Microsoft Learn: Get started with Power BI Desktop.
Explore Relevant Templates
Compare this template with Pet Care Services Dashboard in Excel, Pet Care Business Dashboard in Power BI, and Pet Care Services KPI Dashboard in Power BI. For more BI products, browse the Power BI Dashboard Templates category.
Frequently Asked Questions
What does the Pet Care Services Dashboard in Power BI track?
It tracks Total Services, Total Revenue, Total Cost, Net Profit, Repeat Client Rate, completion rate, service status, service category, month, profit margin, pet type, staff member, location, booking channel, satisfaction score, quarter, and priority.
Can I use my own data?
Yes. Replace the sample source with your own service records and refresh the Power BI report.
Do I need advanced Power BI knowledge?
No. Basic Power BI Desktop skills are enough to open the file, refresh data, use slicers, and review pages. Advanced users can customize visuals and measures.
Is this a booking or billing system?
No. It is a dashboard template for reporting and analysis. It does not replace booking, POS, billing, payment processing, medical records, or customer messaging software.
Can I publish the dashboard online?
Yes, if you have the correct Power BI account, workspace, and sharing permissions, you can publish it to Power BI Service.
Is there an Excel version?
Yes. The related Pet Care Services Dashboard in Excel is available for teams that prefer Excel-based reporting.
About the Author
Built by PK – Microsoft Certified Professional with 15+ years of Excel, Google Sheets, and Power BI experience. Founder of NextGenTemplates, reaching 300K+ subscribers across YouTube channels. Every template is hand-built and tested before release.
Conclusion
The Pet Care Services Dashboard in Power BI gives pet service businesses a practical way to review service volume, revenue, cost, profit, staff results, location performance, booking channels, repeat clients, and monthly trends. With five ready-made Power BI pages and multiple slicers, it helps owners and managers move from exported records to clearer decisions.
Click here to purchase Pet Care Services Dashboard in Power BI
Last updated: July 24, 2026.
Watch Power BI and dashboard tutorials on YouTube.com/@PK-AnExcelExpert.