More than 11,000 wineries operate in the United States, and many craft wineries still track tasting room revenue, wine club growth, vineyard production, inventory, and event performance in separate spreadsheets. The Craft Winery and Vineyard Dashboard in Excel gives winery owners, vineyard managers, and wine business consultants a single Excel dashboard for sales, operations, visitor club activity, and inventory reporting.
This ready-to-use Excel dashboard includes 7 worksheet tabs, 5 headline KPI cards, 18 dashboard charts, multiple slicers, a structured Data sheet, and a Support sheet with pivot tables. Replace the sample data, click Data > Refresh All, and the full workbook refreshes. It is built for teams that want practical winery analytics without paying hundreds of dollars per month for winery SaaS.
Key Features of Craft Winery and Vineyard Dashboard in Excel
Click here to purchase the Craft Winery and Vineyard Dashboard in Excel
The dashboard is built in Microsoft Excel and uses native Excel features such as pivot tables, slicers, charts, and formulas. No VBA or macros are required. This makes the workbook easier to open, audit, customize, and share through OneDrive or SharePoint.
The workbook includes five dashboard pages: Overview, Sales Mix, Vineyard Ops, Visitor Club, and Inventory. It also includes a Data sheet where users enter or paste their winery records, plus a Support sheet where the pivot tables sit behind the dashboard. Slicers let users filter the dashboard quickly by the available dimensions in the data, such as period, sales channel, event type, grape variety, bottle size, customer segment, region, and vineyard block.
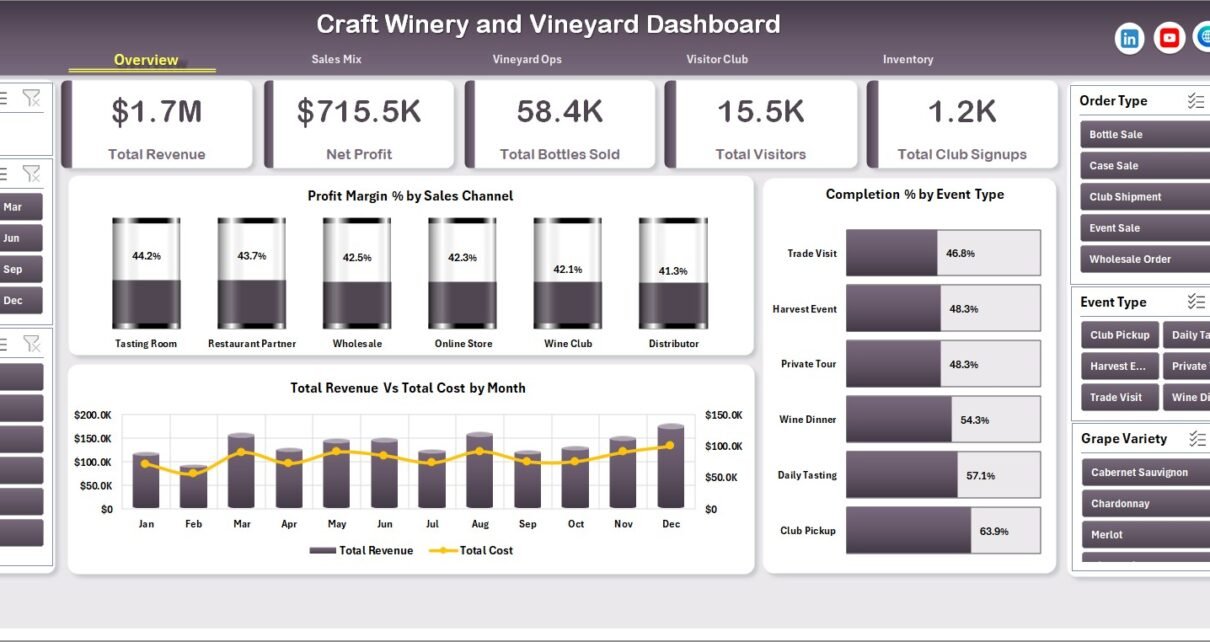
At the top level, users can monitor Total Revenue, Net Profit, Total Bottles Sold, Total Visitors, and Total Club Signups. These cards give owners and managers a fast read on financial health, cellar movement, tasting room traffic, and recurring customer growth.
Dashboard Pages Explanation
1. Overview Page
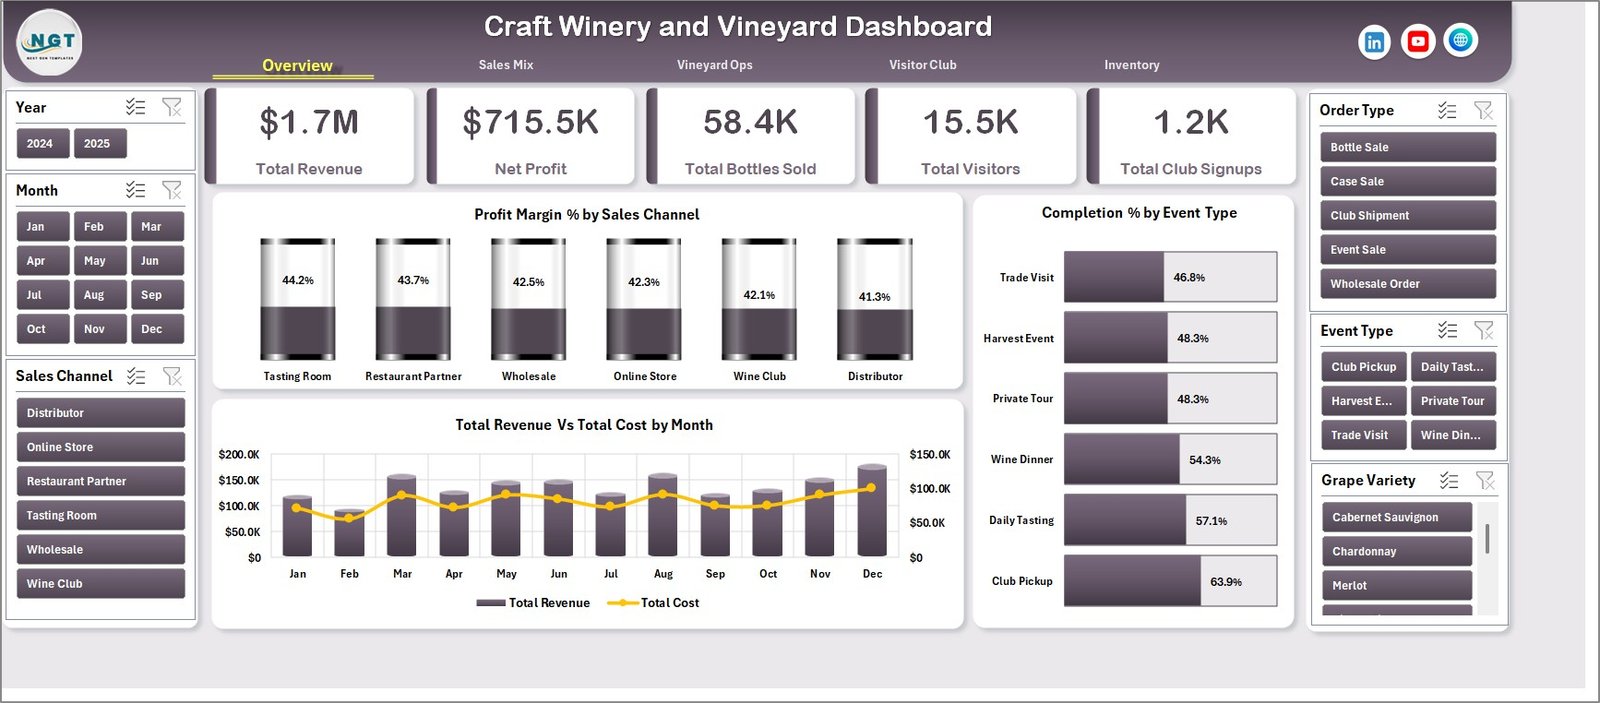
The Overview page is the executive screen for the workbook. On the top of the sheet, KPI cards show high-level information: Total Revenue, Net Profit, Total Bottles Sold, Total Visitors, and Total Club Signups. These cards help winery owners see whether sales, profitability, visitor traffic, and club acquisition are moving in the right direction before they review deeper pages.
The page also includes multiple slicers so users can apply filters and see the filtered dashboard quickly. Use this page during monthly owner reviews, sales meetings, and tasting room performance discussions.
Profit Margin % by Sales Channel
This chart shows which channels are generating healthier margins after cost is considered. It helps compare direct-to-consumer, wholesale, online, event, or tasting room activity based on the data structure.
Completion % by Event Type
This chart highlights how different event types perform against completion targets or planned activity. It is useful for reviewing tastings, tours, wine club events, private events, and seasonal campaigns.
Total Revenue Vs Total Cost by Month
This month-wise comparison shows whether revenue is staying ahead of cost over time. It is one of the most important visuals for spotting seasonal pressure, pricing issues, or cost-heavy months.
Craft Winery and Vineyard Dashboard in Excel
2. Sales Mix
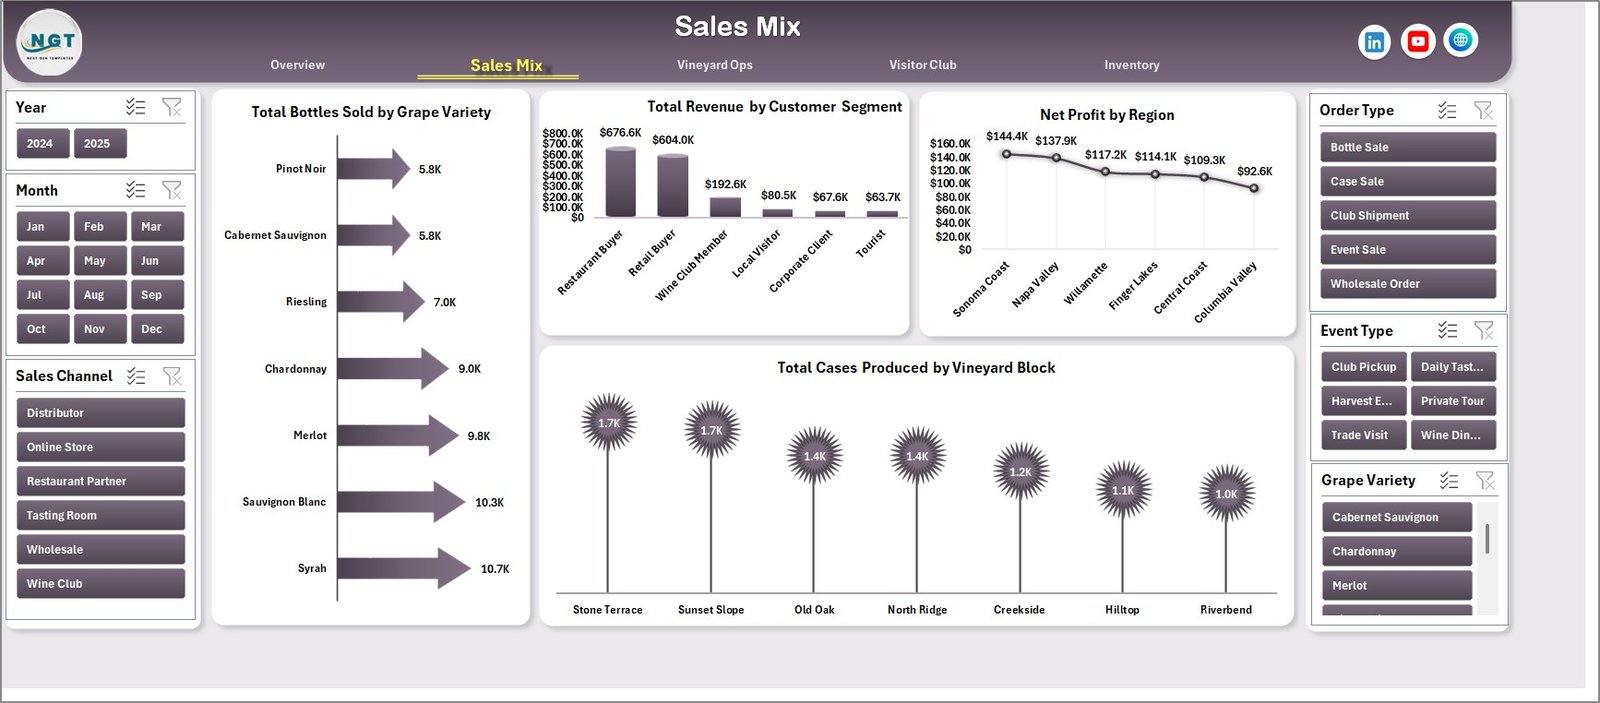
The Sales Mix sheet tab is built for understanding where bottle volume, revenue, profit, and production contribution are coming from. This page helps teams compare grape varieties, customer segments, regions, and vineyard blocks in one place.
Total Bottles Sold by Grape Variety
This chart shows which grape varieties are driving bottle movement. It helps identify best-selling varieties and informs future planting, sourcing, bottling, and marketing decisions.
Total Revenue by Customer Segment
This chart breaks revenue down by customer type or segment. It helps compare tasting room buyers, club members, retail partners, wholesale customers, and other buyer groups.
Net Profit by Region
This chart shows which regions are contributing the most bottom-line profit. It helps winery teams decide where to focus distribution, events, sales support, or promotional activity.
Total Cases Produced by Vineyard Block
This chart connects vineyard blocks with production output. It helps operations teams compare block-level contribution and discuss yield planning, harvest strategy, and production capacity.
Sales Mix
3. Vineyard Ops
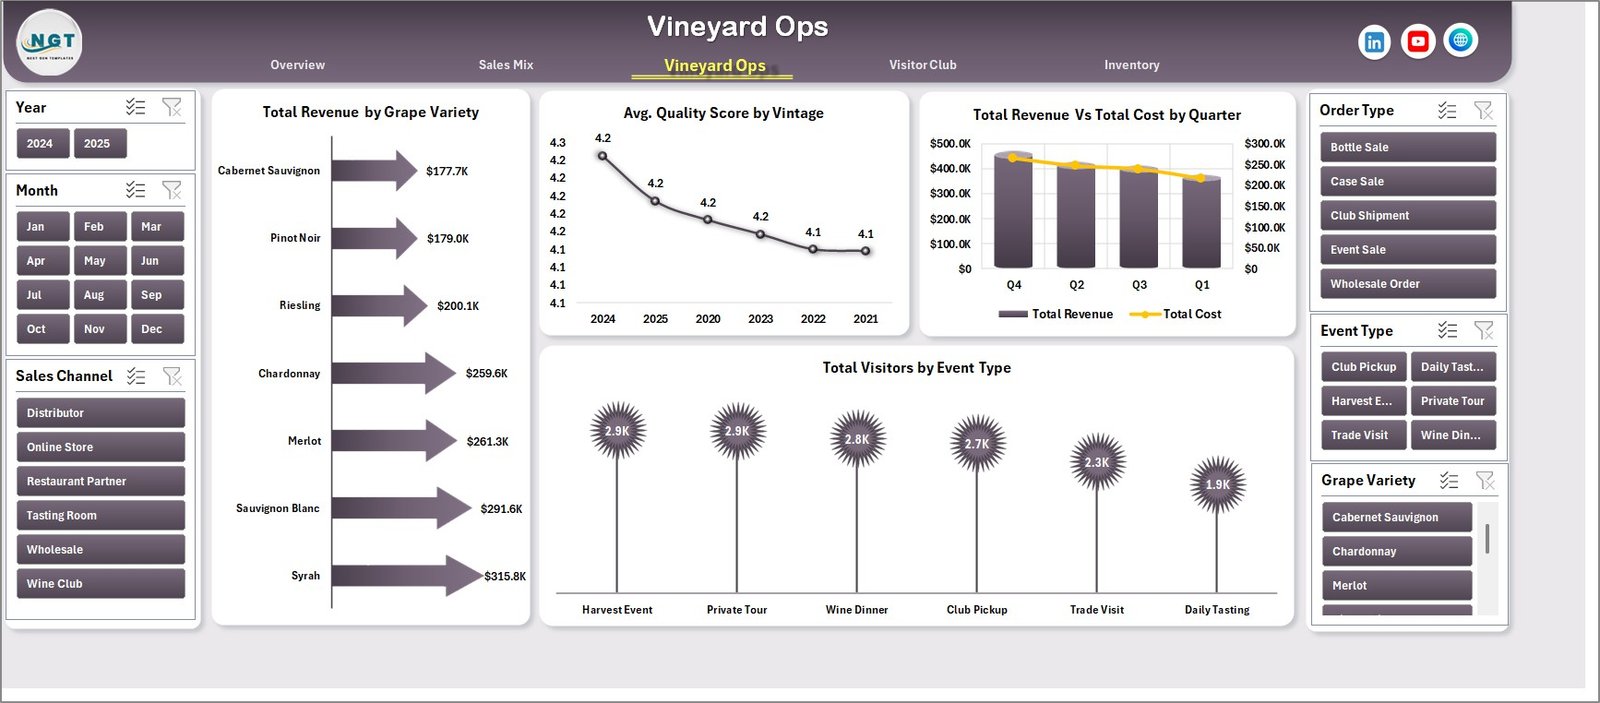
The Vineyard Ops sheet tab connects production, vintage quality, quarterly financials, and visitor activity. It is useful for owners and vineyard teams who want to understand how field, cellar, and visitor programs connect to revenue.
Total Revenue by Grape Variety
This chart shows revenue contribution by grape variety. It helps compare commercial performance across varietals and supports pricing, product mix, and bottling decisions.
Avg. Quality Score by Vintage
This chart compares vintage quality scores across years. It helps winemakers and owners review quality trends and connect vintage outcomes with sales performance.
Total Revenue Vs Total Cost by Quarter
This chart gives a quarterly view of revenue and cost. It is especially helpful for seasonal winery operations where harvest, production, events, and sales cycles do not behave evenly across the year.
Total Visitors by Event Type
This chart shows which event types attract the most visitors. It helps tasting room and marketing teams plan future events, staff schedules, and wine club acquisition activities.
Vineyard Ops
4. Visitor Club
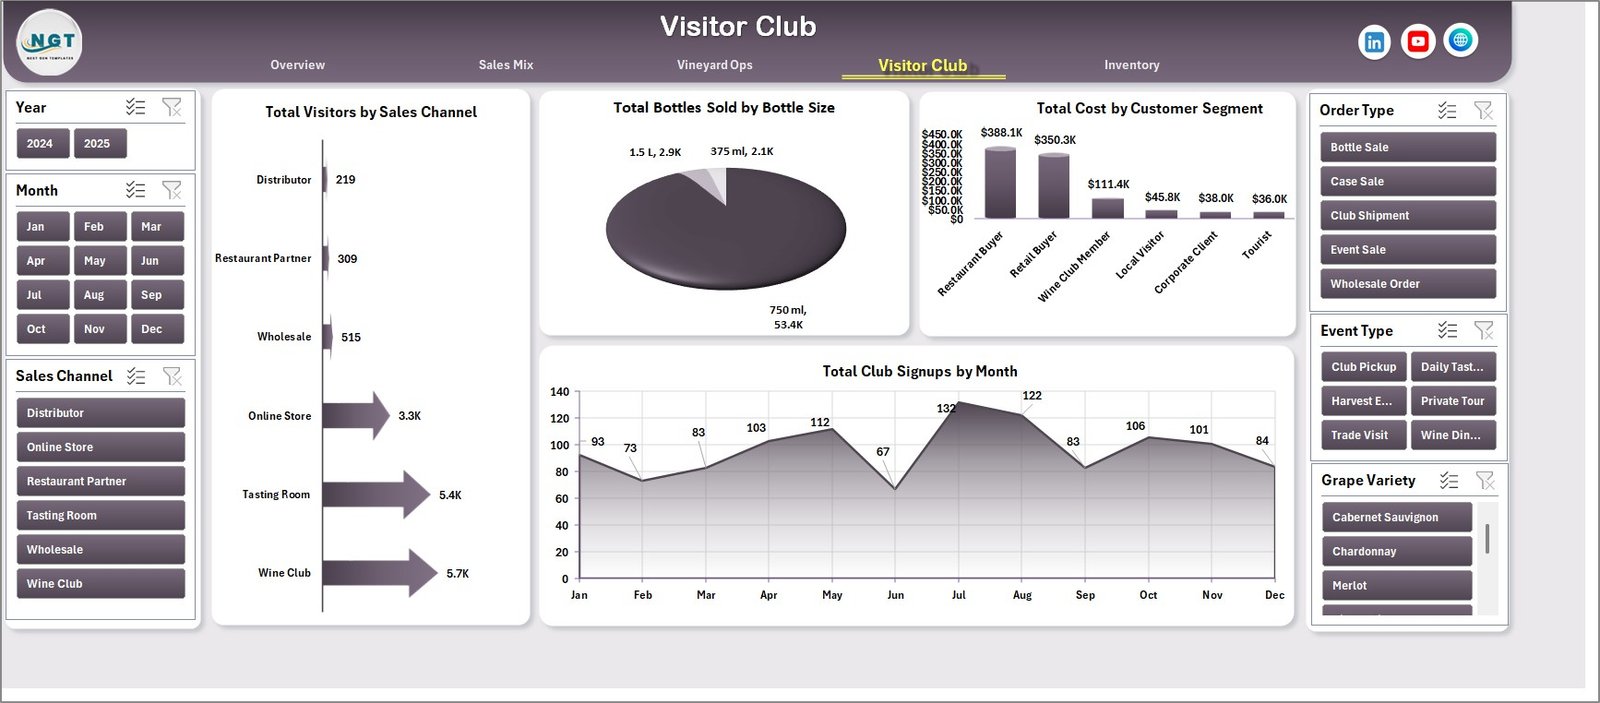
The Visitor Club page focuses on customer traffic, bottle preferences, customer segment cost, and wine club growth. It is built for tasting room managers, marketing teams, and owners who need a clearer view of visitor-to-member performance.
Total Visitors by Sales Channel
This chart shows where visitor or customer activity is coming from by channel. It helps compare tasting room, event, partner, online, and direct activity based on your data.
Total Bottles Sold by Bottle Size
This chart shows bottle movement by size. It helps identify buyer preferences and supports stock planning for standard bottles, magnums, half bottles, or other package formats.
Total Cost by Customer Segment
This chart shows which customer segments carry higher costs. It helps evaluate whether sales campaigns, events, wholesale activity, or club programs are worth the spend.
Total Club Signups by Month
This chart tracks wine club signup volume month by month. It helps teams evaluate tasting room campaigns, event conversion, seasonal traffic, and retention programs.
Visitor Club
5. Inventory
The Inventory page helps users review production by label, revenue by order type, and profit margin by region. It is a practical page for wine label planning, fulfillment reviews, and regional sales meetings.
Total Cases Produced by Wine Label
This chart shows production volume by wine label. It helps owners and cellar teams compare label-level output and decide where inventory may be too high or too low.
Total Revenue by Order Type
This chart compares revenue across order types. It helps evaluate whether club orders, tasting room orders, online orders, wholesale orders, or event orders are driving growth.
Profit Margin % by Region
This chart highlights margin differences by region. It helps teams identify markets where freight, discounts, distributor terms, or pricing may be reducing profitability.
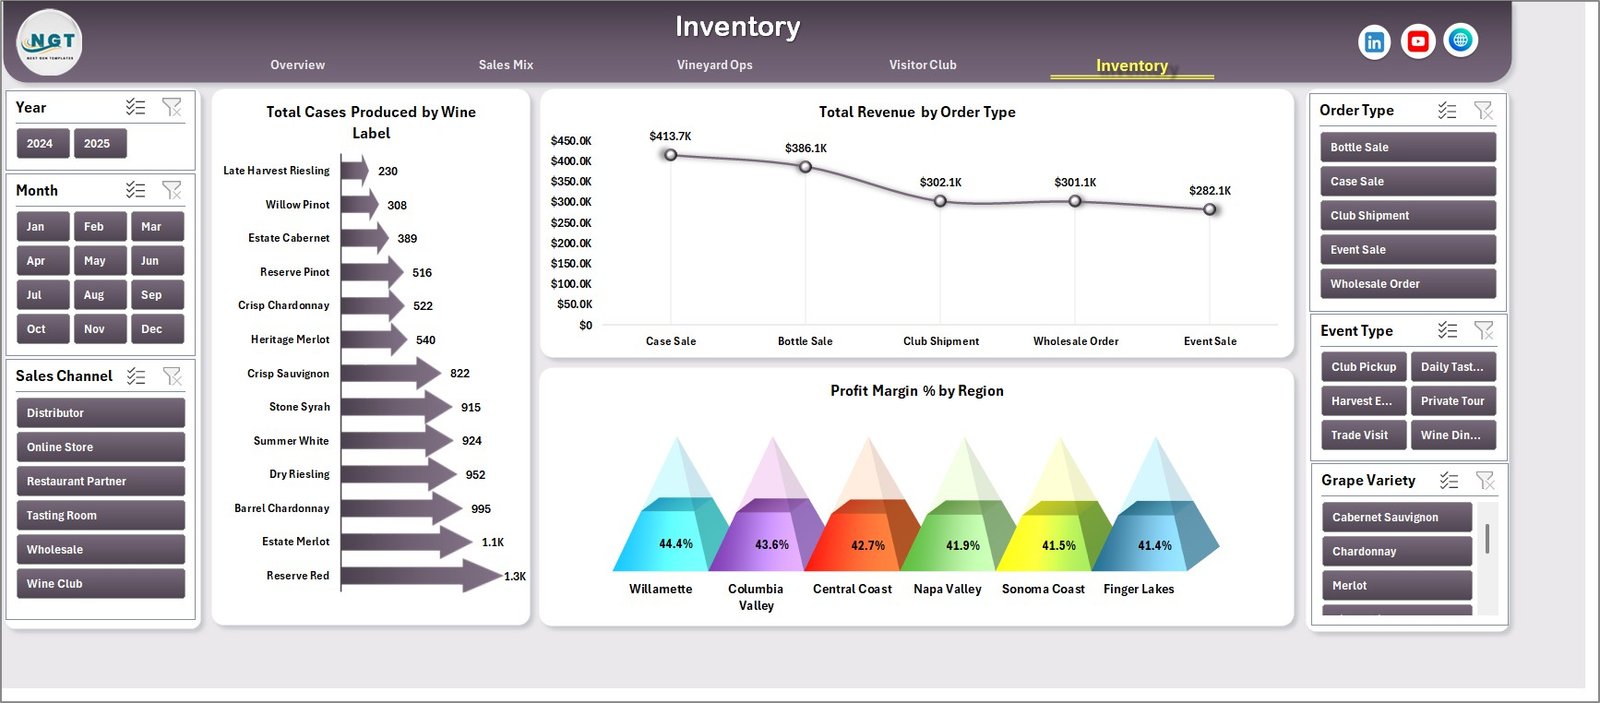
Inventory
6. Data Sheet Tab
The Data sheet is where users add or replace the sample data in the same format. Keep the headers and structure consistent, then paste new rows for winery sales, visitor, production, vineyard, event, cost, and inventory records. Once the data is updated, go to the Excel Ribbon and click Data > Refresh All.

Data Sheet tab
7. Support Sheet
The Support sheet contains multiple pivot tables used to create the entire dashboard dynamically. After updating the Data sheet, click Data > Refresh All in the Excel Ribbon. All pivots and charts will refresh. You can keep this sheet hidden so everyday users only work with the dashboard pages and Data sheet.

Support sheet tab
Craft Winery and Vineyard Dashboard in Excel vs. Google Sheets vs. Paid Winery SaaS – Feature Comparison
| Feature | This Excel Template | Google Sheets Alternative | Paid Winery SaaS |
|---|---|---|---|
| Cost | $17.99 one-time | Low cost or subscription | Often $200+ per month |
| Platform | Microsoft Excel | Browser spreadsheet | Cloud SaaS |
| Setup time | Under 10 minutes | Under 15 minutes | Days or weeks |
| Real-time team collaboration | Via OneDrive or SharePoint | Built in | Built in |
| Mobile access | Excel mobile app | Google Sheets mobile app | Native app or browser |
| Customizable fields | Fully editable workbook | Editable sheet | Plan dependent |
| Share with link | Via OneDrive or SharePoint | Yes | Yes |
| Year-1 cost at 5 users | $17.99 total | Usually low | $2,400+ typical |
| Pivot table transparency | Support sheet included | Depends on template | Usually hidden by vendor |
| Offline access | Yes | Limited | No |
Who Should Use This Template
This template is ideal for craft winery owners, vineyard managers, tasting room managers, wine club coordinators, cellar operations teams, and consultants who need repeatable reporting in Excel. It works best when the winery already has structured records for sales, visitors, events, grape varieties, wine labels, regions, costs, and production output.
It is not designed to replace full winery ERP software, POS systems, compliance platforms, or vineyard sensor systems. If you need TTB reporting, barcode inventory scanning, tank sensor integration, or automated POS imports, you may need a dedicated operational platform alongside this dashboard.
Real-World Use Cases
Maria runs a boutique tasting room. She uses the Visitor Club page to compare club signups by month with visitor activity by channel, then adjusts event calendars and staffing plans for the next month.
James manages vineyard operations. He reviews total cases produced by vineyard block and quality score by vintage before discussing harvest plans and field priorities with the owner.
Anika consults for small wineries. She loads client data into the Data sheet, refreshes the dashboard, and uses Sales Mix and Inventory pages to show which varieties, labels, regions, and order types deserve more attention.
Advantages of Craft Winery and Vineyard Dashboard in Excel
The main advantage is speed. You do not need to build a workbook from scratch, write formulas, design charts, or create pivot tables manually. The structure is already created, so users can focus on entering data and interpreting results.
The second advantage is ownership. Since this is an Excel workbook, the user can edit labels, add columns, modify slicers, and adapt the workbook to a specific winery process. For small wineries that want flexible reporting without monthly software costs, this is often the right balance.
The third advantage is visibility across different teams. Owners can use the Overview page, sales teams can review Sales Mix, operations teams can use Vineyard Ops, tasting room teams can use Visitor Club, and inventory planners can use Inventory.
Opportunities for Improvement
This template requires users to maintain the Data sheet manually or through their own export process. It does not connect automatically to a POS, wine club platform, accounting system, or vineyard management system. It also does not include compliance reporting, automated excise tax calculations, or inventory barcode scanning.
For best results, use this dashboard as the reporting layer after collecting data from your source systems. A clean monthly data update process will make the dashboard much more useful.
Best Practices
Keep the Data sheet structure consistent. Do not rename columns unless you also update the related pivot tables. Refresh the workbook after every data update. Use consistent names for grape varieties, regions, sales channels, event types, bottle sizes, and customer segments so slicers remain clean.
Review the Overview page first, then use the supporting pages to explain the movement. For example, if Net Profit is lower than expected, review Profit Margin % by Sales Channel, Net Profit by Region, Total Cost by Customer Segment, and Profit Margin % by Region to understand where the issue may be coming from.
Microsoft provides a helpful overview of Excel pivot table workflows here: Create a PivotTable to analyze worksheet data.
Explore Relevant Templates
Explore related templates from NextGenTemplates:
- Winery KPI Dashboard in Excel
- Winery KPI Scorecard in Excel
- Brewery & Winery Dashboard in Power BI
- Craft Brewery KPI Dashboard in Excel
Frequently Asked Questions
What is included in the Craft Winery and Vineyard Dashboard in Excel?
The workbook includes Overview, Sales Mix, Vineyard Ops, Visitor Club, Inventory, Data, and Support sheet tabs. It includes KPI cards, charts, slicers, a structured data input sheet, and pivot tables.
Can I use this dashboard for both winery and vineyard operations?
Yes. The workbook includes sales, visitor, club signup, wine label, grape variety, vintage, vineyard block, and inventory analysis, so it fits combined winery and vineyard reporting.
Do I need advanced Excel skills?
No. Basic Excel skills are enough for normal use. You only need to update the Data sheet and click Data > Refresh All. Advanced users can edit the Support sheet and pivot tables if needed.
Does this dashboard require macros?
No. It uses standard Excel features such as pivot tables, charts, slicers, and formulas. No VBA or macro security prompts are required.
Can I customize the dashboard pages?
Yes. The workbook is editable, so you can adjust headings, colors, chart layouts, slicers, and data fields to match your winery reporting style.
Which version of Excel do I need?
Use Microsoft Excel 2016 or later, including Microsoft 365. Modern Excel versions support the pivot charts and slicers used in this dashboard.
About the Author
Built by PK – Microsoft Certified Professional with 15+ years of Excel, Google Sheets, and Power BI experience. Founder of NextGenTemplates, reaching 300K+ subscribers across YouTube channels. Every template is hand-built and tested before release.
Conclusion
The Craft Winery and Vineyard Dashboard in Excel gives winery owners, vineyard managers, tasting room teams, and consultants a practical way to track revenue, net profit, bottles sold, visitors, club signups, sales mix, vineyard operations, visitor club activity, and inventory in one workbook. With refreshable pivot tables, slicers, 7 tabs, and 18 charts, it helps turn raw winery records into decisions.
Click here to purchase the Craft Winery and Vineyard Dashboard in Excel
Last updated: July 2026
Visit our YouTube channel for step-by-step Excel tutorials: Youtube.com/@PKAnExcelExpert