A rights agency’s numbers live in a deal register, and a deal register is a wall of rows. The Content Rights Agencies Dashboard in Excel puts a reporting layer over that wall: 500 licence deals, $53.0M of contract value, $22.9M of net agency margin and 181 renewals – a 36.2% renewal rate – laid out on five pages that each print to a single landscape sheet. This walkthrough covers what is on every page, what the numbers in the sample file actually say, where the template stops, and how to load your own deals into it.
Key Features of the Content Rights Agencies Dashboard in Excel
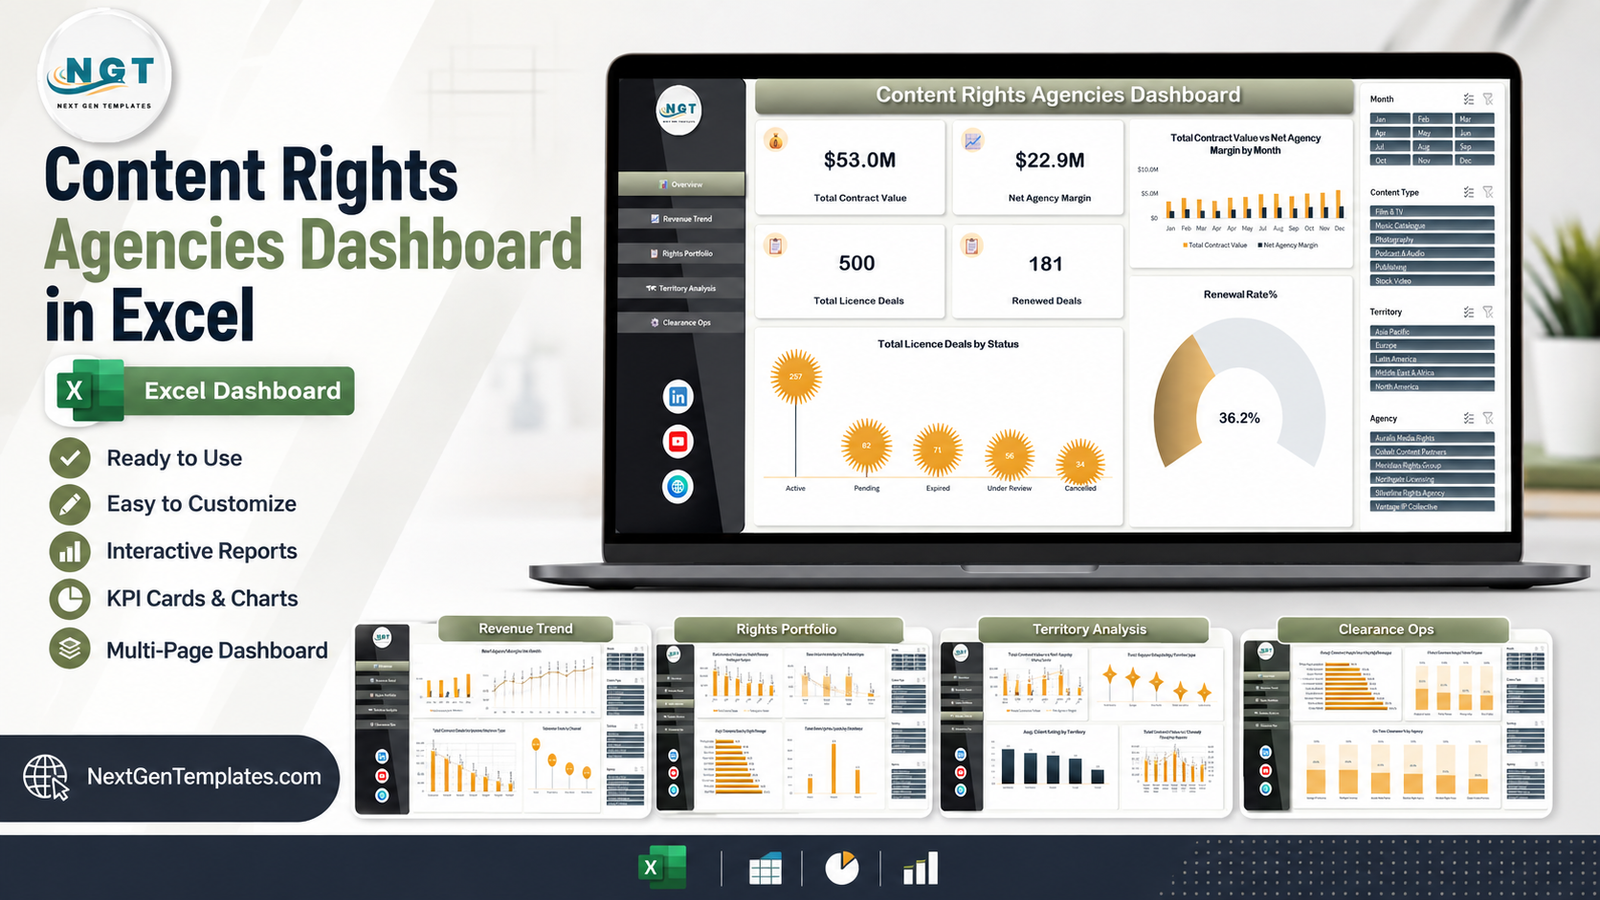
- Five dashboard pages – Overview, Revenue Trend, Rights Portfolio, Territory Analysis and Clearance Ops – sharing one left-hand navigation rail.
- Four KPI cards on the Overview page: Total Contract Value, Net Agency Margin, Total Licence Deals and Renewed Deals.
- Four slicers – Month, Content Type, Territory and Agency – wired to a single pivot cache, so one click re-filters all fifteen charts on all five pages at once.
- A 500-row source table named
TblDatawith 29 columns, including Deal ID, Date, Agency, Rights Manager, Content Type, Rights Type, Territory, Licensee Type, Channel, Licence Duration, Contract Value, Royalty Payout, Operating Cost, Clearance Days, Client Satisfaction, Infringement Cases, Status and Renewal Status. - No macros, no add-ins, no Power Query. It is a plain .xlsx that opens in Excel 2016, 2019, 2021 and Microsoft 365.
- A user manual PDF ships in the same ZIP as the workbook.
Dashboard Pages Explanation
Page 1 – Overview
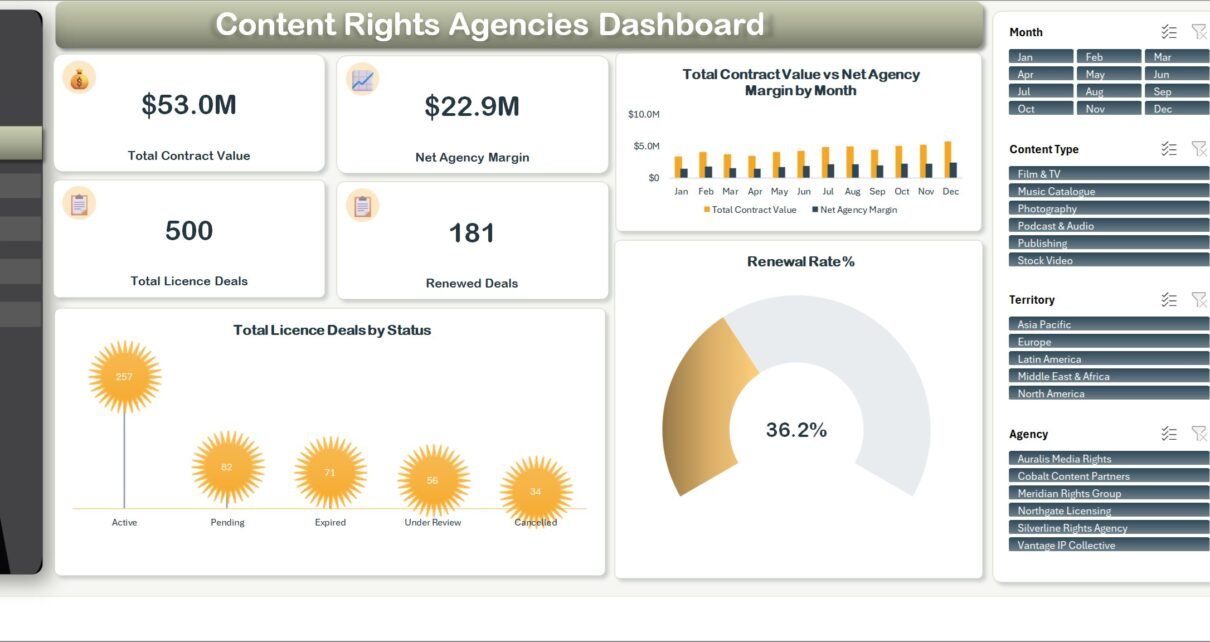
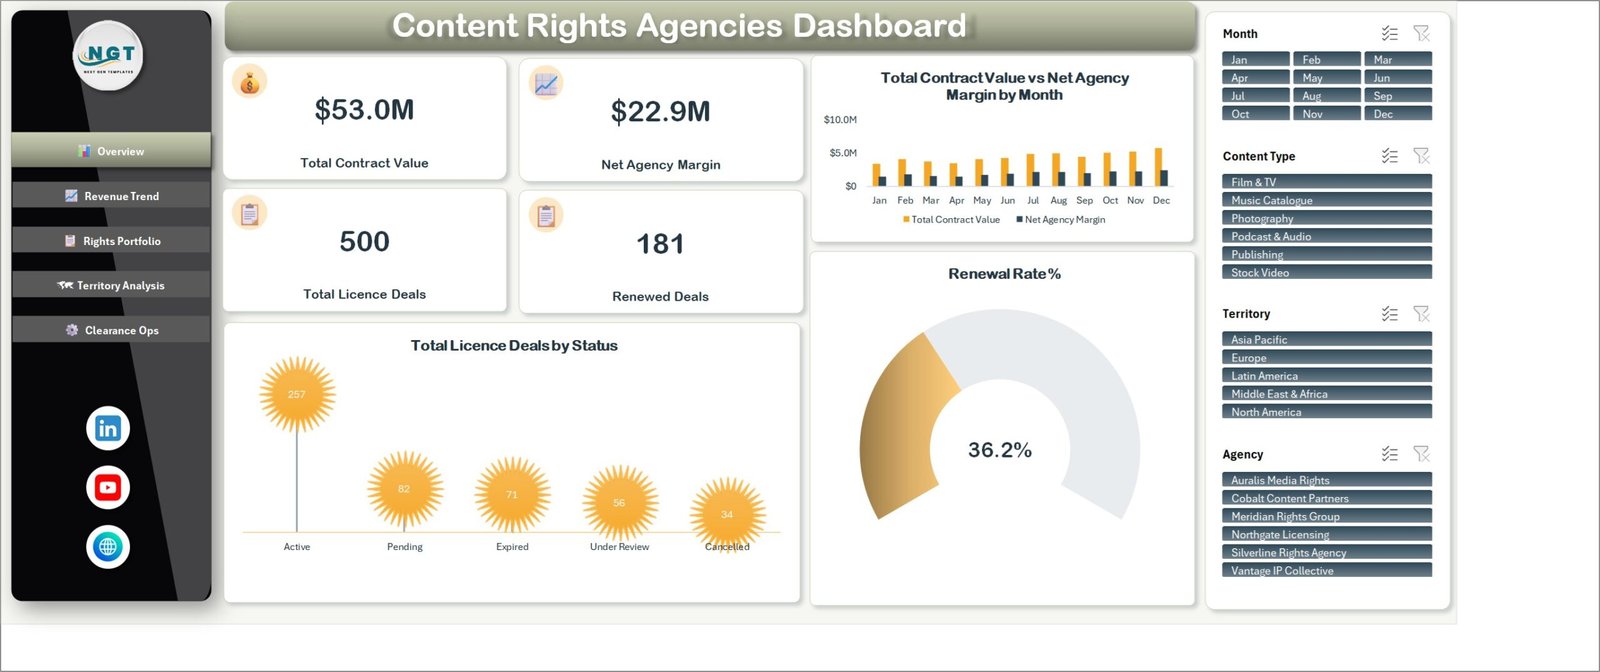
Four cards run across the top: Total Contract Value $53.0M, Net Agency Margin $22.9M, Total Licence Deals 500 and Renewed Deals 181. To the right, Total Contract Value vs Net Agency Margin by Month pairs the two measures as clustered columns so you can see whether a strong revenue month was also a profitable one. Below it, a half-doughnut gauge shows Renewal Rate % at 36.2% – the 181 renewals divided by the 500 deals.
The lower-left panel, Total Licence Deals by Status, is where a rights manager will spend the most time. In the sample data it splits into Active 257, Pending 82, Expired 71, Under Review 56 and Cancelled 34. Those five add back to 500, so nothing is quietly excluded: 127 deals – a quarter of the book – are sitting in Pending or Under Review, which is the pipeline that either becomes revenue or ages out.
Page 2 – Revenue Trend
Four charts, all about where the money comes from and what it costs to earn.
- Total Contract Value vs Total Royalty Payout by Quarter – Q1 $11.2M against $5.2M of payout, rising to Q4 $15.9M against $7.5M. Contract value grows 42% from Q1 to Q4 while the payout ratio stays close to 47%, which is the number a finance lead will want to hold steady.
- Net Agency Margin by Month – a line running from $1.4M in January to $2.4M in December, with a dip in April back to $1.4M.
- Total Contract Value vs Net Agency Margin by Licensee Type – Streaming Platform $15.9M, Broadcaster $13.3M, Advertiser $10.7M, Publisher $6.2M, Corporate $4.0M and Education $2.9M.
- Total Contract Value by Channel – Direct $21.6M, Partner Agency $13.9M, Online Portal $9.7M and Broker Network $7.9M. Direct is 41% of the book, which is the argument for or against how much the agency pays away in brokerage.
Page 3 – Rights Portfolio
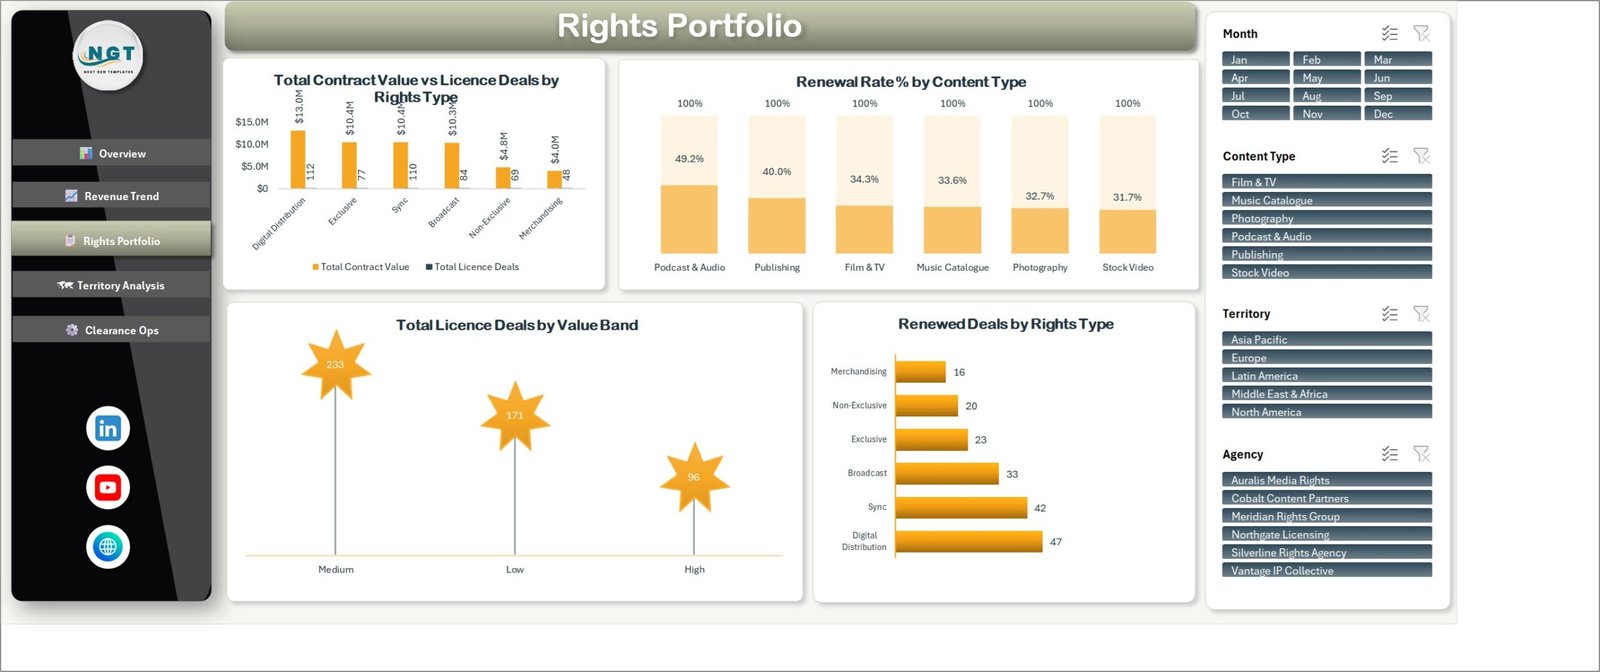
This page answers what kind of rights the agency is actually selling. Total Contract Value vs Licence Deals by Rights Type shows Digital Distribution leading on $13.0M from 112 deals, then Exclusive $10.4M from 77, Sync $10.4M from 110, Broadcast $10.3M from 84, Non-Exclusive $4.8M from 69 and Merchandising $4.0M from 48. Exclusive and Sync earn almost the same total from very different deal counts – $135K per exclusive deal against $95K per sync deal – and that gap is the point of plotting value and volume together.
Renewal Rate % by Content Type ranks Podcast & Audio at 49.2%, Publishing 40.0%, Film & TV 34.3%, Music Catalogue 33.6%, Photography 32.7% and Stock Video 31.7%. Total Licence Deals by Value Band splits the book into Medium 233, Low 171 and High 96, and Renewed Deals by Rights Type shows where the 181 renewals came from: Digital Distribution 47, Sync 42, Broadcast 33, Exclusive 23, Non-Exclusive 20 and Merchandising 16.
Page 4 – Territory Analysis
Total Contract Value vs Net Agency Margin by Territory puts North America at $19.9M / $8.7M, Europe $14.1M / $6.2M, Asia Pacific $10.6M / $4.5M, Latin America $4.5M / $2.0M and Middle East & Africa $3.9M / $1.6M. Total Licence Deals by Territory gives the matching counts – 163, 123, 109, 54 and 51 – so you can see that North America’s lead is both more deals and bigger deals.
Total Contract Value vs Total Royalty Payout by Agency ranks the six agencies in the sample: Auralis Media Rights $10.4M, Meridian Rights Group $10.3M, Northgate Licensing $10.1M, Silverline Rights Agency $7.6M, Cobalt Content Partners $7.4M and Vantage IP Collective $7.3M. The fourth chart, Avg. Client Rating by Territory, is the weakest on the page – every territory lands on 4.0 except Middle East & Africa at 3.9, so the bars are nearly identical and the axis repeats labels at one decimal place. Treat it as a sanity check, not a ranking.
Page 5 – Clearance Ops
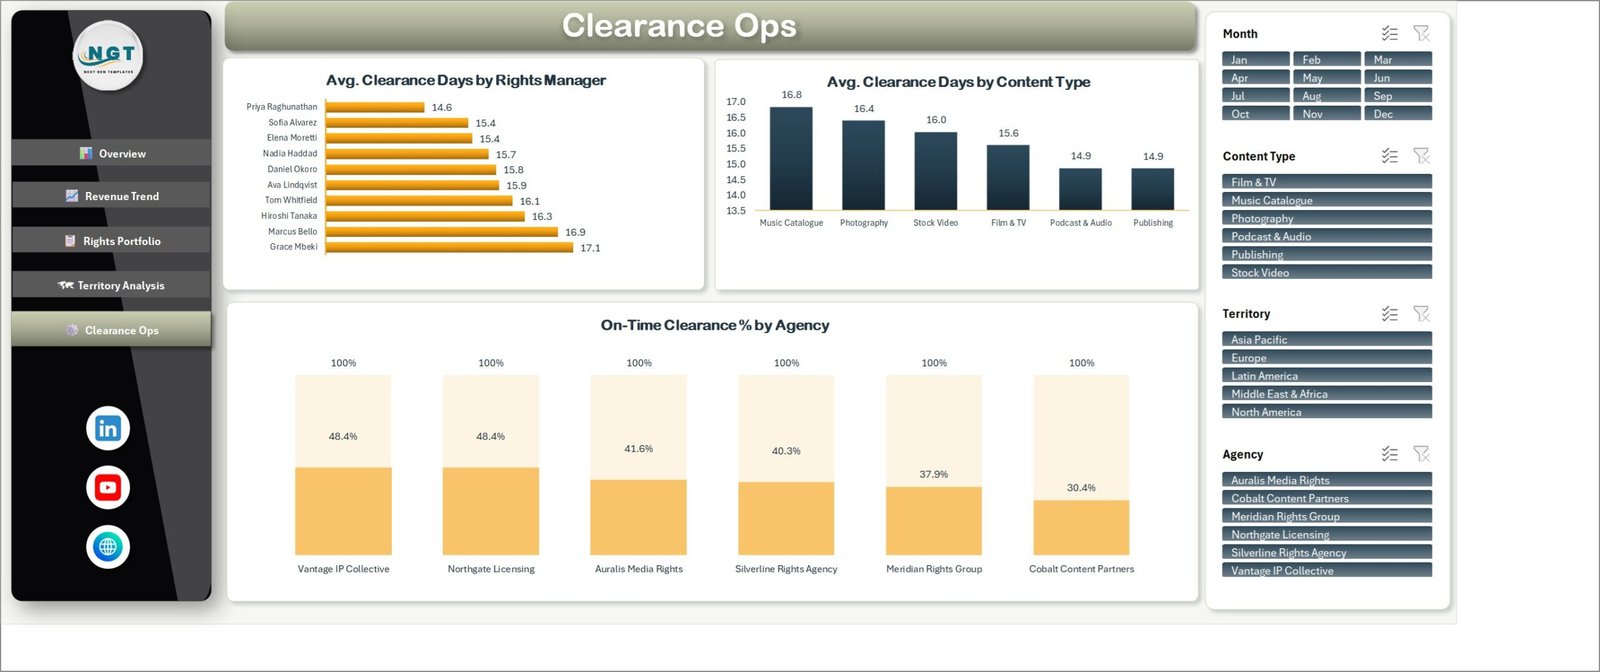
The operational page. Avg. Clearance Days by Rights Manager ranks ten named managers from 14.6 days to 17.1 days – a 2.5-day spread that is small enough to say the team is consistent and large enough to be worth a conversation. Avg. Clearance Days by Content Type shows Music Catalogue slowest at 16.8 days and Publishing and Podcast & Audio quickest at 14.9.
The chart that matters most is On-Time Clearance % by Agency: Vantage IP Collective and Northgate Licensing both at 48.4%, Auralis Media Rights 41.6%, Silverline Rights Agency 40.3%, Meridian Rights Group 37.9% and Cobalt Content Partners 30.4%. Nobody clears half their work on time in the sample data, which is exactly the kind of finding a dashboard is supposed to surface.
Content Rights Agencies Dashboard in Excel vs. Google Sheets vs. Paid Rights SaaS – Feature Comparison
| This Excel dashboard | Google Sheets build | Paid rights management SaaS | |
|---|---|---|---|
| Cost | $17.99 once | Free tool, your build time | $150-$600 per user per month |
| Platform | Excel 2016+ / Microsoft 365, works offline | Browser, Google account required | Vendor cloud |
| Setup time | About 15 minutes to paste and refresh | Days of chart and formula work | Weeks of onboarding |
| Real-time team collaboration | Via OneDrive or SharePoint co-authoring | Yes, native | Yes, native |
| Mobile access | Excel mobile app | Yes | Yes |
| Customisable fields | All 29 columns are editable | Yes, if you rebuild the charts | Only what the vendor exposes |
| Share with a link | Yes, from OneDrive | Yes | Yes |
| Year-1 cost at 5 users | $17.99 | $0 plus your hours | $9,000-$36,000 |
| Rights-type, territory and channel splits ready to use | Yes, on day one | Build them yourself | Yes, after configuration |
| Clearance turnaround by rights manager | Yes, page 5 | Build it yourself | Usually an add-on module |
Who Should Use This Template
Content licensing and rights agencies, music and stock-media catalogue owners, film and TV distribution teams, publishing rights desks and syndication managers – anyone who already keeps one row per licence deal in a spreadsheet and wants that register to produce a report. Finance leads use the Revenue Trend page for payout ratios; heads of clearance use page five; commercial directors use the Territory and Rights Portfolio pages for the next acquisition conversation.
It suits a team of one to fifty. Beyond that, or once you need contract storage and approvals rather than reporting, a dedicated rights platform is the right tool.
Real-World Use Cases
Renegotiating a broker agreement. Direct business is $21.6M of the $53.0M book and Broker Network is $7.9M. Filter the Agency slicer to one agency and the same chart tells you whether that mix holds locally, which is the evidence you take into the renegotiation.
Deciding where to spend acquisition budget. Podcast & Audio renews at 49.2% and Stock Video at 31.7%. If both cost the same to acquire, the renewal gap is a 17-point argument for shifting spend, and the Rights Portfolio page shows it in a single chart.
Running a Monday clearance stand-up. On-Time Clearance % by Agency ranks the six agencies; the two at the bottom, 37.9% and 30.4%, set the agenda. The rights-manager chart next to it says whether it is a person problem or a category problem.
Board reporting. Each page prints to one landscape sheet, so the quarterly pack is five pages exported straight from the workbook rather than screenshots pasted into slides.
Advantages of the Content Rights Agencies Dashboard in Excel
- Everything reconciles. Status counts sum to 500, the quarterly values sum to $53.0M, the territory splits sum to $53.0M and the renewal gauge is 181/500. You can check the arithmetic yourself before trusting it with your own data.
- One pivot cache, four slicers. Because every chart is fed from the same cache, filtering is instant and consistent across all five pages.
- No dependency chain. No macros to enable, no add-in to install, no gateway to configure, no licence to renew.
- Named table input. Adding rows to
TblDataextends the table automatically, so the pivot range never needs editing. - Value and volume plotted together on the rights-type, licensee-type and territory charts, which is where a single-measure chart usually misleads.
Opportunities for Improvement
Three honest notes from reviewing the shipped build page by page.
- Avg. Client Rating by Territory is close to flat. Four territories read 4.0 and one reads 3.9, and the value axis repeats labels because it is formatted to one decimal on a very narrow range. A second decimal place, or a chart that plots the rating against deal count, would say more.
- Long category labels crowd two charts. The rights-type axis on page 3 rotates its labels, and the agency axis on page 4 wraps names onto three lines. Widening those charts or shortening the labels in your own data fixes it.
- Some measures are values you type, not values it derives. Client Satisfaction, Infringement Cases, Clearance Days and Renewal Status are all input columns. The dashboard aggregates them faithfully; it does not verify them.
Best Practices
- Keep one row per licence deal. The whole model assumes deal-level granularity – do not pre-aggregate by month or by agency before loading.
- Fill Date, Month, Year and Quarter consistently. The time charts read those columns directly, so a blank Quarter drops a deal out of the quarterly chart while leaving it in the totals.
- Use a short controlled list for Status, Rights Type and Territory. Free text creates a new slicer button per spelling variation. A data-validation list on the Data sheet prevents it – see Microsoft’s guide to applying data validation to cells.
- Refresh with Ctrl + Alt + F5 after every data load, not just F9. F9 recalculates formulas but does not rebuild the pivot cache.
- Reformat currency once, at the column level. The charts inherit the cell format, so changing the Data sheet columns changes every label.
- Keep a clean copy. Save an untouched original before you overwrite the sample rows, so you have a reference layout if a chart loses its source.
Explore Relevant Templates
- Content Rights Agencies Dashboard in Excel – the template this article walks through.
- Content Licensing Dashboard in Excel – the closest neighbour, weighted towards licence revenue rather than agency operations.
- Content Licensing Dashboard in Power BI – the same subject for teams already reporting in Power BI.
- YouTube Channel Analytics Dashboard in Excel – the audience side of the same business.
- NFT Art Marketplaces Dashboard in Excel – digital rights and marketplace sales.
- Film and Television Dashboard in Google Sheets – a Google Sheets option for production-side reporting.
Frequently Asked Questions
Does this template manage contracts or produce royalty statements?
No. It reports on a deal register that you maintain. There is no contract storage, no e-signature, no statement generation and no payment processing.
Does it verify copyright, ownership or chain of title?
No, and it should not be relied on for that. Rights Type, Status and Infringement Cases are columns you type into. The workbook connects to no rights registry, collecting society or performing rights organisation, and nothing in it is legal advice.
Is this the KPI scorecard version or the analytical version?
This is the analytical five-page dashboard – charts, slicers and a source table. The month-picker KPI scorecard line, with traffic lights and a KPI trend page, is a separate template. Similarly named products across the two families are different builds.
Do I need macros or a Power BI licence?
Neither. It is a standard .xlsx using native pivot tables, pivot charts and slicers.
Can I add my own agencies, territories and rights types?
Yes. Type them into the Data sheet and refresh; the slicers and charts pick them up. Long names may need a chart resized.
How many deals can it handle?
The sample is 500 rows. Tens of thousands are fine; past that, refresh times grow on older hardware.
Can I change the currency?
Yes. Apply your currency format to the value columns on the Data sheet and every chart label follows.
About the Author
Built by PK – Microsoft Certified Professional with 15+ years of Excel, Google Sheets, and Power BI experience. Founder of NextGenTemplates, reaching 300K+ subscribers across YouTube channels. Every template is hand-built and tested before release.
Conclusion
The Content Rights Agencies Dashboard in Excel is a reporting layer, not a rights platform – and that is the reason it takes fifteen minutes instead of six weeks. Five pages, fifteen charts, four slicers and one 500-row table cover contract value, margin, royalty payout, renewal behaviour, territory concentration and clearance turnaround, which is most of what a licensing agency reports on monthly. Where the sample build is weak, this article says so: the client-rating chart is flat and several columns are inputs rather than derivations.
Get the template here: Content Rights Agencies Dashboard in Excel. For video walkthroughs of this and other Excel dashboards, subscribe at youtube.com/@PKAnExcelExpert.