A plumbing business lives or dies on a short list of numbers: how many jobs went out, what each one was worth, how many needed a second visit, and how much of the invoice was still there after labour and parts. The Plumbing Business KPI Scorecard in Excel puts 10 of those KPIs across 5 groups – Revenue, Operations, Workforce, Customer and Finance – on one page, with the value, the target, the variance, a red / amber / green traffic light and a twelve-month sparkline for every line. The sample workbook opens on Nov-2025 in MTD vs Target mode and reads 4 Green, 4 Amber and 2 Red out of 10. Every figure is a plain worksheet formula – no macros, no Power Query, no Power Pivot and no add-ins.
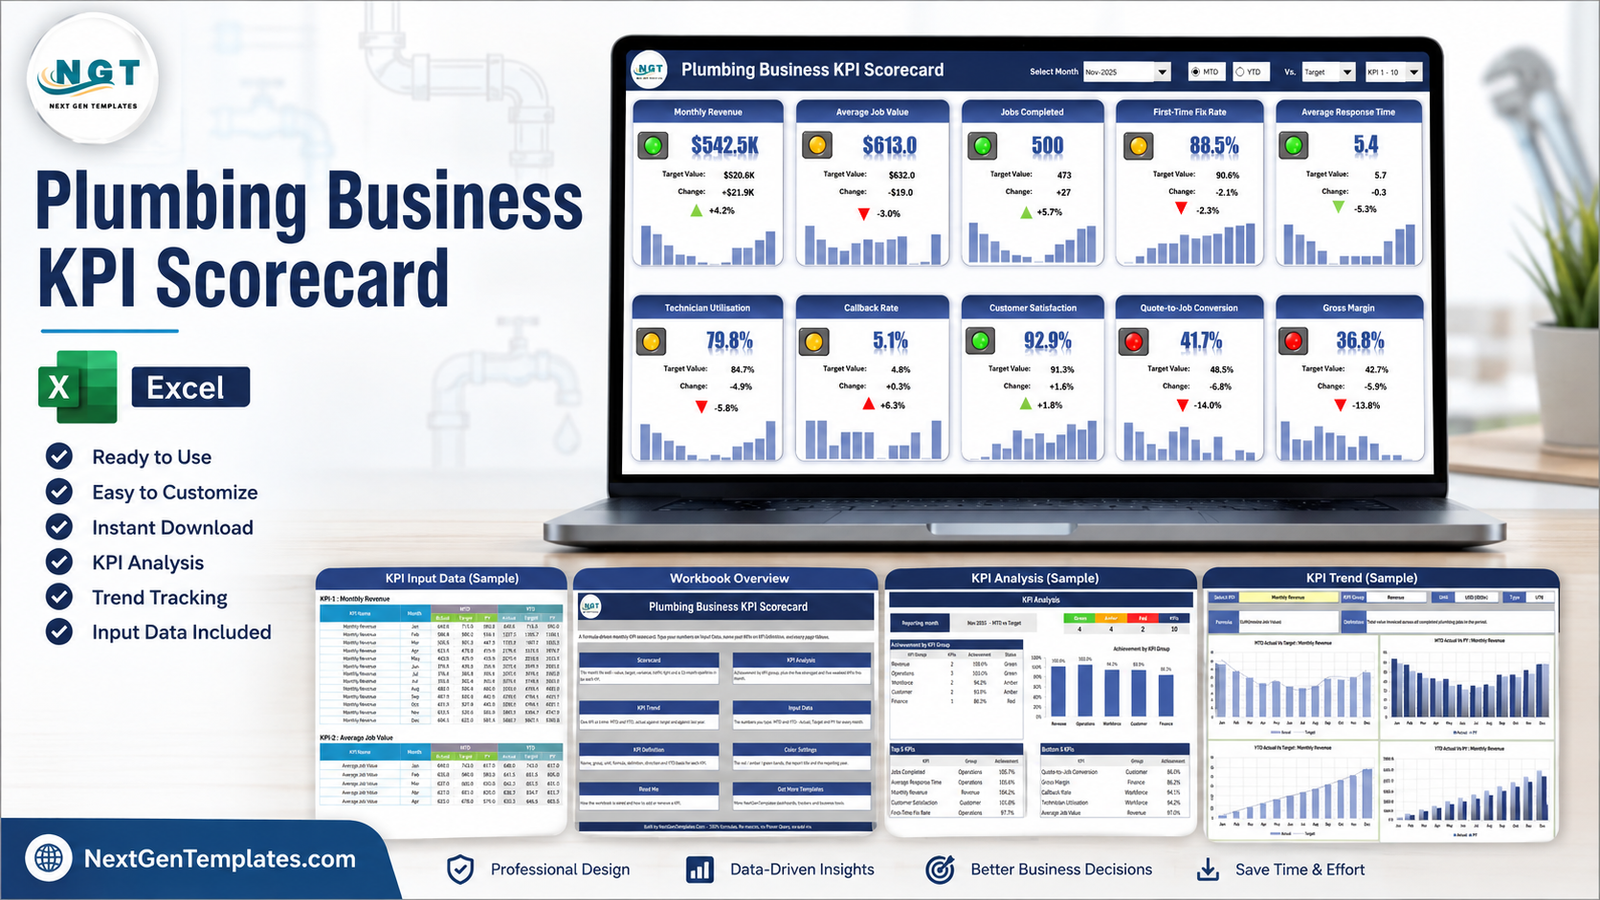
One point of clarity first, because this store sells three things with very similar names. This is the KPI Scorecard line: a fixed KPI list, one month at a time, actual against target or prior year, traffic lights, a trend page and an analysis page. It is not the analytical Excel Dashboard line, which is built on a job-level transaction table with slicers and pivot-driven charts, and it is not the table-style Excel KPI Dashboard either. They answer different questions, and plenty of plumbing firms end up owning one of each.
Key Features of the Plumbing Business KPI Scorecard in Excel
A tile wall, not a table
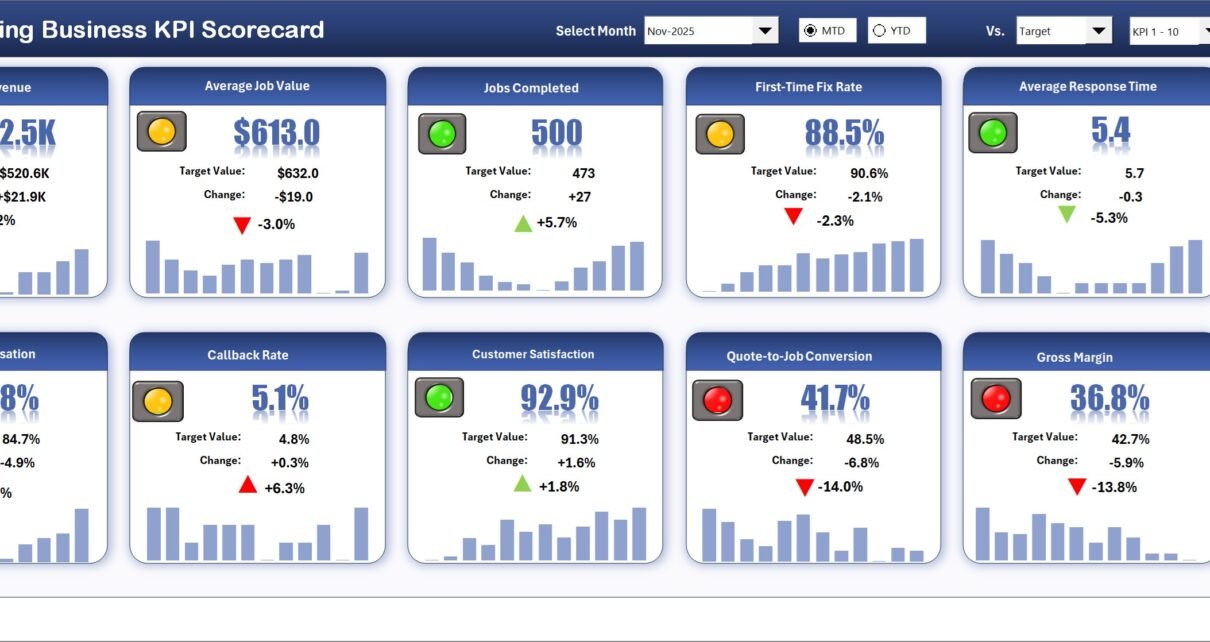
The Scorecard sheet is ten large cards, two rows of five. Each card carries the KPI name, the current value in large type, a red / amber / green traffic light, the target value, the absolute change, the percentage change with a direction arrow, and a twelve-month sparkline underneath. In the sample month, Monthly Revenue reads $542.5K against a $520.6K target (+$21.9K, +4.2%) and shows green, while Gross Margin reads 36.8% against 42.7% (-5.9 points, -13.8%) and shows red. You can see where the month went without opening a second file.
One header row drives the whole page
Four controls sit across the top of the Scorecard. Select Month picks the reporting month and reads Nov-2025 rather than a bare “Nov”, because the reporting year is set once on Color Settings. MTD / YTD switches between the month and the year to date. Vs. compares actual against Target, against the same period last year (PY), or against the Prior Month. A fourth picker switches the wall between KPI 1 – 10 and KPI 11 – 20.
Direction-aware scoring, so response time and callbacks are not punished
Every KPI is tagged UTB (upper the better) or LTB (lower the better) in the KPI Definition sheet. Two of the ten are LTB: Average Response Time and Callback Rate. That is why Average Response Time falling from a 5.7 hour target to 5.4 hours (-5.3%) shows a green down-arrow, while Callback Rate rising from 4.8% to 5.1% (+6.3%) shows a red up-arrow. The traffic light and the arrow both respect the direction.
Traffic lights you can move
The bands are three cells on the Color Settings sheet: green at or above target, amber within 10% of target, red more than 10% off. There is a mirrored set for the LTB KPIs. Change the numbers and every tile, the Green / Amber / Red counter strip and the group statuses on KPI Analysis all follow. A KPI with a blank or zero comparison value reads n/a rather than guessing.
Wired for 20 KPIs, 10 filled in
The sample ships with ten plumbing KPIs and twelve months of realistic numbers, so every formula, light and sparkline is already working when you open it. To add an eleventh, type it on the next free row of KPI Definition, fill the matching numbered block on Input Data, and it flows through every page. A Check column flags duplicate KPI names, because each page looks a KPI up by name.
Dashboard Pages Explanation
Home
A plain navigation page with a linked card for each of the eight other sheets and a one-line description of what it does. The footer states the build rule the whole file follows: 100% formulas, no macros, no Power Query, no add-ins.
Scorecard – the tile wall
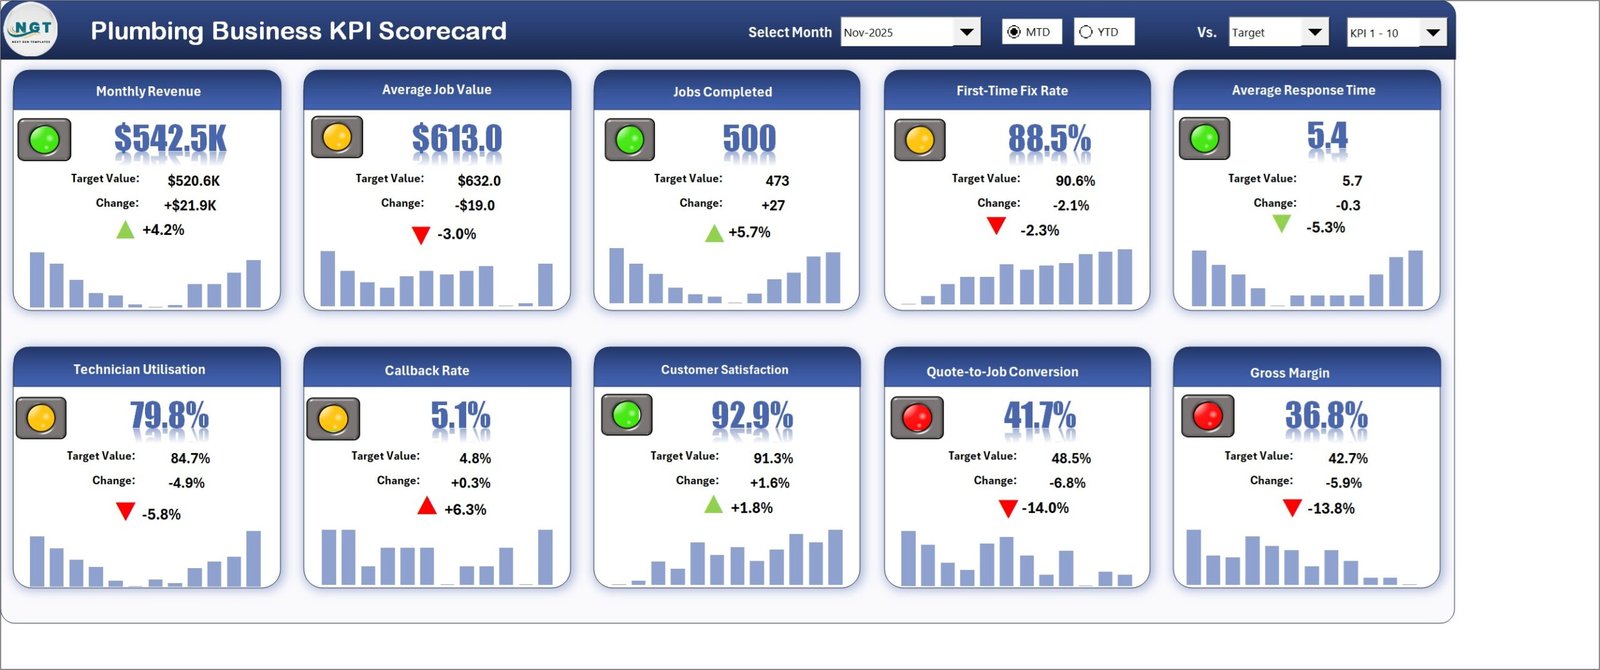
The ten tiles in the sample month, MTD against target: Monthly Revenue $542.5K vs $520.6K (+4.2%, green) · Average Job Value $613.0 vs $632.0 (-3.0%, amber) · Jobs Completed 500 vs 473 (+5.7%, green) · First-Time Fix Rate 88.5% vs 90.6% (-2.3%, amber) · Average Response Time 5.4 hours vs 5.7 (-5.3%, green) · Technician Utilisation 79.8% vs 84.7% (-5.8%, amber) · Callback Rate 5.1% vs 4.8% (+6.3%, amber) · Customer Satisfaction 92.9% vs 91.3% (+1.8%, green) · Quote-to-Job Conversion 41.7% vs 48.5% (-14.0%, red) · Gross Margin 36.8% vs 42.7% (-13.8%, red).
KPI Analysis – the roll-up
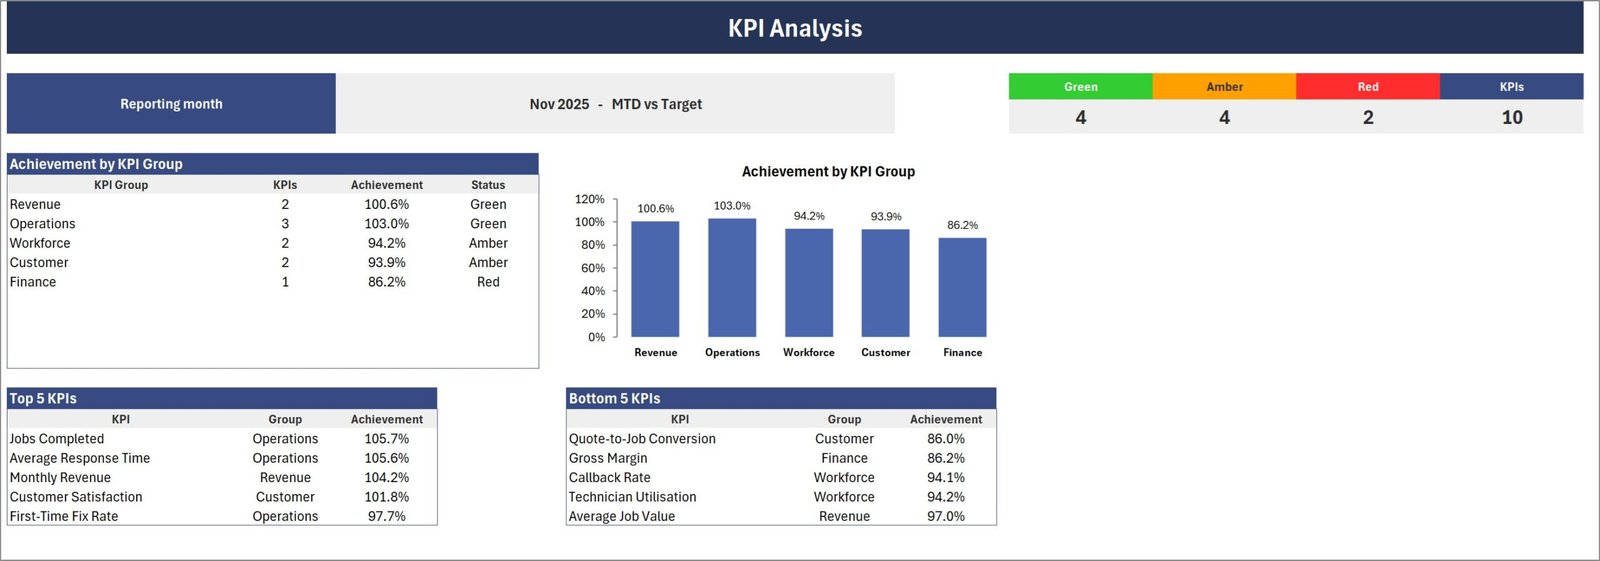
This page ranks the month for you. A counter strip reads Green 4, Amber 4, Red 2, KPIs 10. Achievement by KPI Group lists each group with its KPI count, achievement and status – Revenue 100.6% green (2 KPIs), Operations 103.0% green (3), Workforce 94.2% amber (2), Customer 93.9% amber (2), Finance 86.2% red (1) – with a matching column chart beside it. Then two tables do the arguing for you: Top 5 KPIs (Jobs Completed 105.7%, Average Response Time 105.6%, Monthly Revenue 104.2%, Customer Satisfaction 101.8%, First-Time Fix Rate 97.7%) and Bottom 5 KPIs (Quote-to-Job Conversion 86.0%, Gross Margin 86.2%, Callback Rate 94.1%, Technician Utilisation 94.2%, Average Job Value 97.0%).
KPI Trend – one KPI, twelve months
Pick a KPI from the dropdown and the page fills in its group, unit, direction type, formula text and plain-English definition, then draws four charts: MTD Actual Vs Target, MTD Actual Vs PY, YTD Actual Vs Target and YTD Actual Vs PY. With Monthly Revenue selected it shows group Revenue, unit USD (000s), type UTB, formula SUM(Invoiced Job Value) and the definition “Total value invoiced across all completed plumbing jobs in the period.”
Input Data – Actual, Target and PY
One numbered block per KPI, twelve rows each, with six columns: MTD Actual, Target and PY and YTD Actual, Target and PY. This is the only sheet with monthly numbers on it. The Monthly Revenue block, for example, runs from 640.6 in January to 604.1 in December, with the YTD actual closing at 5,887.1.
KPI Definition – the dictionary
Ten rows, one per KPI, with #, KPI Group, KPI Name, Unit, Formula, Definition, Type, YTD Basis and Check. Units in the sample are USD (000s), USD, Count, % and Hours. YTD Basis is Sum for Monthly Revenue and Jobs Completed and Average for the other eight, which is exactly the distinction that makes a hand-built scorecard go wrong.
Color Settings, Read Me and Get More Templates
Color Settings holds the RAG bands for both directions, the report title and the reporting year. Read Me explains what you type, how UTB and LTB work, how the traffic lights are calculated, how to add a KPI and why KPI names must be unique. Get More Templates is a one-page index of the other NextGenTemplates lines.
Plumbing Business KPI Scorecard in Excel vs. Google Sheets vs. Paid Field-Service Software – Feature Comparison
| This Excel KPI scorecard | Build it in Google Sheets | Paid field-service software (ServiceTitan / Jobber / Simpro class) | |
|---|---|---|---|
| Cost | 9.99 on sale (15.99 regular), one payment | Free tool, your build time | Typically 50-400+ per month, often per technician |
| Platform | Excel 2016 and later, Windows and Mac | Browser | Vendor cloud plus a mobile app |
| Setup time | Minutes – paste twelve months in, pick a month | Days to reproduce the logic | Weeks, usually with onboarding |
| What it is for | The monthly KPI review | Whatever you build | Running the whole operation |
| Real-time team collaboration | OneDrive / SharePoint co-authoring | Yes, native | Yes |
| Customizable fields | Every cell – nothing locked, hidden or password-protected | Yes | Within the vendor’s data model |
| Direction-aware scoring (UTB / LTB) | Built in, per KPI | You write it | Usually configurable |
| Job scheduling and dispatch | No | No, unless you build it | Yes |
| Invoicing and payments | No | No | Yes |
| Live feed from your job or accounting system | No – monthly figures are typed or pasted | No, unless you build it | Yes |
| Year-1 cost for a 5-technician firm | 9.99 total | 0 plus build time | 3,000-24,000+ |
Who Should Use This Template
Owners and operations managers of residential service plumbers, commercial contracting firms and mixed books who already produce the monthly numbers somewhere and want one page a management meeting can read. Service managers who report first-time fix, response time and callbacks. Office managers who pull revenue, job counts and margin out of an accounting package each month and need somewhere to put them. Franchise and multi-branch operators who want the same ten KPIs reported the same way by every branch.
It is a poor fit if you want live data. There is no connector to a job-management or accounting system and no job-level detail – no work-order list, no technician roster, no parts ledger. You enter monthly KPI values, and that is deliberate: it is what keeps the file portable, readable and independent of anyone’s software.
Real-World Use Cases
The monthly management meeting. A twelve-van residential firm replaces a stack of printouts with one sheet. In the sample month the room can see in seconds that revenue and job volume both beat target while Quote-to-Job Conversion (86.0% of target) and Gross Margin (86.2%) are the only two reds – so the conversation is about quoting and pricing, not about who forgot to send the report.
Service quality reviews. A commercial contractor tracks First-Time Fix Rate and Callback Rate as a pair. First-time fix at 88.5% against a 90.6% target and callbacks at 5.1% against a 4.8% target tell a consistent story that either number alone would hide.
Branch and franchise comparison. Each branch keeps its own copy with the same ten KPI definitions, and head office compares achievement percentages rather than raw revenue, so a small branch and a large one are judged on the same scale.
Board and lender packs. The KPI Trend page gives a twelve-month MTD and YTD shape for a single KPI against both target and last year – the view an investor or a bank asks for and a single-month figure cannot answer.
Advantages of the Plumbing Business KPI Scorecard in Excel
- It just opens. 100% worksheet formulas, conditional formatting, camera pictures and native sparklines. No macros to enable, no Power Query refresh, no data model, no add-ins, no security warning.
- Ten minutes a month. Once the KPI list is yours, the recurring work is typing six numbers per KPI on one sheet.
- Nothing is hidden. No locked sheets, no passwords, no protected ranges. Every formula is readable and editable, which matters when your definition of “job completed” is not ours.
- MTD and YTD are both first-class. Most home-made scorecards do the month well and fudge the year to date. Here you supply both, and the YTD Basis column records whether a KPI rolls up as a sum or an average.
- The comparison is a choice. Target, prior year or prior month, switched from the header without touching a formula.
- Sample data included. Twelve months across all ten KPIs, so you can see how it behaves before you replace a single number.
Opportunities for Improvement
YTD is typed, not calculated. The workbook does not derive year-to-date from the monthly figures, because the right roll-up differs by KPI – a sum for revenue and job counts, an average for rates, and something of your own for anything more involved. That is a deliberate design decision, but it does mean you supply twelve extra numbers per KPI.
Ten tiles at a time. The file has room for 20 KPIs, but the Scorecard shows ten per screen, so a full twenty-KPI review means switching the KPI-set picker once.
Twelve months, one year. The Input Data sheet holds a single reporting year. Multi-year trending means a second copy or extending the sheet yourself.
Currency is a format, not a setting. The sample is in USD. Changing to GBP, EUR, AUD or CAD is a cell-format change – the formulas do not care – but there is no currency dropdown.
No live connection. Figures are typed or pasted. If you want an automatic feed from a job-management system, this is not that product.
Best Practices
- Write the definitions before the numbers. Fill in the Formula and Definition columns on KPI Definition first and agree them with whoever produces the data. Most scorecard arguments turn out to be definition arguments.
- Set the direction honestly. Mark cost, time and defect KPIs as LTB. Getting this wrong makes an improving business look like a failing one.
- Move the RAG bands to suit the KPI mix. A 10% band is generous for a satisfaction score and tight for a conversion rate. The bands are yours.
- Keep the KPI list short. Ten is a management meeting. Twenty is a data-entry job. Add the eleventh only when someone will act on it.
- Fill targets for all twelve months up front. A traffic light needs a comparison value; a blank one reads n/a.
- Give every KPI a named owner. The workbook does not enforce it, but a scorecard with no owner per line stops being reviewed by about month four.
Explore Relevant Templates
- Plumbing Contractor Dashboard in Excel – the analytical line for the same trade: a job-level table with slicers and pivot-driven charts. A different product answering a different question, and the natural companion to this scorecard.
- Plumbing Contractor Dashboard in Power BI – the same analytical idea for a team that already runs Power BI.
- Plumbing Contractor Dashboard in Google Sheets – browser-based, for firms that live in Google Workspace.
- HVAC Service Dashboard in Excel – the neighbouring trade, for firms that run plumbing and heating side by side.
- Plumbing Maintenance Checklist Template in Excel – a day-to-day job aid rather than a monthly report.
Frequently Asked Questions
Does this workbook price jobs, invoice customers or do my accounts?
No. It is a reporting and scorecard workbook only. It does not price or quote jobs, does not calculate labour or parts costs for you, and it is not accounting, invoicing, payroll or tax software. Revenue, margin and job values are monthly figures you type in from wherever you already produce them.
Does it schedule or dispatch engineers?
No. There is no diary, no job board, no technician roster and no dispatch function. It reports on a month that has already happened.
Does it have anything to do with licensing, gas or water regulations, certification schemes or insurance?
No. The workbook makes no claim about trade licensing or registration, gas or water safety regulation, certification or competent-person schemes, building regulations, or insurance cover. If you add a safety- or compliance-flavoured KPI of your own, the number is one you type in – the workbook neither measures nor verifies it, and it is not evidence of compliance with anything.
How many KPIs can it hold, and how many are filled in?
It is wired for 20 KPIs, and the sample has 10 filled in across five groups. The Scorecard shows ten at a time; the KPI-set picker in the header switches between KPI 1 – 10 and KPI 11 – 20.
Do I need macros, Power Query or Power Pivot?
No. It is a plain .xlsx file built from worksheet formulas, conditional formatting, camera pictures and native sparklines. Nothing to enable, nothing to trust, and it opens on any Excel from 2016 onward on Windows or Mac.
Can I change the KPI names, groups, units and targets?
Yes – all of them. The ten sample KPIs are examples, not a fixed list. Rename them on KPI Definition, set your own groups, units, formulas, direction and YTD basis, then fill the matching blocks on Input Data. Nothing is locked or password-protected.
Does it connect to my job-management or accounting system?
No. There is no connector and no live feed. Monthly MTD and YTD figures for Actual, Target and PY are typed or pasted onto the Input Data sheet.
Is this the same as the Plumbing Contractor Dashboard in Excel?
No – they are different templates. This is the month-picker scorecard: a fixed KPI list, one month at a time, traffic lights, a trend page and an analysis page. The dashboard line is analytical: a job-level transaction table with slicers and pivot-driven charts. Plenty of firms buy both.
What currency is it in?
The sample is in USD, with Monthly Revenue in USD (000s) and Average Job Value in whole USD. Currency is a cell format, so switching to GBP, EUR, AUD or CAD takes seconds and changes no formula.
What is in the download?
A ZIP containing the .xlsx workbook with all nine sheets and twelve months of sample data, plus the Excel KPI Scorecard user manual PDF. Instant download after purchase, lifetime access to the file you buy.
About the Author
Built by PK – Microsoft Certified Professional with 15+ years of Excel, Google Sheets, and Power BI experience. Founder of NextGenTemplates, reaching 300K+ subscribers across YouTube channels. Every template is hand-built and tested before release.
Conclusion
Most plumbing firms are not short of numbers – they are short of one page everyone agrees on. The Plumbing Business KPI Scorecard in Excel is that page: ten KPIs across five groups, MTD and YTD, target, prior year or prior month, direction-aware traffic lights you can move, a twelve-month trend view, and a group roll-up that names the best and worst five for you. All of it from plain worksheet formulas you can open, read and change.
Get the Plumbing Business KPI Scorecard in Excel for 9.99 (regular 15.99) – instant download, twelve months of sample data included, lifetime access to the file you buy. Want a different KPI set? Email info@NextGenTemplates.Com and we will build the scorecard around your KPIs.
For Excel walkthroughs and dashboard tutorials, subscribe at youtube.com/@PKAnExcelExpert.