The Succession Planning KPI Dashboard in Power BI is a ready-to-use 3-page dashboard that tracks every succession KPI you care about — from % of critical roles with named successors to bench strength ratio and time-to-readiness — with MTD vs Target, YTD vs Target, and Current Year vs Previous Year comparisons baked in. The data source is a simple Excel file with 3 input sheets, so you only fill numbers and the entire dashboard updates on a single Refresh click.
🌍 Trusted by 8,400+ teams across 40+ countries to replace paid HRIS modules with one-time-purchase Power BI templates.
✅ Instant download · One-time payment · No subscription · Lifetime access
Introduction
Succession planning is one of the few HR processes where the cost of a mistake is measured in years of business disruption, not weeks. Yet most HR teams still track succession readiness in static slide decks updated quarterly — the data is stale by the time the executive team sees it. The Succession Planning KPI Dashboard in Power BI closes that gap. It gives talent leaders a single Power BI Desktop file with 3 connected pages, an editable Excel data source, and built-in MTD/YTD/PY logic that turns succession planning from a slide-deck exercise into a live monthly review.
This dashboard is purpose-built for HR teams who already use Power BI for headcount or attrition reporting and want a clean, ready-made succession KPI layer they can drop in without rebuilding visuals from scratch. It also works as a stand-alone tool for HR consultants delivering succession audits to mid-market clients.
Key Features of Succession Planning KPI Dashboard in Power BI
This dashboard tracks any succession KPI you define — typical metrics include % critical roles with successor, bench strength ratio, internal-fill rate, time-to-readiness, high-potential retention rate, and backfill risk score. Three definitive design choices make it different from a generic Power BI HR template:
1. Dual MTD and YTD vs Target views in one row. Each KPI shows its month-to-date and year-to-date numbers side by side with separate status icons, so a CHRO can see in one glance whether the team is on track for the month and on track for the year.
2. Built-in Current Year vs Previous Year comparison. The dashboard pulls PY MTD and PY YTD values for every KPI and calculates CY vs PY percentages — you spot succession risk trends across 12-24 months without rebuilding any visuals.
3. LTB and UTB type logic. Some succession KPIs are Lower-the-Better (time to backfill a critical role) and some are Upper-the-Better (% of critical roles with named successor). The Type column in the KPI Definition sheet drives the icon color logic so red always means “missed target” regardless of KPI direction.
Dashboard Pages Explanation
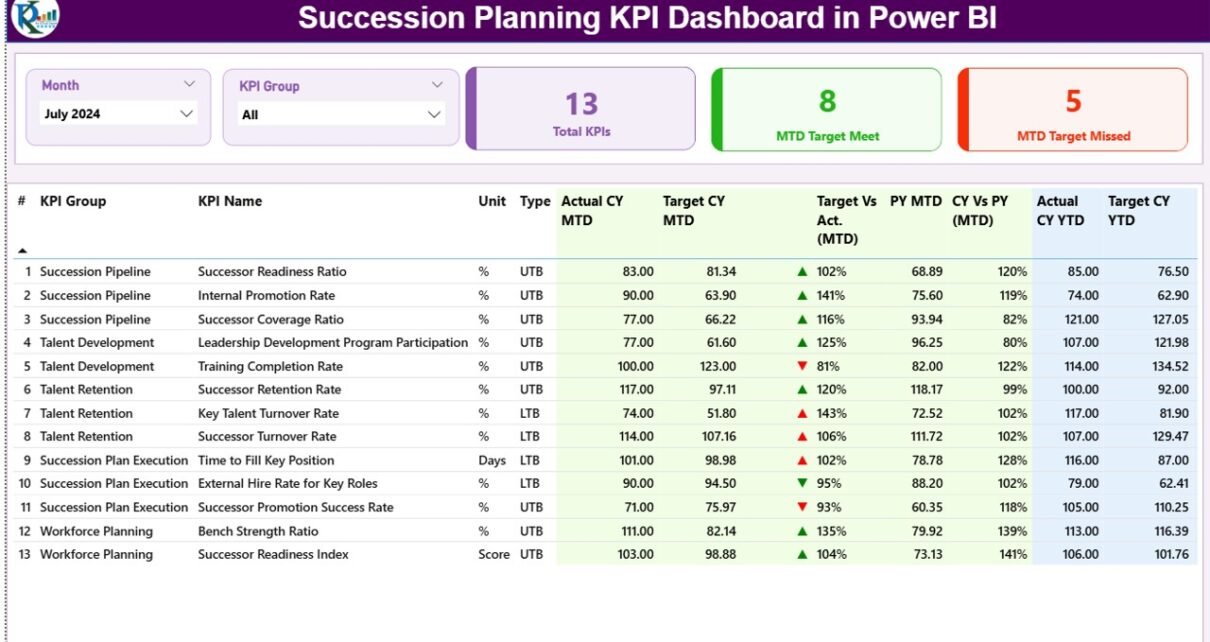
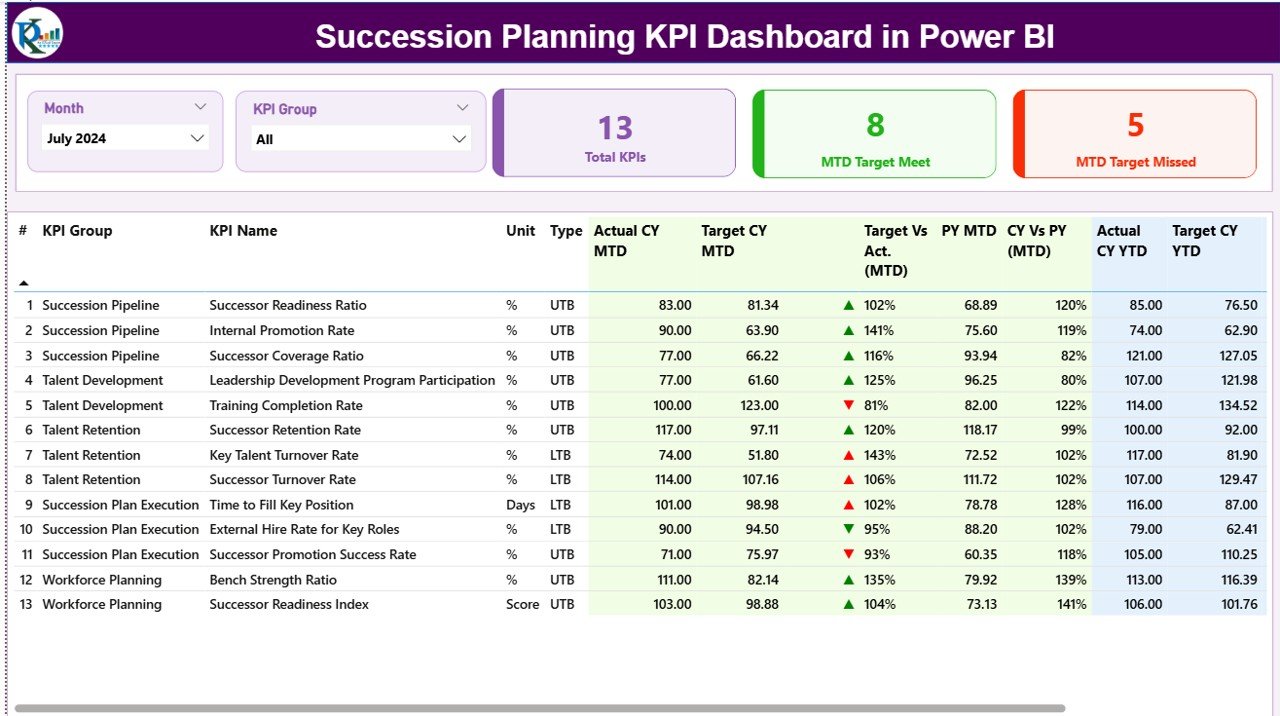
1) Summary Page
The main page of the dashboard. Month and KPI Group slicers sit at the top, followed by 3 KPI cards: Total KPIs count, MTD Target Met count, and MTD Target Missed count. Below the cards is the detailed table showing for every KPI: KPI Number, KPI Group, KPI Name, Unit, Type (LTB or UTB), Actual CY MTD, Target CY MTD, MTD Icon (▲ green / ▼ red), Target vs Actual (MTD) %, PY MTD, CY vs PY (MTD) %, Actual CY YTD, Target CY YTD, YTD Icon, Target vs Actual (YTD) %, PY YTD, and CY vs PY (YTD) %.
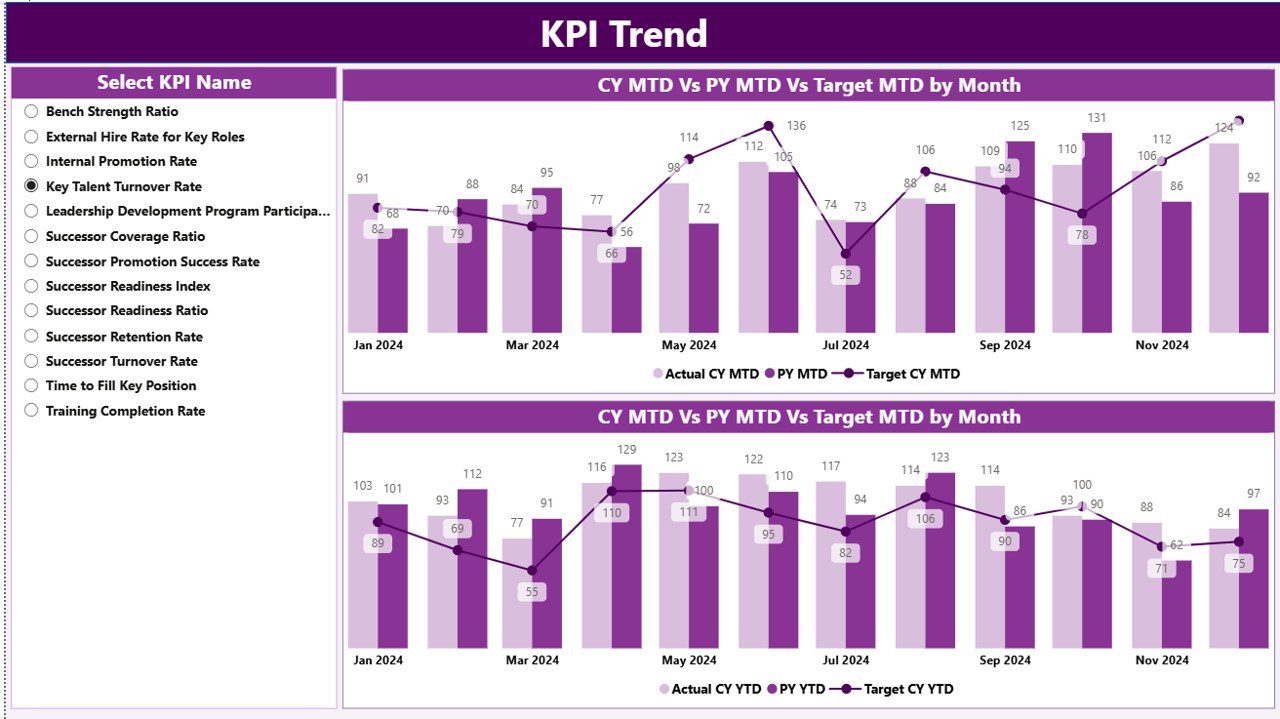
2) KPI Trend Page
Two combo charts show the Actual numbers of Current Year, Previous Year, and Targets for both MTD and YTD. A KPI Name slicer on the left lets you select any single KPI to view its full trend across the year.
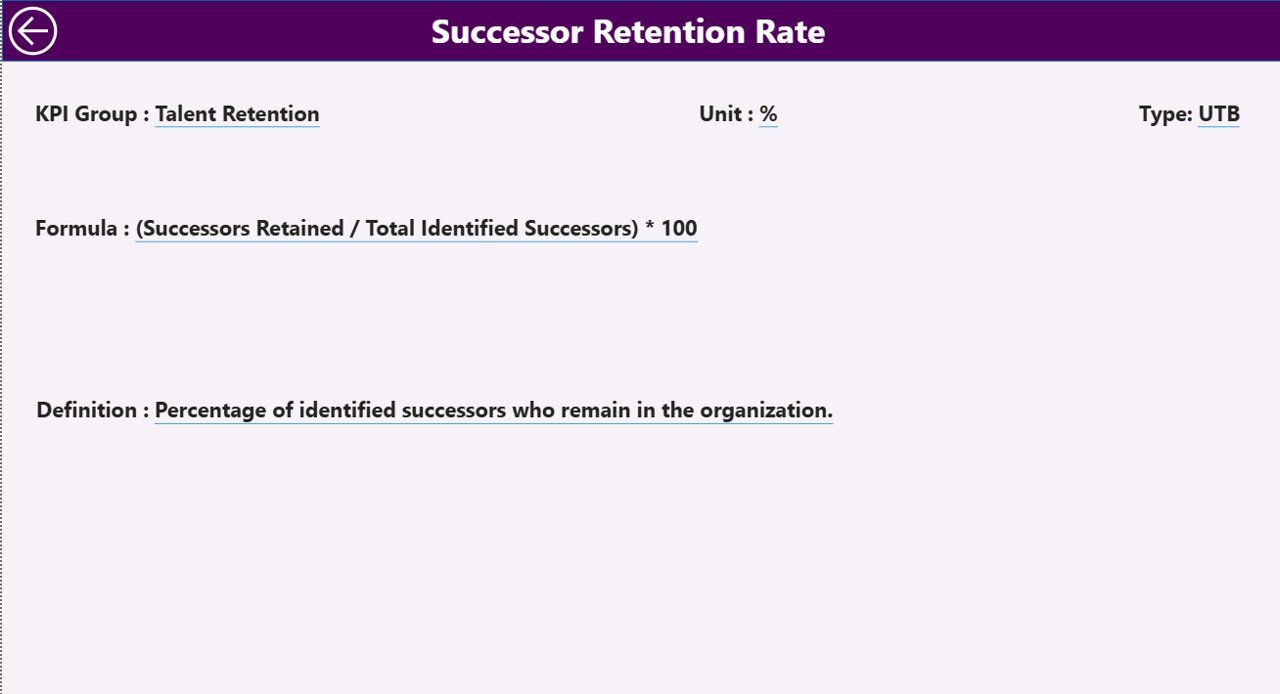
3) KPI Definition Page
A hidden drill-through page. From the Summary page, right-click any KPI to drill through and see its Formula and KPI Definition. Click the back button on the top-left corner to return to the Summary page.
Excel Data Source
The dashboard reads from an Excel file with 3 input sheets:
Input_Actual sheet: Fill the Actual number of KPI Name, Month (first date of month), MTD number, and YTD number.
Input_Target sheet: Fill the Target number of KPI Name, Month, MTD target, and YTD target.
KPI Definition sheet: Fill KPI Number, KPI Group, KPI Name, Unit, Formula, Definition, and Type (LTB or UTB).
To learn more about Power BI data refresh patterns, see the official Microsoft Learn guide to data refresh in Power BI.
Succession Planning KPI Dashboard in Power BI vs. Tableau / Qlik vs. Workday Talent — Feature Comparison
| Feature | Succession Planning KPI Dashboard in Power BI | Tableau / Qlik Build | Workday Talent / SAP SuccessFactors |
|---|---|---|---|
| Cost | $11.99 one-time | $70 / user / month + build cost | $8-25 / user / month, annual contract |
| Platform | Power BI Desktop (free) | Tableau / Qlik Sense | Web SaaS |
| Setup time | Under 10 minutes | 2-6 weeks | 3-6 month implementation |
| MTD + YTD vs Target view | ✅ Built-in | Custom-build needed | ✅ Built-in |
| CY vs PY comparison | ✅ Built-in | Custom-build needed | ✅ Built-in |
| Customizable KPIs & formulas | ✅ Edit Excel + .pbix | ✅ Full control | Limited to vendor schema |
| Drill-through to KPI definitions | ✅ Hidden page | Custom-build needed | Vendor docs only |
| Year-1 cost at 5 users | $11.99 total | $4,200 + dev | $480-1,500 + setup |
| Data ownership | 100% on your machine | Cloud or local | Vendor cloud only |
For HR teams that want enterprise-grade succession reporting without paying for an HRIS module, the Succession Planning KPI Dashboard in Power BI sits in the sweet spot.
Who Should Use This Template
Perfect for:
- HR Business Partners and Talent Managers at 50-2,000 person companies tracking succession readiness for critical roles
- Chief HR Officers and HR Directors who present succession scorecards to the executive team monthly or quarterly
- HR Analysts already using Power BI for HR reporting who want a ready-made succession KPI layer
- HR consultants and boutique firms delivering succession planning audits as client deliverables
Not a fit if:
- You’re a large enterprise needing SOC 2-compliant SaaS with role-based access controls — use Workday or SuccessFactors instead
- Your team has no Power BI Desktop install and is unwilling to install it
- You need real-time API integration with your HRIS (this template is refresh-on-data-update, not live)
Real-World Use Cases
Priya leads talent management at a 350-person fintech in Bengaluru. She uses the Succession Planning KPI Dashboard in Power BI to track % of critical roles with named successors, internal-fill rate, and time-to-readiness for high-potential employees. Each quarter she presents the Summary page directly in her board update, switches the KPI Group slicer to walk through Engineering, Risk, and Operations succession separately, and drills through to KPI definitions when a board member asks how a metric is calculated. Her team avoided a $24/user/month spend on a separate talent module.
Marcus is HR Director at a US manufacturing group with 4 plants. Each plant manager has different critical roles to backfill — plant operators, quality engineers, shift supervisors. Marcus loaded the Excel KPI Definition sheet with each plant’s critical-role list, set Type to LTB or UTB per KPI, and now uses the Month and KPI Group slicers in his monthly leadership review to compare succession readiness across plants on a single screen.
Anjali runs a 6-person HR consulting boutique. She delivers the dashboard to mid-market clients as part of a succession audit engagement. She configures the Excel input sheets to each client’s KPI list, runs the analysis, then hands over the .pbix file as a deliverable the client can keep and update themselves — turning a one-time engagement into a recurring referral source.
Advantages of Succession Planning KPI Dashboard in Power BI
💰 Cost efficiency. A 50-person company using Workday or SuccessFactors for succession reporting pays $4,800-15,000 per year. This dashboard is $11.99 one-time — a 99%+ cost reduction for teams whose only need is succession KPI tracking.
🔄 Refresh-driven simplicity. No DAX writing, no data modeling. Update the Excel input sheets, click Refresh, every visual updates. HR teams without a BI analyst can own this dashboard end-to-end.
📊 Board-ready output. The Summary page is designed for executive presentations — KPI cards on top, detailed table below, status icons that read at 6 feet across a meeting room.
🔐 Data ownership. Your succession data never leaves your machine. No vendor cloud, no per-seat fees, no data residency questions for your security team.
Opportunities for Improvement
To be honest about the trade-offs:
• The dashboard is refresh-on-update, not live. If you need succession KPIs to update the second a new hire is recorded in your HRIS, you’ll want a direct SQL or API connection — a customization any Power BI developer can add.
• The Excel data source assumes you already have clean KPI numbers. If your succession data lives across HRIS exports, talent review forms, and individual development plans, you’ll spend most of your setup time consolidating into the Input_Actual sheet — not on the dashboard itself.
• The hidden drill-through page covers Formula and Definition only. If you want named-successor lists or individual-level data, you’ll need to extend the model with a second drill-through page.
Best Practices
🔹 Pick 8-15 KPIs maximum. Succession dashboards lose executive attention past ~15 metrics. Start with the 8 KPIs that actually drive board conversation.
🔹 Standardize “critical role” definition before you populate the Excel sheets. Without a written critical-role list, every plant or function will count critical roles differently.
🔹 Refresh on the same day every month. Set a calendar reminder for the 3rd business day so the dashboard always reflects the prior month’s actuals.
🔹 Use the KPI Group field to organize by talent category (Pipeline, Readiness, Retention) or by business unit — not both. Pick one taxonomy and stick to it.
Explore Relevant Templates
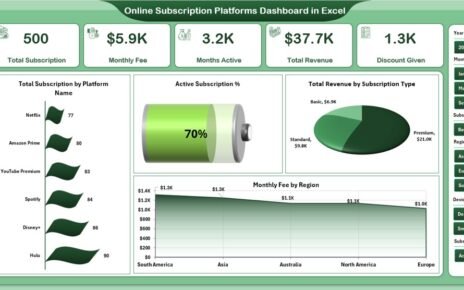
Also available as: Succession Planning KPI Dashboard in Excel · Succession Planning KPI Dashboard in Google Sheets
Related HR Power BI dashboards: Employee Retention Dashboard in Power BI · Staffing Agency Dashboard in Power BI
Browse more Power BI Dashboard Templates and HR & Payroll Templates.
💎 Save 18% — Get all 10 HR templates in the HR & Workforce Analytics Bundle →
Frequently Asked Questions
What KPIs does the Succession Planning KPI Dashboard in Power BI track?
The Succession Planning KPI Dashboard in Power BI tracks any succession KPI you define in the Excel KPI Definition sheet — typical metrics include % critical roles with successor, bench strength ratio, internal-fill rate, time-to-readiness, high-potential retention rate, and backfill risk score. The dashboard adapts to whatever KPIs you configure.
Do I need a Power BI Pro subscription to use this dashboard?
No. The Succession Planning KPI Dashboard in Power BI runs on Power BI Desktop, which is 100% free from Microsoft. You only need a Power BI Pro license if you plan to publish the dashboard to the Power BI Service for online sharing — local use requires no subscription.
How long does setup take?
Setup takes under 10 minutes. Open the included Excel file, fill the 3 sheets (Input_Actual, Input_Target, KPI Definition), then open the .pbix file and click Refresh. The Summary page, KPI Trend page, and drill-through definitions all update automatically with your numbers.
How does this compare to Workday Talent or SAP SuccessFactors?
Workday and SuccessFactors are full HRIS platforms costing $8-25 per user per month with 3-6 month implementations. The Succession Planning KPI Dashboard in Power BI is an $11.99 one-time download focused only on succession reporting — ideal when you already have HR data and just need a clean KPI dashboard layer.
Can I add or remove KPIs from the dashboard?
Yes. Add or remove rows in the Excel KPI Definition sheet, update Input_Actual and Input_Target accordingly, and refresh the .pbix file. The Summary table, slicers, and Trend chart automatically pick up the new KPI list — no DAX rewrites needed.
Does the dashboard handle Lower-the-Better and Upper-the-Better KPIs differently?
Yes. The Type column in the KPI Definition sheet accepts LTB or UTB. The dashboard’s MTD and YTD status icons (▲ green / ▼ red) flip color logic automatically so red always means “missed target” regardless of KPI direction — useful for KPIs like “time to backfill” where lower is better.
About the Author
Built by PK — Microsoft Certified Professional with 15+ years of Excel, Google Sheets, and Power BI experience. Founder of NextGenTemplates, reaching 300K+ subscribers across YouTube channels. Every template is hand-built and tested before release.
Conclusion
Succession planning shouldn’t be a slide deck refreshed once a quarter. The Succession Planning KPI Dashboard in Power BI turns it into a monthly review with the same MTD/YTD/PY discipline you already apply to revenue or operational KPIs — and at $11.99 one-time, it costs less than a single hour of HR analyst time.
👉 Click here to Purchase Succession Planning KPI Dashboard in Power BI
✅ Instant download · One-time payment · No subscription
For more Power BI tutorials and dashboard walkthroughs, visit Youtube.com/@PK-AnExcelExpert.
📅 Last updated: April 2026