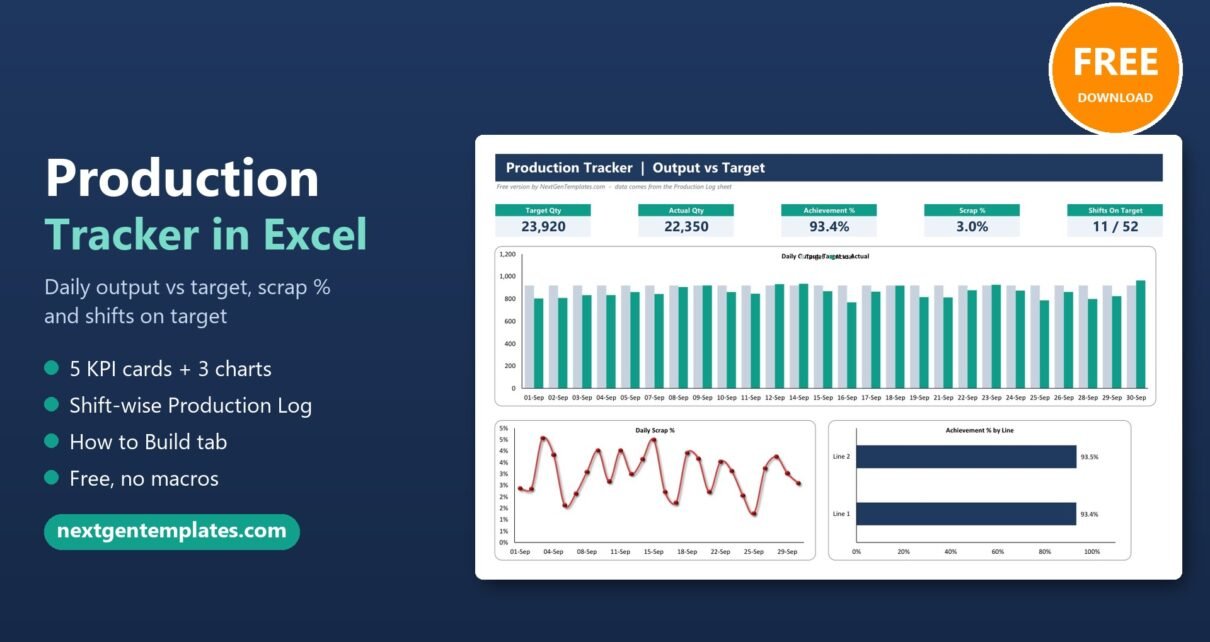
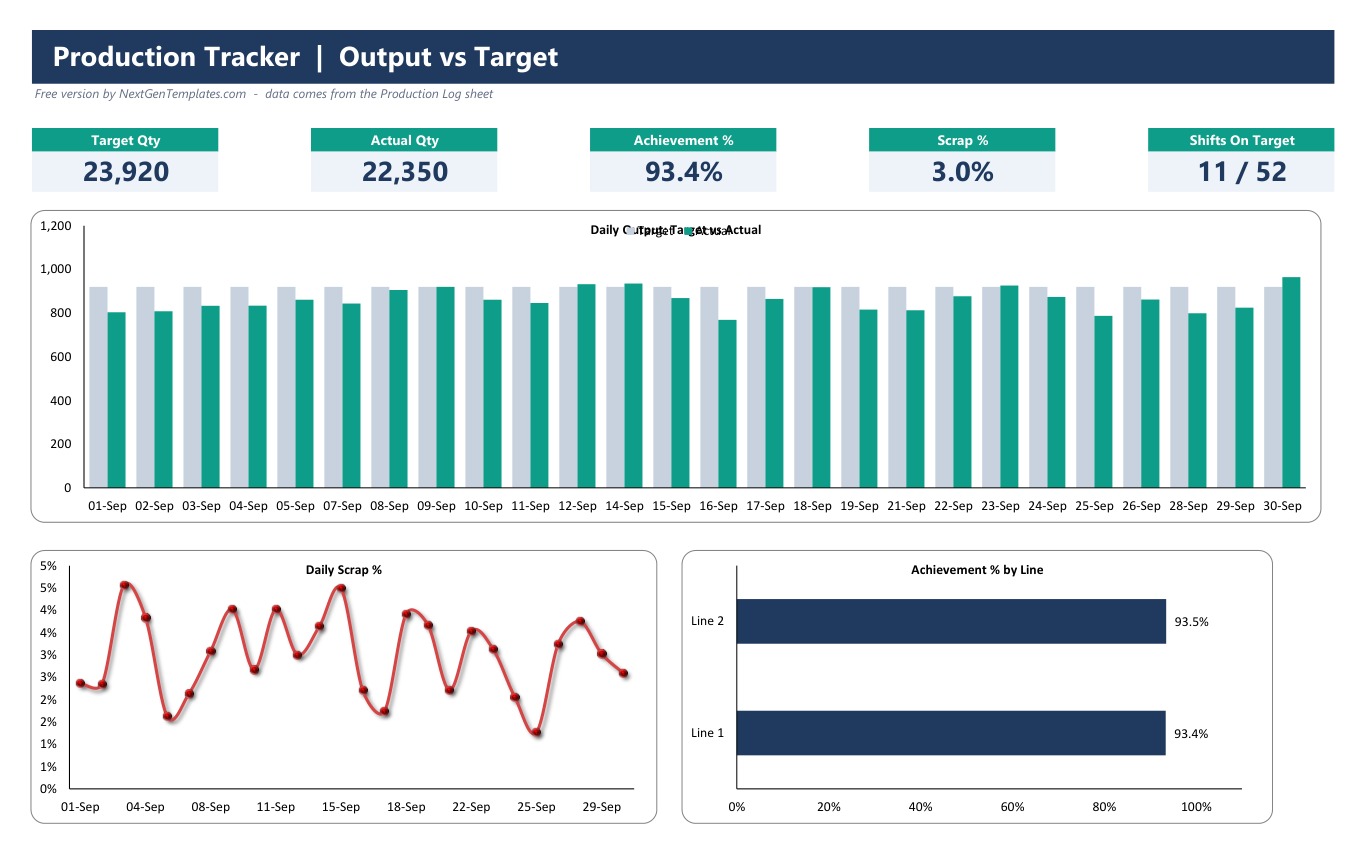
This tutorial shows you how to build a production tracker Excel workbook from a blank file in 32 steps: a shift-wise Production Log, 5 KPI cards (Target Qty, Actual Qty, Achievement %, Scrap % and Shifts On Target) and 3 charts that update on their own. The finished file is a free download, and with its 52 sample shifts it reports 23,920 target units, 22,350 actual units, 93.4% achievement and 3.0% scrap.
Most small plants still write their daily production report on paper or in a sheet with no formulas. That makes it hard to see which line missed target, and by how much. A simple production tracker in Excel fixes that with nothing more than SUM, SUMIFS, COUNTIF and IF. No macros and no add-ins are needed.
🎥 Watch the Video Tutorial
📥 Want the finished file? Download the free Production Tracker in Excel and follow along with the How to Build sheet inside it.
⬇️ Download the Free Practice File
Free Production Tracker in Excel · .zip · no macros
What the Free Production Tracker Excel Template Includes
The workbook has four sheets. Each one has a single job.
- Dashboard: 5 KPI cards and 3 charts: Daily Output: Target vs Actual, Daily Scrap % and Achievement % by Line.
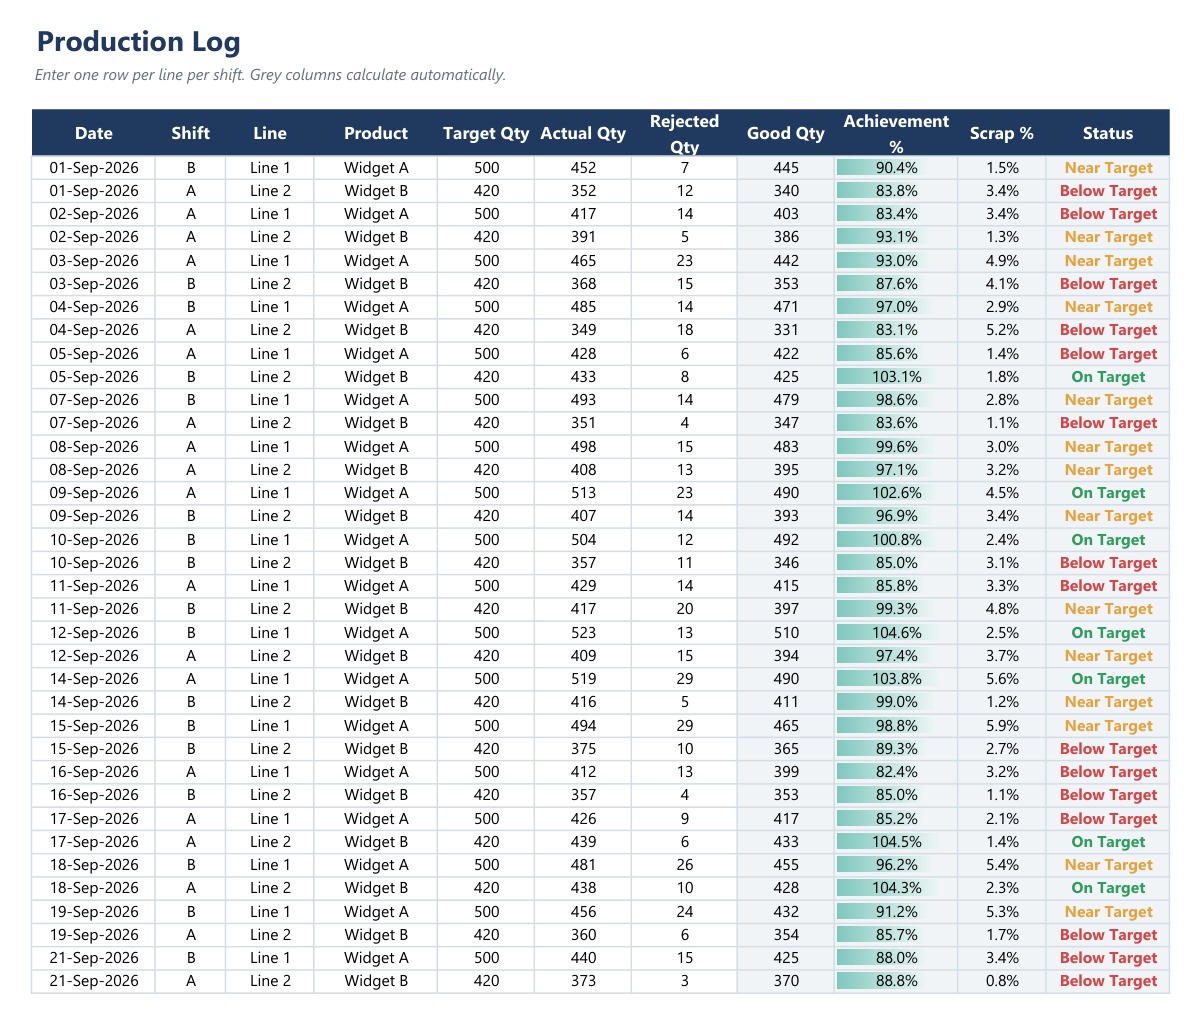
- Production Log: the production tracking spreadsheet you type into, one row per line per shift. Formulas are filled down to row 116.
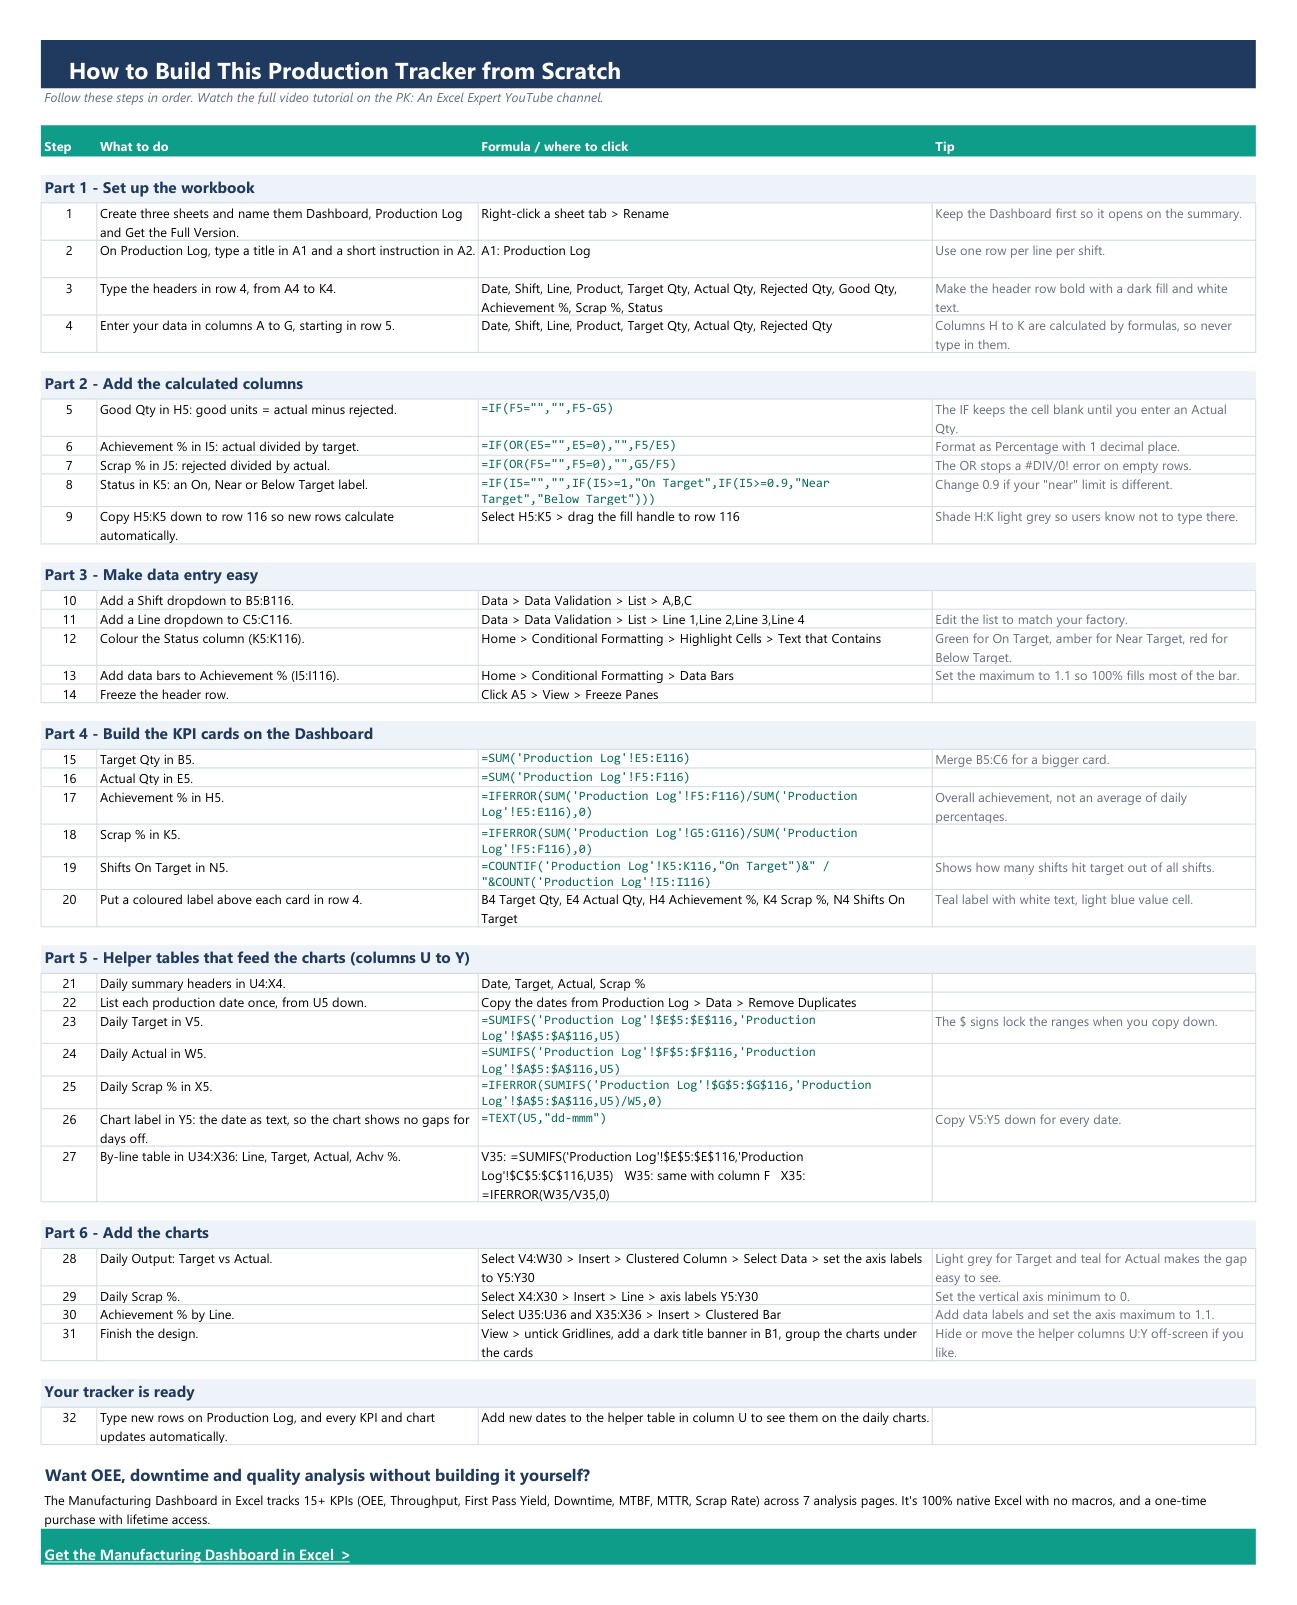
- How to Build: all 32 steps in six parts, with the exact formula or menu path for each step.
- Get the Full Version: what the paid Manufacturing Dashboard in Excel adds.
The sample data covers 1 to 30 September 2026: 52 shifts on two lines (Line 1 making Widget A, Line 2 making Widget B). Every shift gets a status: On Target at 100% of target or more, Near Target from 90%, and Below Target under 90%. In the sample, 11 of the 52 shifts are on target.
How to Make a Production Tracker in Excel, Step by Step
The steps below follow the How to Build sheet in the template. Formulas assume the Production Log headers sit in row 4 and data starts in row 5.
Part 1: Set up the workbook (steps 1 to 4)
- Create three sheets named Dashboard, Production Log and Get the Full Version (right-click a sheet tab, then Rename). Keep the Dashboard first so the file opens on the summary.
- On Production Log, type a title in A1 and a short instruction in A2, such as “Enter one row per line per shift”.
- Type the headers in A4:K4: Date, Shift, Line, Product, Target Qty, Actual Qty, Rejected Qty, Good Qty, Achievement %, Scrap %, Status. Make the row bold with a dark fill and white text.
- Enter data in columns A to G from row 5. Columns H to K are formulas, so never type in them.
Part 2: Add the calculated columns (steps 5 to 9)
These four formulas turn a plain log into an excel production tracking template.
- Good Qty (H5):
=IF(F5="","",F5-G5). The IF keeps the cell blank until an Actual Qty is entered. - Achievement % (I5):
=IF(OR(E5="",E5=0),"",F5/E5). Format it as a percentage with one decimal. - Scrap % (J5):
=IF(OR(F5="",F5=0),"",G5/F5). The OR stops a #DIV/0! error on empty rows. - Status (K5):
=IF(I5="","",IF(I5>=1,"On Target",IF(I5>=0.9,"Near Target","Below Target"))). Change 0.9 if your “near” limit is different.
Select H5:K5 and drag the fill handle to row 116 so new rows calculate automatically. Shade H:K light grey so users know not to type there.
Part 3: Make data entry easy (steps 10 to 14)
- Add a Shift dropdown to B5:B116 with Data > Data Validation > List >
A,B,C. - Add a Line dropdown to C5:C116 with the list
Line 1,Line 2,Line 3,Line 4, edited to match your factory. - Colour the Status column with Home > Conditional Formatting > Highlight Cells > Text that Contains: green for On Target, amber for Near Target, red for Below Target.
- Add Data Bars to Achievement % (I5:I116) and set the maximum to 1.1 so 100% fills most of the bar.
- Click A5, then View > Freeze Panes, to keep the header row visible.
Microsoft’s guide to applying data validation to cells covers the dropdown options in more detail.
Part 4: Build the KPI cards on the Dashboard (steps 15 to 20)
- Target Qty (B5):
=SUM('Production Log'!E5:E116) - Actual Qty (E5):
=SUM('Production Log'!F5:F116) - Achievement % (H5):
=IFERROR(SUM('Production Log'!F5:F116)/SUM('Production Log'!E5:E116),0). This is overall achievement, not an average of daily percentages. - Scrap % (K5):
=IFERROR(SUM('Production Log'!G5:G116)/SUM('Production Log'!F5:F116),0) - Shifts On Target (N5):
=COUNTIF('Production Log'!K5:K116,"On Target")&" / "&COUNT('Production Log'!I5:I116)
Put a coloured label above each card in row 4 (teal with white text) and give the value cells a light blue fill. Merging B5:C6 makes a bigger card.
Part 5: Helper tables that feed the charts (steps 21 to 27)
Charts read best from a small summary table, so build one in columns U to Y of the Dashboard. Type the headers Date, Target, Actual and Scrap % in U4:X4, then list each production date once from U5 down (copy the dates from the log and use Data > Remove Duplicates).
- Daily Target (V5):
=SUMIFS('Production Log'!$E$5:$E$116,'Production Log'!$A$5:$A$116,U5) - Daily Actual (W5):
=SUMIFS('Production Log'!$F$5:$F$116,'Production Log'!$A$5:$A$116,U5) - Daily Scrap % (X5):
=IFERROR(SUMIFS('Production Log'!$G$5:$G$116,'Production Log'!$A$5:$A$116,U5)/W5,0) - Chart label (Y5):
=TEXT(U5,"dd-mmm"). Using the date as text means the chart shows no gaps for days off.
Copy V5:Y5 down for every date. Then add a by-line table in U34:X36 with Line, Target, Actual and Achv %: =SUMIFS('Production Log'!$E$5:$E$116,'Production Log'!$C$5:$C$116,U35) for target, the same with column F for actual, and =IFERROR(W35/V35,0) for achievement. The $ signs lock the ranges when you copy down. See Microsoft’s SUMIFS function reference for the syntax.
Part 6: Add the charts (steps 28 to 31)
- Daily Output: Target vs Actual: select V4:W30, Insert > Clustered Column, then Select Data and set the axis labels to Y5:Y30. Light grey for Target and teal for Actual makes the gap easy to see.
- Daily Scrap %: select X4:X30, Insert > Line, axis labels Y5:Y30. Set the vertical axis minimum to 0.
- Achievement % by Line: select U35:U36 and X35:X36, Insert > Clustered Bar. Add data labels and set the axis maximum to 1.1.
- Finish the design: View > untick Gridlines, add a dark title banner in B1, group the charts under the cards and move the helper columns off-screen.
That is the whole build. From now on you type new rows on the Production Log and every KPI and chart updates. The one manual job is adding new dates to the helper table in column U so they appear on the daily charts.
Use It as a Daily Production Report Format in Excel
Once the tracker is built, the Production Log works as a daily production report format in Excel. Each supervisor logs their shift, the Status column flags anything under 90% of target, and the Dashboard gives the morning meeting one page to look at. Because the Achievement % card divides total actual by total target, a single bad day cannot be hidden by averaging percentages.
Production Tracker Excel vs. Manufacturing Dashboard vs. Paid Production Software
| Feature | Free Production Tracker in Excel | Manufacturing Dashboard in Excel | Paid MES / production software |
|---|---|---|---|
| Cost | Free | One-time purchase | Monthly subscription, often per user |
| Platform | Microsoft Excel (.xlsx) | Microsoft Excel | Web app |
| Setup time | Minutes | Replace sample data | Onboarding project |
| Macros or add-ins | None | None | Not applicable |
| Output vs target and scrap % | Yes | Yes | Yes |
| OEE, MTBF, MTTR and downtime | No | Yes, 15+ KPIs | Usually |
| Build guide with every formula | Yes, 32 steps | No | No |
| Live machine data | No, manual entry | No, manual entry | Often |
Start free, upgrade to the Manufacturing Dashboard when you need OEE and downtime analysis, and look at paid software only when you need live machine data.
Who Should Use This Template
Perfect for:
- Shift leads and supervisors reporting output against target on two to four lines
- Small workshops replacing a paper production report
- Excel learners who want a real project that uses SUMIFS, COUNTIF and conditional formatting
Not a fit if:
- You need OEE, MTBF, MTTR or downtime reasons
- You need live data from machines; this is manual entry
- Your log runs past row 116 and you do not want to extend the formulas
Limitations and Ways to Extend It
The tracker is deliberately simple. The formulas cover rows 5 to 116 (112 shift rows), the daily helper table needs new dates added by hand, and the by-line table lists Line 1 and Line 2 only, so add rows for Line 3 and Line 4 if you use them. A good next step is converting the log to an Excel Table so ranges grow on their own. For a similar build that uses form controls, see our tutorial on Excel combo boxes, spin buttons and option buttons.
Upgrade: The Manufacturing Dashboard in Excel
When “did we hit target?” is not enough and you need to know why output was lost, the Manufacturing Dashboard in Excel is the next step:
- 15+ manufacturing KPIs: OEE, Throughput, First Pass Yield, Downtime, MTBF, MTTR and Scrap Rate
- 7 analysis pages: Production, Efficiency, Quality, Downtime, Inventory, Data and Support
- Views across shifts, machines and product lines
- 100% native Excel with no macros, for Excel 2016, 2019, 2021 and Microsoft 365
- One-time purchase with lifetime access
Explore Relevant Templates
- Plant Production Planning and Control Management System in Excel VBA
- Fire Safety Equipment Manufacturing Dashboard in Excel
- Flooring Materials Manufacturing Dashboard in Excel
- Manufacturing Business Plan Templates Kit
- Production Planning Dashboard in Excel and the Manufacturing Excellence Bundle
Frequently Asked Questions
Is the production tracker Excel template free?
Yes. The Production Tracker in Excel is a free download from NextGenTemplates. It contains the Dashboard, Production Log, How to Build and Get the Full Version sheets, with 52 sample shifts you can clear and replace with your own data.
Which Excel functions does the production tracker use?
The Production Tracker in Excel uses IF, OR, SUM, SUMIFS, COUNTIF, COUNT, IFERROR and TEXT, plus data validation dropdowns, conditional formatting and three standard charts. There are no macros, so it opens as a normal .xlsx file.
How long does it take to build?
Following the 32 steps on the How to Build sheet takes about an hour for most Excel users. Using the finished free Production Tracker in Excel takes minutes: clear the sample rows, type your shifts and add your dates to the helper table.
How is Achievement % different from an average of daily percentages?
The Achievement % card divides total Actual Qty by total Target Qty across the whole log. Averaging daily percentages gives a small day the same weight as a big day, which can make performance look better or worse than it really was.
How does this compare to paid production software?
The Production Tracker in Excel is free and covers output vs target and scrap with manual entry. Paid MES tools charge a recurring fee and add live machine data. The Manufacturing Dashboard in Excel sits between them with 15+ KPIs and a one-time price.
Is there a video tutorial?
Yes. The 11-minute step-by-step video tutorial for the Production Tracker in Excel is on the PK: An Excel Expert YouTube channel at youtu.be/ymh5N_jZuvs, and the How to Build sheet inside the free download lists every step and formula.
About the Author
Built by PK, Microsoft Certified Professional with 15+ years of Excel, Google Sheets, and Power BI experience. Founder of NextGenTemplates, reaching 300K+ subscribers across YouTube channels. Every template is hand-built and tested before release.
Conclusion
A production tracker in Excel needs only a clean log, four calculated columns, five KPI formulas and three charts. Build it yourself with the steps above, or start from the finished file.
Download the Free Practice File
⬇️ Download the Free Practice File
Free Production Tracker in Excel · .zip · no macros
🚀 Need OEE, downtime and quality analysis? Get the Manufacturing Dashboard in Excel
Free download · No macros · Plain .xlsx
🎥 Watch the video tutorial: youtu.be/ymh5N_jZuvs
Last updated: October 2026