Most security teams do not have a cyber risk reporting problem. They have a cyber risk presentation problem. The register exists, it is usually a spreadsheet with a few hundred rows, and it is perfectly accurate – and then the board asks “where is our money at risk?” and somebody spends two evenings building charts. The Cyber Risk Management Dashboard in Excel removes those two evenings. It is a five-page workbook that sits on top of a 24-column risk register and reports it back as an executive pack: 500 sample rows, 7 business units, 7 asset categories, 8 threat categories and 6 compliance frameworks, all populated the moment you open the file.
No macros, no add-ins, no external connections. Plain PivotTables, slicers and Excel charts, which is exactly why it survives a corporate security policy that blocks everything else.
Key Features of the Cyber Risk Management Dashboard in Excel
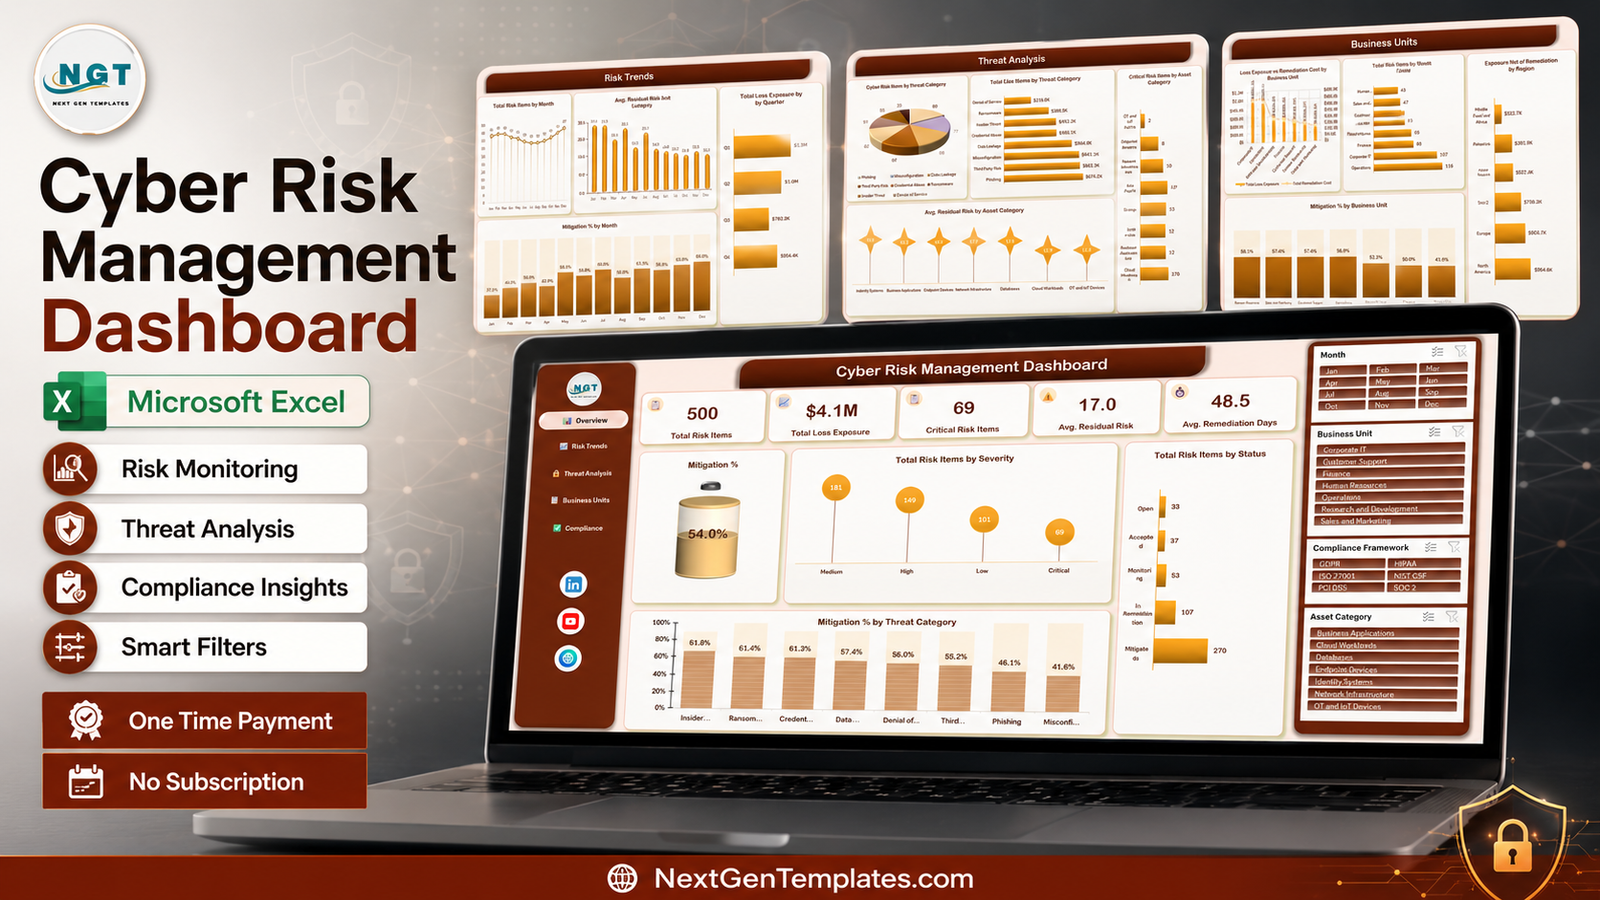
- Five report pages – Overview, Risk Trends, Threat Analysis, Business Units and Compliance, each with sidebar navigation.
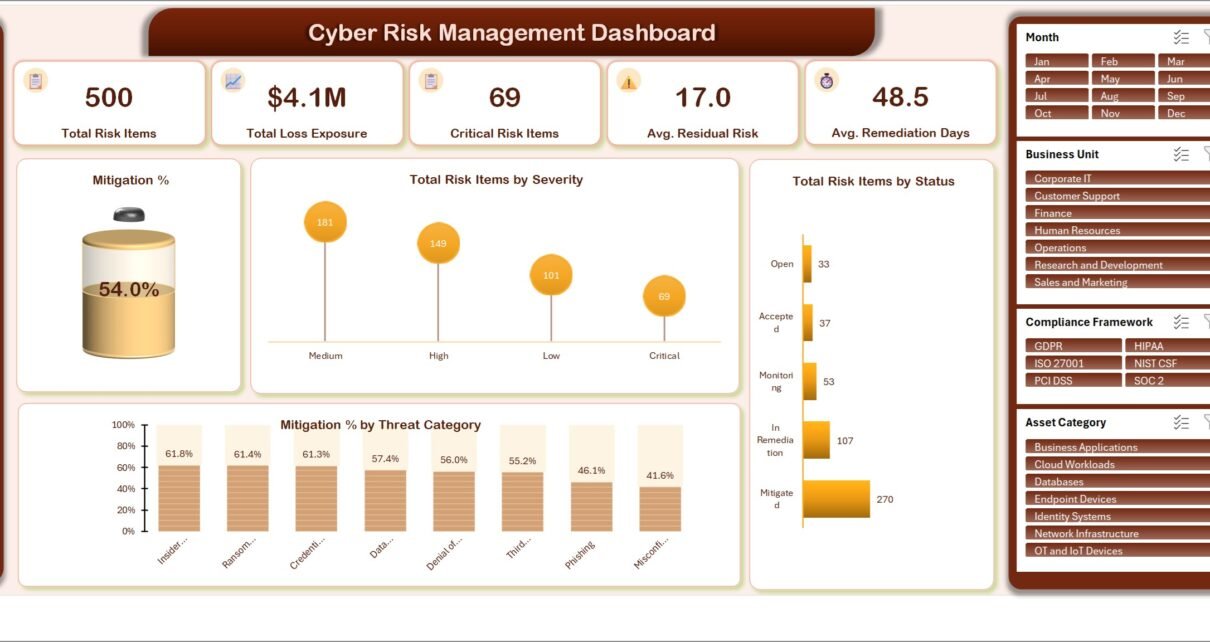
- Five KPI cards on the Overview page: Total Risk Items (500), Total Loss Exposure ($4.1M), Critical Risk Items (69), Avg. Residual Risk (17.0) and Avg. Remediation Days (48.5) in the shipped sample.
- Four slicers repeated on every page – Month, Business Unit, Compliance Framework and Asset Category.
- A mitigation gauge reading 54.0% on the sample data, so the closed-versus-open position is a single number.
- Sixteen charts across the five pages, all driven by PivotTables rather than static ranges.
- A Data sheet with 24 columns and a Support sheet with contact and tutorial links.
- Six frameworks modelled – GDPR, HIPAA, ISO 27001, NIST CSF, PCI DSS and SOC 2.
- Works in Excel 2016 and later, Microsoft 365 and Excel for Mac.
Dashboard Pages Explanation
Page 1 – Overview
The executive summary. Five KPI cards run across the top, and beneath them sit three visuals. The mitigation gauge shows the overall closure position. Total Risk Items by Severity splits the register into Medium 181, High 149, Low 101 and Critical 69. Total Risk Items by Status breaks the same 500 items into Open 33, Accepted 37, Monitoring 53, In Remediation 107 and Mitigated 270 – which is the single most useful chart in a steering committee, because it separates “we know about it” from “we did something about it”. At the bottom, Mitigation % by Threat Category ranks the eight threat types from Insider Threat at 61.8% down to Misconfiguration at 41.6%.
Page 2 – Risk Trends
Total Risk Items by Month plots the intake line across twelve months. Avg. Residual Risk by Month shows the residual score falling from 23.4 in January to 12.2 in December on the sample data – the shape you want to be able to show. Total Loss Exposure by Quarter compresses that into four bars ($1.3M in Q1 down to $959.4K in Q4), and Mitigation % by Month tracks closure rate month by month. This page answers the only question a board really asks: is this getting better or worse?
Page 3 – Threat Analysis
Here the register is cut by what is attacking you and what it is attacking. Total Risk Items by Threat Category is a pie across Phishing, Misconfiguration, Data Leakage, Third Party Risk, Credential Abuse, Ransomware, Insider Threat and Denial of Service. Total Loss Exposure by Threat Category ranks the same eight by money instead of count, and the ordering changes – Phishing leads at $674.2K while Denial of Service sits at $219.5K. Critical Risk Items by Asset Category and Avg. Residual Risk by Asset Category then pivot to the asset side across Identity Systems, Business Applications, Endpoint Devices, Network Infrastructure, Databases, Cloud Workloads and OT and IoT Devices.
Page 4 – Business Units
The accountability page. Loss Exposure vs Remediation Cost by Business Unit is a combo chart – bars for exposure, a line for what it would cost to fix – and the gap between them is the argument for next year’s budget. Total Risk Items by Business Unit ranks the seven units by volume (Operations 116 and Corporate IT 107 lead the sample). Exposure Net of Remediation by Region covers North America, Europe, Asia Pacific, Latin America and Middle East and Africa. Mitigation % by Business Unit closes the page with a closure-rate league table from 58.1% down to 49.5%.
Page 5 – Compliance
Total Risk Items by Compliance Framework and Loss Exposure by Compliance Framework report the register through the lens an auditor uses, with ISO 27001 carrying $1.2M of exposure in the sample and HIPAA the least at $192.0K. Avg. Assurance Rating by Compliance Framework shows how confident you are in each control set on a 1-5 scale. Total Risk Items by Risk Band then buckets everything into Low 285, Moderate 134, Elevated 60 and Severe 21.
Cyber Risk Management Dashboard in Excel vs. Google Sheets vs. Paid GRC SaaS – Feature Comparison
| This Excel dashboard | Google Sheets build | Paid GRC platform | |
|---|---|---|---|
| Cost | $17.99 one time | Free tool, your build time | $15,000+ per year at entry tier |
| Platform | Excel 2016+, Microsoft 365, Mac | Browser | Vendor cloud |
| Setup time | Under 30 minutes | 2-3 days to rebuild the charts | 6-12 weeks implementation |
| Real-time team collaboration | OneDrive or SharePoint co-authoring | Yes, native | Yes, native |
| Mobile access | Excel mobile app | Yes | Yes |
| Customisable fields | Any column on the Data sheet | Yes | Configurable, often chargeable |
| Share with a link | Yes, through OneDrive | Yes | Named-seat licensing |
| Year-1 cost at 5 users | $17.99 | $0 plus build labour | $15,000 – $60,000 |
| Framework reporting built in | Six frameworks on the Compliance page | Build it yourself | Built in |
| Register leaves your network | No | Google servers | Vendor servers |
Who Should Use This Template
IT risk managers and CISOs at organisations between roughly 100 and 5,000 staff, where the register is real but a GRC platform is not yet funded. Internal audit and GRC analysts who need a defensible board pack quickly. MSPs and vCISO consultants who report to several clients and want one repeatable deliverable. ISO 27001 and SOC 2 programme owners assembling evidence for a surveillance audit. And Excel-first analysts who would rather own the file than learn another vendor console.
It is a poor fit if you need automated feeds from a SIEM or a vulnerability scanner, if remediation must be ticketed and tracked with SLAs, or if a regulator requires field-level change history. Those are platform problems, not spreadsheet problems.
Real-World Use Cases
Quarterly risk committee. Filter the Compliance Framework slicer to PCI DSS, export the Compliance page to PDF, and the finance-facing half of the pack is done in minutes rather than an evening.
Budget defence. The Loss Exposure vs Remediation Cost combo chart on the Business Units page turns “we need more headcount” into a visible gap between what a failure costs and what a fix costs.
Client reporting for a vCISO. One copy of the workbook per client, the same five pages every month, and a consistent deliverable that can be priced and repeated.
Post-incident review. Filter to a single Asset Category and month to show exactly what was open, monitored and mitigated at the time of an incident.
Advantages of the Cyber Risk Management Dashboard in Excel
- Nothing to install and nothing to enable. No macros means it passes security review in environments where a .xlsm never would.
- Your data never leaves the file. There are no external connections, which matters when the register itself is sensitive.
- Slicers do the work. One click on Business Unit re-cuts every chart on the page instead of forcing a rebuild.
- Money and count side by side. Loss exposure alongside item counts stops the classic mistake of prioritising the noisiest category rather than the costliest one.
- Framework-native. Reporting by GDPR, HIPAA, ISO 27001, NIST CSF, PCI DSS and SOC 2 is built in, not bolted on.
- Editable end to end. Colours, titles and the logo panel are yours to change.
Opportunities for Improvement
Being honest about the limits is what makes the rest of this credible. The workbook does not ingest data automatically – somebody maintains the register. There is no user permission model, so anyone with the file can edit anything. Refresh time grows noticeably past roughly 50,000 rows, at which point Power BI is the better destination. There is no built-in workflow for approvals or exception sign-off. And the dashboard reports assessments, not live alerts, so it complements a SOC tool rather than replacing one.
Best Practices
- Freeze your category values. Keep Severity, Status, Threat Category and Asset Category to a fixed list. Free text is what breaks slicer-driven dashboards.
- Reassess on a cadence, not on a whim. Monthly or quarterly reassessment gives the Risk Trends page a real trend rather than a sawtooth.
- Record both inherent and residual scores. The difference between them is the only evidence that your controls are doing anything.
- Keep Remediation Cost populated. Half the value of the Business Units page disappears if the cost column is blank.
- Refresh before you screenshot. Press Ctrl+Alt+F5 so every PivotTable is current, then export.
- Map your register to a framework. The NIST Cybersecurity Framework is a good starting structure, and Microsoft’s own guide to slicers covers the filtering mechanics if you want to extend the pages.
Explore Relevant Templates
- Cyber Risk Management Dashboard in Excel – the template described in this post.
- Cybersecurity Operations Center Dashboard in Excel – incidents, alerts, detection and containment.
- Compliance Monitoring Dashboard in Excel – control testing and audit findings.
- Data Privacy Office Dashboard in Excel – privacy programme reporting.
- IT and Cybersecurity Operations Bundle – eight Excel and Power BI templates together.
Frequently Asked Questions
Does the Cyber Risk Management Dashboard in Excel use macros?
No. It is a plain .xlsx built on PivotTables, slicers and native charts, so there is no macro warning and nothing to enable.
Can I use my own risk register?
Yes. Replace the 500 sample rows on the Data sheet, keep the headers as they are, and refresh. Every page rebuilds from your data.
Will it work in Excel for Mac or Excel on the web?
Mac and Windows desktop are both fine. Excel for the web renders the pages, but slicer behaviour there is limited, so use a desktop version for interactive filtering.
How is this different from a KPI scorecard?
A KPI scorecard reports a fixed set of metrics against targets for one period. This is an analytical dashboard: it slices a whole register by severity, threat, asset, business unit, region and framework.
Can I add more compliance frameworks?
Yes. Add the value in the Compliance Framework column and refresh – the slicer and both framework charts pick it up with no formula edits.
Does it calculate risk scores for me?
The register carries Likelihood, Impact, Inherent Risk and Residual Risk columns that you populate from your own methodology. The dashboard reports them; it does not impose a scoring model.
About the Author
Built by PK – Microsoft Certified Professional with 15+ years of Excel, Google Sheets, and Power BI experience. Founder of NextGenTemplates, reaching 300K+ subscribers across YouTube channels. Every template is hand-built and tested before release.
Conclusion
A risk register is only as useful as the conversation it can start. The Cyber Risk Management Dashboard in Excel takes 500 rows of assessments and turns them into five pages that answer the questions leadership actually asks: how much money is exposed, which threats and assets carry it, which business units are closing risks and which are not, and how each compliance framework is holding up. It installs nothing, sends nothing anywhere, and costs $17.99 once.
Get the Cyber Risk Management Dashboard in Excel and start reporting on your own register today. For step-by-step Excel dashboard tutorials, subscribe to youtube.com/@PKAnExcelExpert.