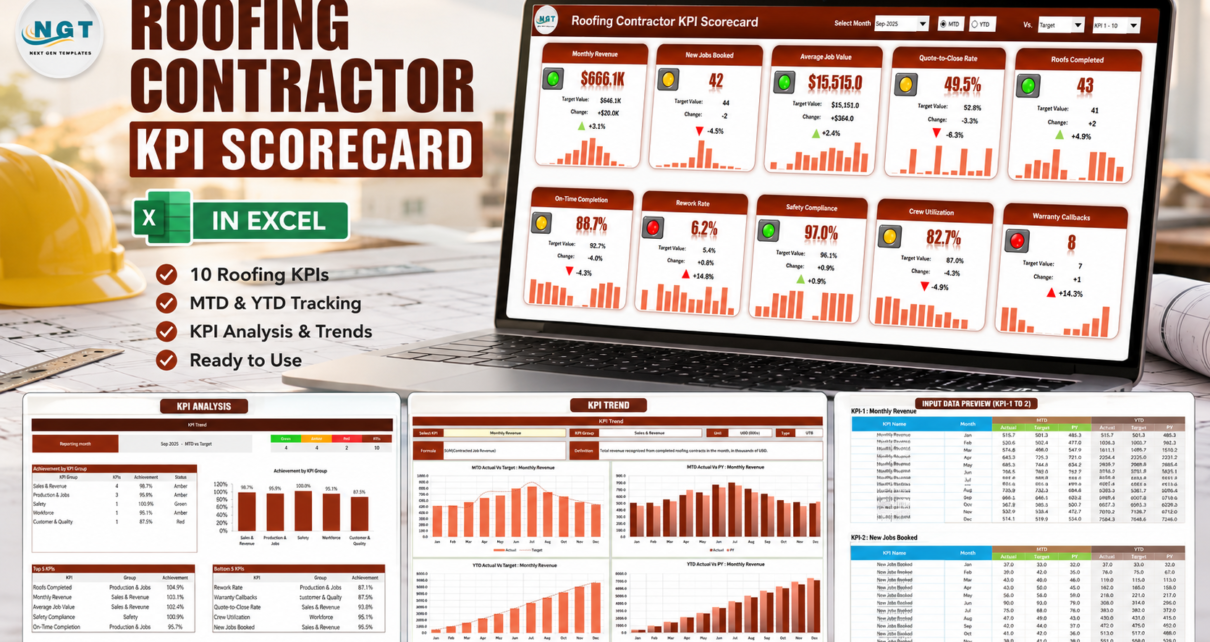
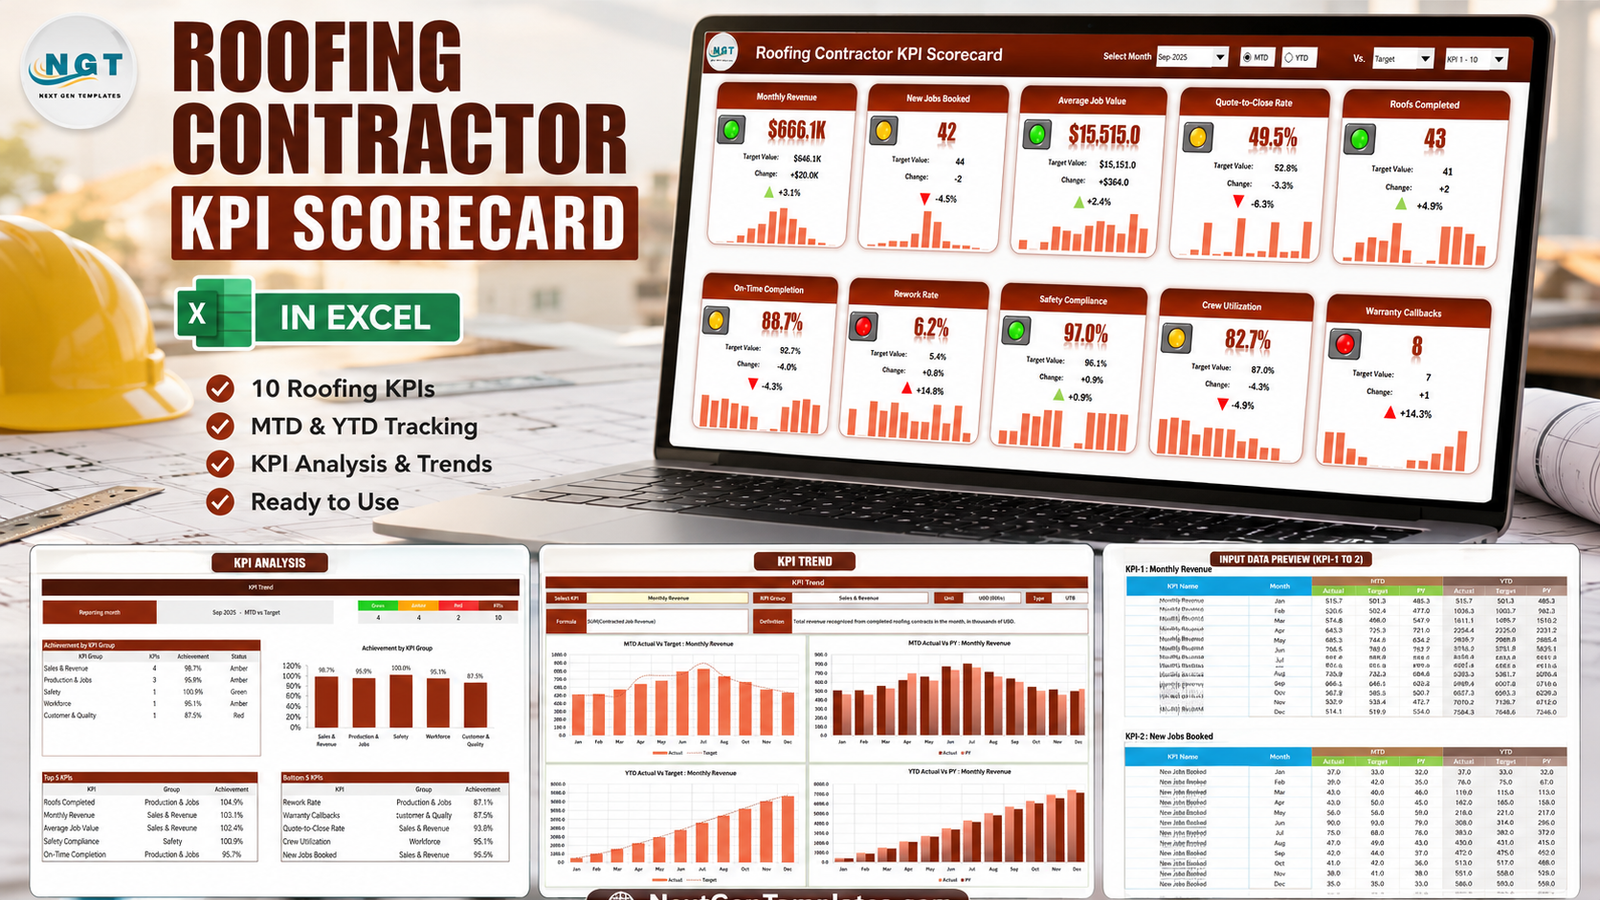
Most roofing companies already know their revenue. Far fewer can say, on the second Tuesday of the month, what share of jobs finished on time, how much of the crew’s paid hours were billable, and whether rework is creeping up. The Roofing Contractor KPI Scorecard in Excel puts all of that on one page: ten KPIs, five groups, a target and a red / amber / green light on every tile, and a twelve-month sparkline underneath. In the September 2025 sample that ships with the file, the month reads 4 green, 4 amber and 2 red – revenue $666.1K against a $646.1K target, but a 6.2% rework rate against a 5.4% ceiling and eight warranty callbacks against seven. It is 100% worksheet formulas: no macros, no Power Query, no add-ins.
This is the scorecard line – a month picker and a target-versus-actual tile wall built on figures you type – not the slicer-driven KPI dashboards built on a transaction table. If you want the same scorecard in a browser, there is a Google Sheets edition of the identical product.
Key Features of the Roofing Contractor KPI Scorecard in Excel
- Ten roofing KPIs across five groups. Sales & Revenue holds Monthly Revenue, New Jobs Booked, Average Job Value and Quote-to-Close Rate. Production & Jobs holds Roofs Completed, On-Time Completion and Rework Rate. Then Safety Compliance, Crew Utilization and Warranty Callbacks.
- One month picker drives every page. Change Sep-2025 in the header and the tile wall, the analysis page and the trend page all follow.
- MTD or YTD on a radio toggle, compared against Target, Prior Year or Prior Month.
- Direction-aware scoring. Each KPI is typed UTB (upper the better) or LTB (lower the better) on the definition sheet. Rework Rate and Warranty Callbacks are LTB, so the light and the arrow read a fall as good news.
- Editable RAG bands. Green at or above target, amber within 10%, red beyond – two small tables on Color Settings, and every page follows them.
- Room for 20 KPIs, shown ten at a time through the KPI set picker in the header.
- A duplicate-name check. Every page looks a KPI up by name, so the Check column on KPI Definition turns red if you create two KPIs with the same name.
Sheet-by-Sheet Walkthrough
Home
A navigation page: eight linked cards, one per sheet, each with a one-line description. It is also where the file states its own promise – “type your numbers on Input Data, name your KPIs on KPI Definition, and every page follows”.
Scorecard
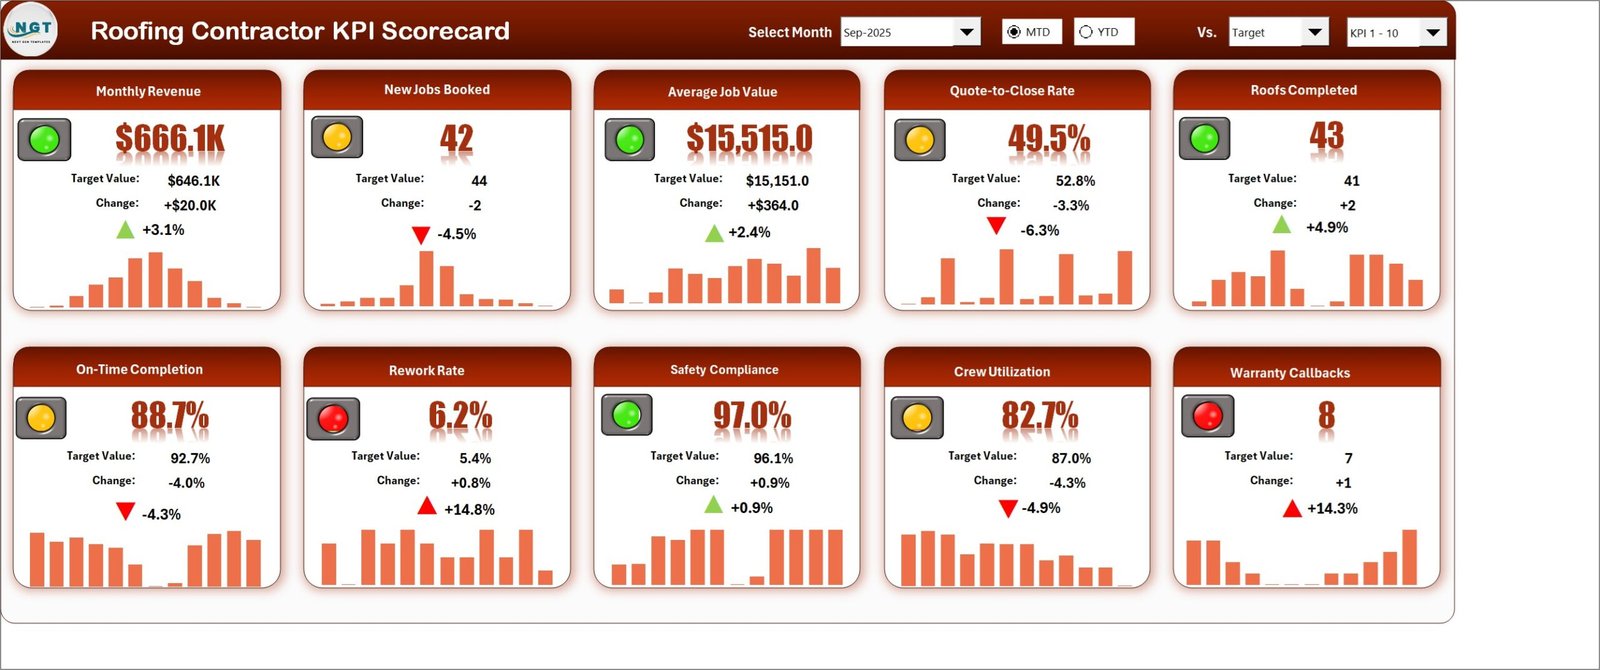
The tile wall, and the page you will actually use. Ten cards in two rows of five. Each card carries the KPI name, the traffic light, the value, the target value, the absolute change, the percentage change with a coloured up or down arrow, and a twelve-month sparkline. In the sample month Monthly Revenue reads $666.1K against $646.1K (+3.1%, green), Quote-to-Close Rate 49.5% against 52.8% (-6.3%, amber) and Rework Rate 6.2% against 5.4% (+14.8%, red).
KPI Analysis
Three blocks. A counter across the top – 4 green, 4 amber, 2 red, 10 KPIs. Achievement by KPI group as a table and a column chart: Sales & Revenue 98.7%, Production & Jobs 95.9%, Safety 100.9%, Workforce 95.1%, Customer & Quality 87.5%. Then Top 5 and Bottom 5 KPI lists – Roofs Completed leads at 104.9%, Rework Rate trails at 87.1%. With one KPI in three of the five groups, a single weak metric can pull a whole group red, which is exactly what Customer & Quality shows.
KPI Trend
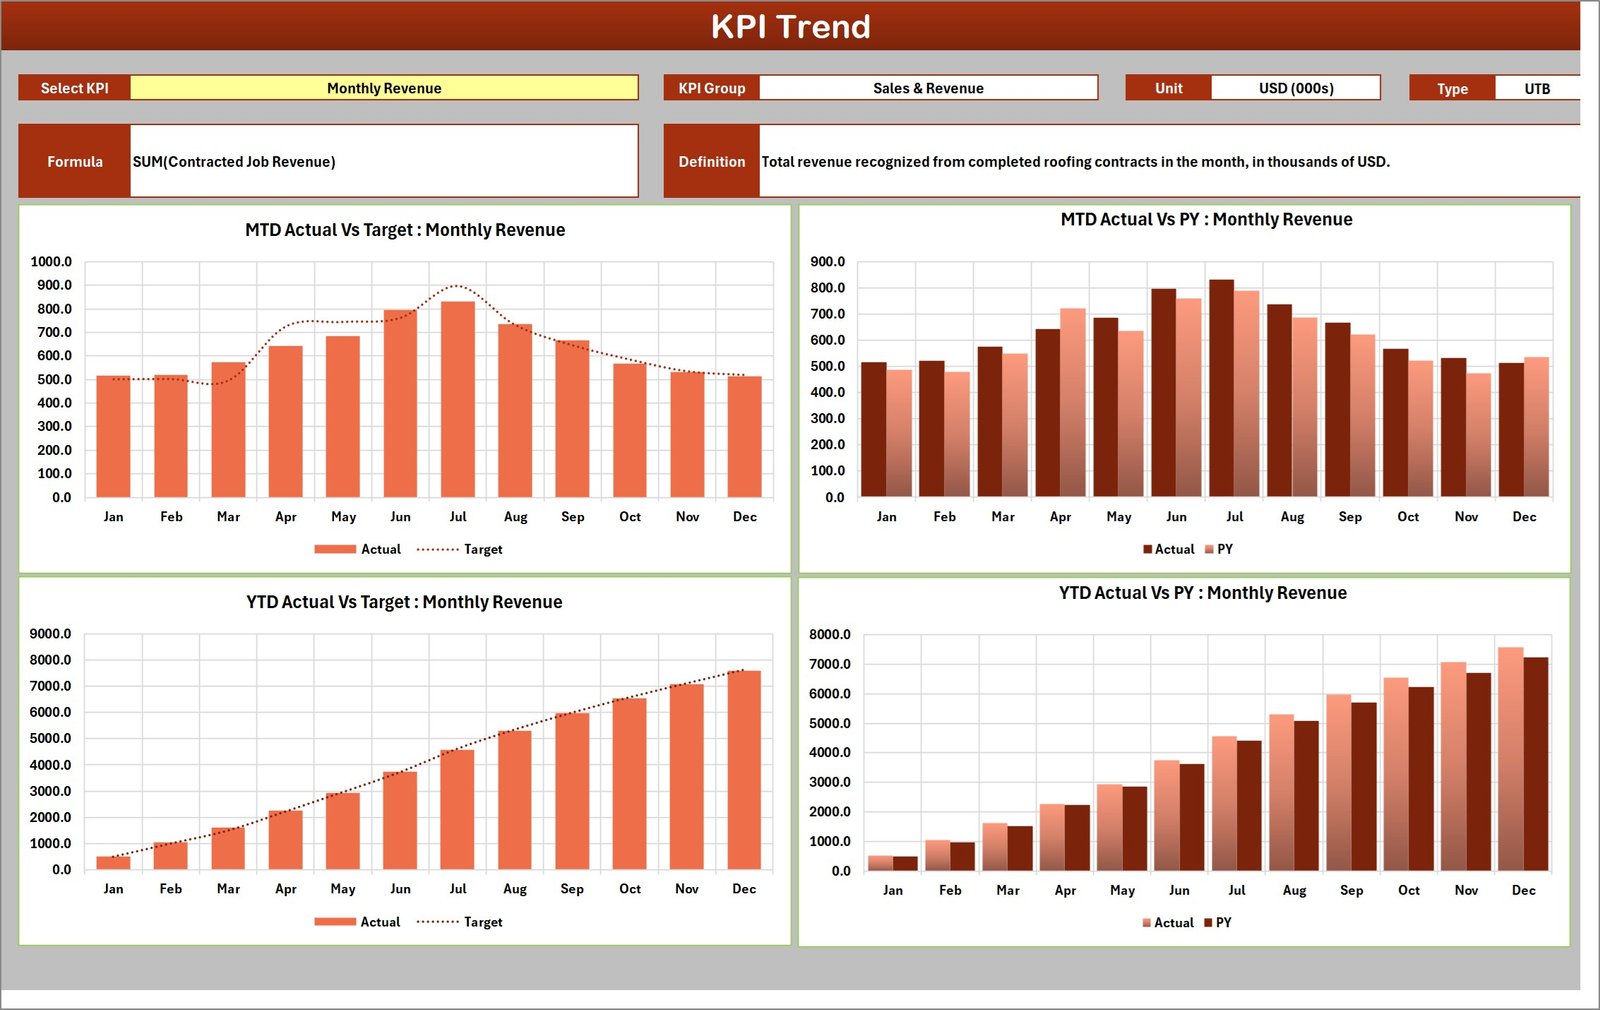
Pick one KPI from a dropdown and the page reports its group, unit, direction, formula and definition, then draws four charts: MTD Actual vs Target, MTD Actual vs PY, YTD Actual vs Target and YTD Actual vs PY. This is where a monthly wobble separates from a trend – roofing revenue peaking in July and falling away through the winter is seasonality, not a problem.
Input Data
The only sheet you type into regularly. Twenty numbered blocks, one per KPI slot, each with twelve month rows and six columns: MTD Actual, Target and PY, then YTD Actual, Target and PY.
KPI Definition, Color Settings and Read Me
KPI Definition carries the name, group, unit, formula, plain-English definition, direction and YTD basis for each KPI – for example, Crew Utilization is “Billable Crew Hours / Available Crew Hours”, UTB, averaged for YTD. Color Settings holds the RAG bands, the report title and the reporting year that makes the month picker read Sep-25 rather than Sep. Read Me is nine short notes on how the workbook is wired.
Excel vs. Google Sheets vs. Paid Field-Service Software – Feature Comparison
| This scorecard (Excel) | Google Sheets edition | Field-service SaaS | |
|---|---|---|---|
| Cost | $9.99 once | $8.99 once | $99-$300+ per user per month |
| Platform | Excel for Windows desktop 2016+ | Any browser | Web plus mobile app |
| Setup time | Rename the KPIs, type twelve months | Same, in the browser | Weeks – crews, price book, integrations |
| Real-time collaboration | No | Yes | Yes |
| Mobile access | Limited | Yes | Yes |
| Rename or replace KPIs | Yes – all ten, room for twenty | Yes | Fixed catalogue plus paid custom reports |
| Data stays on your machine | Yes | No | No |
| Year-1 cost at 5 users | $9.99 | $8.99 | $6,000-$18,000 |
| Job scheduling and invoicing | No | No | Yes |
Who Should Use This Template
Owner-operated and mid-size roofing companies running roughly 30-60 jobs a month, where somebody already keeps the numbers – a job book, an accounting package, a crew timesheet – and the management meeting needs one page instead of five exports. It fits an office manager reporting to an owner, a general manager watching several crews, and a safety lead who wants compliance scored beside revenue rather than buried in a separate report.
It is the wrong tool if you want scheduling, estimating or invoicing, if you expect the file to pull from QuickBooks or a CRM on its own, if your team only ever opens spreadsheets on a phone, or if you report daily rather than monthly.
Real-World Use Cases
The monthly owners’ meeting. An office manager types last month’s figures on Input Data and prints the Scorecard. In the sample month the two reds – rework at 6.2% and eight warranty callbacks – set the agenda, because everything else was within tolerance.
Reading two sales KPIs together. Quote-to-Close Rate falling to 49.5% while Average Job Value rises to $15,515 usually means a shift towards larger, more competitive bids – a different conversation from both falling at once. KPI Trend answers whether either is a trend or a one-month spike.
Keeping safety on the owner’s page. Safety Compliance – passed site audits over total site audits – sits on the same tile wall as revenue, at 97.0% against a 96.1% target. Roofing is one of the highest fall-risk trades in construction, and OSHA’s fall protection guidance is the reason most contractors audit at all; scoring it monthly beside the money is what keeps it from drifting.
Advantages of the Roofing Contractor KPI Scorecard in Excel
- No macros to enable. Formulas, conditional formatting, camera pictures and Excel sparklines only – it opens in a locked-down corporate environment without a security prompt.
- Ten minutes a month. Once the KPI names are set, the recurring work is typing twelve numbers per KPI per year.
- Thresholds you own. If 10% is too generous for rework and too tight for utilization, change the bands and every page re-scores.
- It travels. Rename the KPIs and the same workbook reports a masonry, siding or gutter division.
- Your data stays local. Nothing syncs to a vendor cloud.
Opportunities for Improvement
Three honest notes, so nothing is a surprise after purchase:
- YTD is typed, not calculated. That is deliberate – the correct roll-up differs by KPI, a sum for revenue and job counts and an average for rates – but it does mean you enter six numbers per month per KPI rather than three, and the YTD Basis column is where you record which rule you used.
- One reporting year at a time. Twelve months plus prior-year comparatives. A second year means a second copy of the file.
- A few cosmetic edges. The Average Job Value tile prints a trailing decimal on a whole-dollar figure ($15,515.0); the Input Data and KPI Definition sheets keep a blue and purple header palette rather than the maroon of the report pages; and the two prior-year charts on KPI Trend assign the light and dark bars to Actual and PY the opposite way round from each other. None of it affects a single number.
Best Practices
- Set the direction before the numbers. A KPI typed UTB by mistake will show a falling rework rate as red. Check the Type column first.
- Write the YTD rule down. Fill the YTD Basis column as you go, so whoever fills the sheet next year sums what you summed.
- Set targets once a year and leave them. A target edited mid-year to match the actual destroys the only thing the traffic light is measuring.
- Keep KPI names short and unique. Every page looks KPIs up by name; the Check column will tell you if you have duplicated one.
- Review with the group table, act with the Bottom 5. Group achievement tells you where the problem lives; the Bottom 5 list names it.
- Keep the sample month. Save an untouched copy of the file before you overwrite the demo figures – it is the fastest way to see how a page should look.
Explore Relevant Templates
The same scorecard for other trades: HVAC Contractor KPI Scorecard in Excel, Electrical Contractor KPI Scorecard in Excel and Plumbing Business KPI Scorecard in Excel. To capture the jobs that feed these numbers, look at the Job Work Order Data Entry System in Excel or the Roof Inspection Checklist in Google Sheets. For a whole-project view, the Civil Contractor Job Management System Web App goes well beyond monthly reporting.
Frequently Asked Questions
Does the Roofing Contractor KPI Scorecard in Excel use macros?
No. It is entirely worksheet formulas, conditional formatting, camera pictures and sparklines, and it opens on Excel for Windows desktop 2016 or later.
Can I replace the ten roofing KPIs with my own?
Yes. Rename them on KPI Definition with their group, unit, formula, direction and YTD basis, then fill the matching numbered block on Input Data. There is room for 20 KPIs, displayed ten at a time.
Does it connect to QuickBooks, Xero or a roofing CRM?
No. There is no query connection and no API – you type the monthly figures or paste them from your own export.
Will it run in Excel for the web or on a Mac?
It is built for Excel for Windows desktop. The camera pictures and sparklines behind the tile wall do not render reliably elsewhere, which is why the Google Sheets edition exists for browser-first teams.
How long does the first setup take?
Plan on an hour if you are changing KPI names and typing a full year of history, and about ten minutes a month afterwards.
What is in the download?
A ZIP holding the workbook and a PDF user manual that walks through each sheet.
About the Author
Built by PK – Microsoft Certified Professional with 15+ years of Excel, Google Sheets, and Power BI experience. Founder of NextGenTemplates, reaching 300K+ subscribers across YouTube channels. Every template is hand-built and tested before release.
Conclusion
A roofing business does not fail because nobody knew the revenue. It slips because rework, callbacks and idle crew hours were never scored against a target on the same page as the money. The Roofing Contractor KPI Scorecard in Excel is $9.99, opens without a macro warning, and takes about ten minutes a month once your KPI names are in. Prefer to work in a browser? Take the Google Sheets edition instead – same ten KPIs, same traffic lights.
For walkthroughs of this and other templates, subscribe at youtube.com/@PKAnExcelExpert.