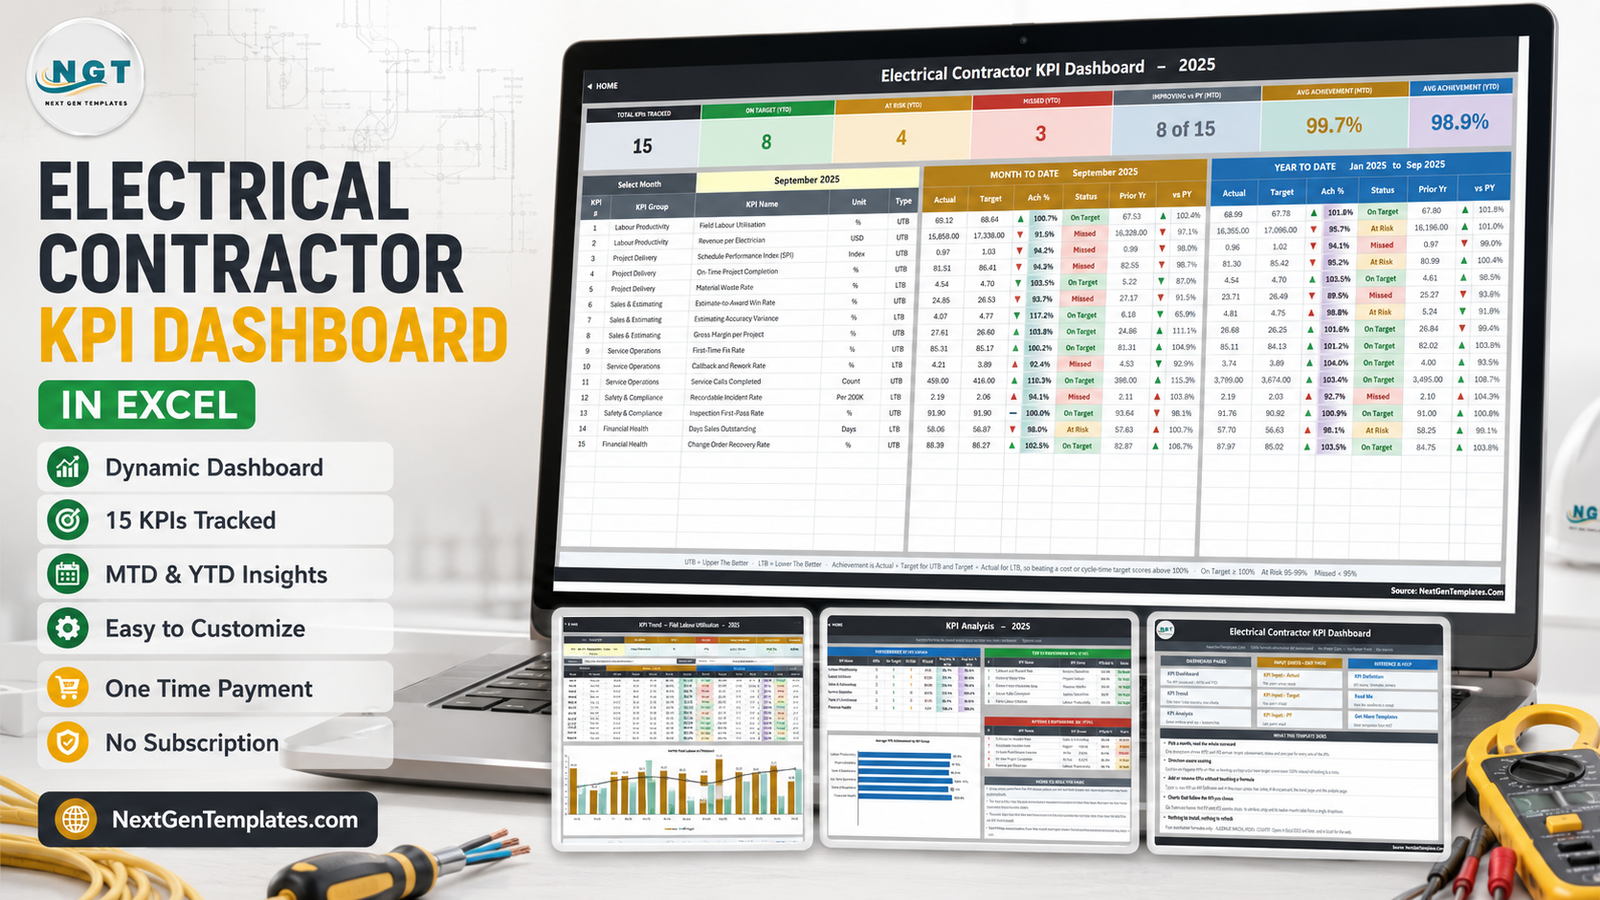
Most electrical contracting businesses already own every number they need. The job-costing package knows the margin. The service app knows the callbacks. The timesheet system knows how many paid hours actually reached a customer job. What is usually missing is the single page that puts all of it side by side, once a month, in a form an owner or a bank can read in ninety seconds. The Electrical Contractor KPI Dashboard in Excel is that page: 15 KPIs in six groups, spread across ten worksheet pages, with 24 months of sample data (2025 plus a 2024 comparison year) already loaded so you can see it working before you type anything.
It is 100% formula-driven. No macros, no Power Query, no Power Pivot, no add-ins, no data model. Plain VLOOKUP, MATCH, INDEX and COUNTIF, which means it opens in Excel 2013 and later and even in Excel for the web. It also means you can trace every cell yourself and rewrite anything you disagree with.
One thing to be clear about up front. This is a reporting workbook, not a compliance tool. It does not check the NEC, the IEC, NFPA 70E or any other electrical code. It does not track licences, permits, inspection bookings, certification expiry or apprentice hours. It is not a safety management system and it is not accounting or estimating software. Every figure in it – including the two Safety & Compliance KPIs – is a number you type in from somewhere else. A green light in this workbook proves only that the number you typed beat the target you typed.
Key Features of the Electrical Contractor KPI Dashboard in Excel
- One month dropdown drives the whole scorecard. Cell D6 on the KPI Dashboard sheet lists the twelve months of the reporting year. The scorecard and the KPI Analysis page both follow it.
- MTD and YTD side by side. For every KPI you get actual, target, achievement %, status, prior year and a year-on-year arrow – twice, once for the month and once for the year to date.
- Direction-aware achievement. Each KPI is tagged UTB (Upper The Better) or LTB (Lower The Better). Achievement is Actual ÷ Target for UTB and Target ÷ Actual for LTB, so beating a Material Waste Rate or Days Sales Outstanding target scores above 100% instead of reading as a miss.
- Editable RAG thresholds. On Target from 100%, At Risk 95-99%, Missed below 95%. They live in the formulas in columns L and U on the KPI Dashboard sheet.
- Room for 22 KPIs. 15 are filled in; seven rows are live and empty. Add one on the KPI Definition sheet and it appears everywhere with no formula work.
- Re-base the year from one cell. Cell E3 on KPI Input – Actual sets the first month of the reporting year; the Target sheet, the Prior Year sheet, the dropdown and every sheet title follow it.
- Only three sheets take typing. Actual, Target and Prior Year – one MTD and one YTD number per KPI per month.
Dashboard Pages Explanation
Home
A navigation menu split into three columns – Dashboard Pages, Input Sheets (edit these) and Reference & Help – plus a “What This Template Does” panel covering the month picker, direction-aware scoring, adding KPIs without formulas, charts that follow your KPI choice, and the fact that there is nothing to install or refresh.
KPI Dashboard – the scorecard
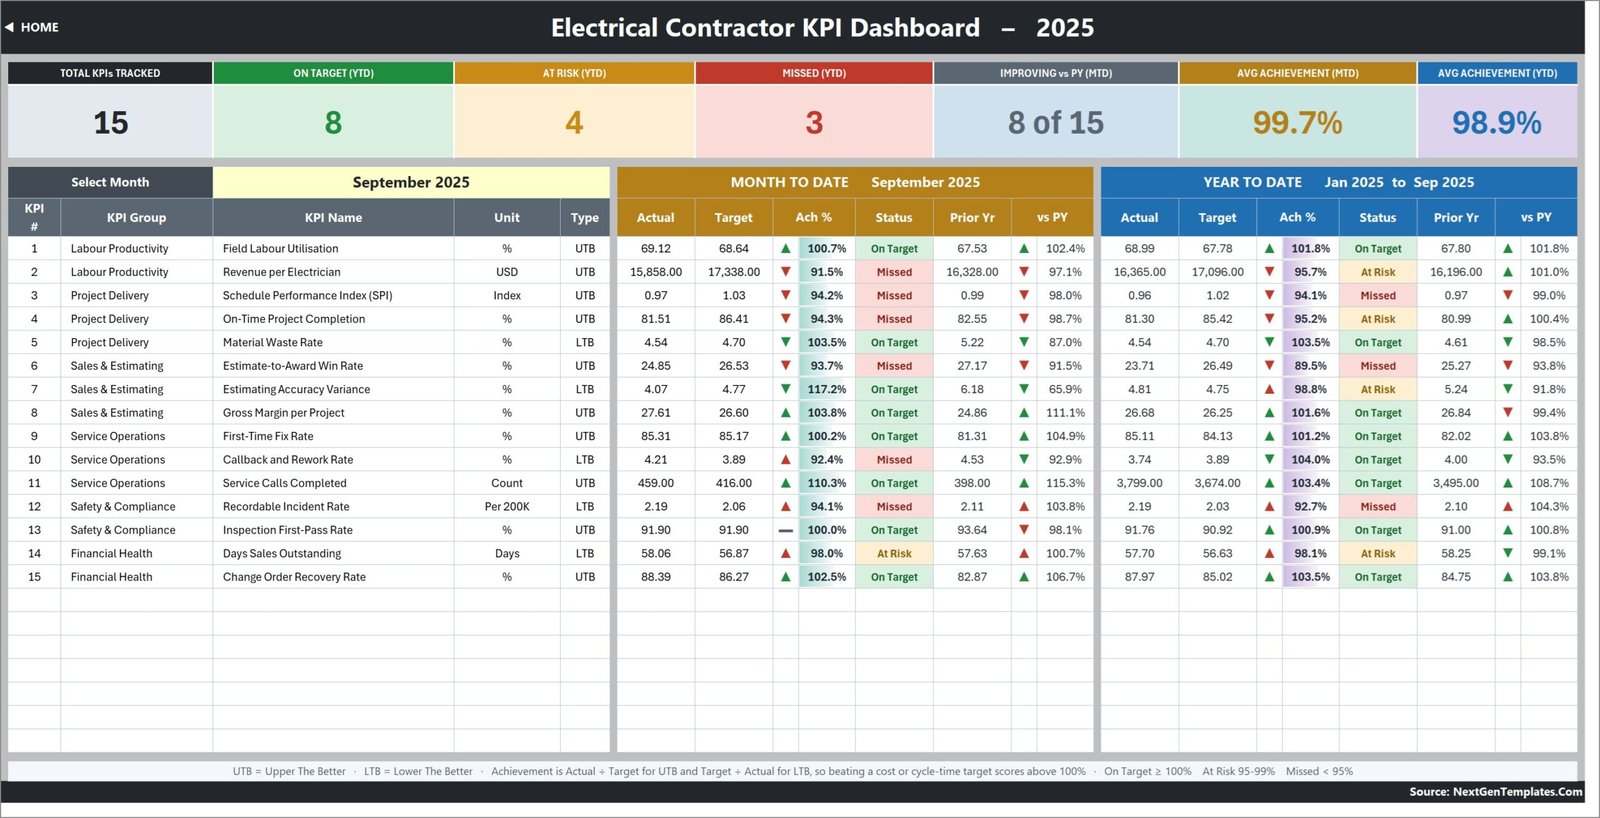
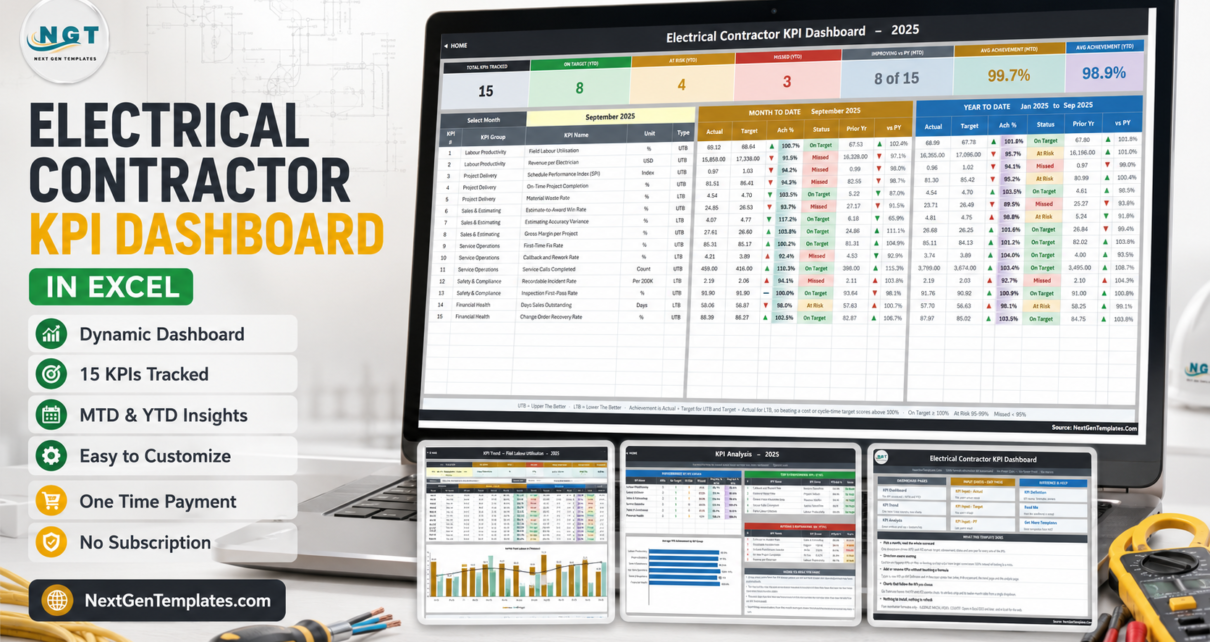
Seven summary cards across the top: Total KPIs Tracked, On Target (YTD), At Risk (YTD), Missed (YTD), Improving vs PY (MTD), Avg Achievement (MTD) and Avg Achievement (YTD). In the sample September 2025 month they read 15, 8, 4, 3, 8 of 15, 99.7% and 98.9%. Below them, one row per KPI with its group, unit and type, then the Month to Date block and the Year to Date block.
The 15 KPIs are: Labour Productivity – Field Labour Utilisation, Revenue per Electrician. Project Delivery – Schedule Performance Index (SPI), On-Time Project Completion, Material Waste Rate. Sales & Estimating – Estimate-to-Award Win Rate, Estimating Accuracy Variance, Gross Margin per Project. Service Operations – First-Time Fix Rate, Callback and Rework Rate, Service Calls Completed. Safety & Compliance – Recordable Incident Rate, Inspection First-Pass Rate. Financial Health – Days Sales Outstanding, Change Order Recovery Rate.
KPI Trend
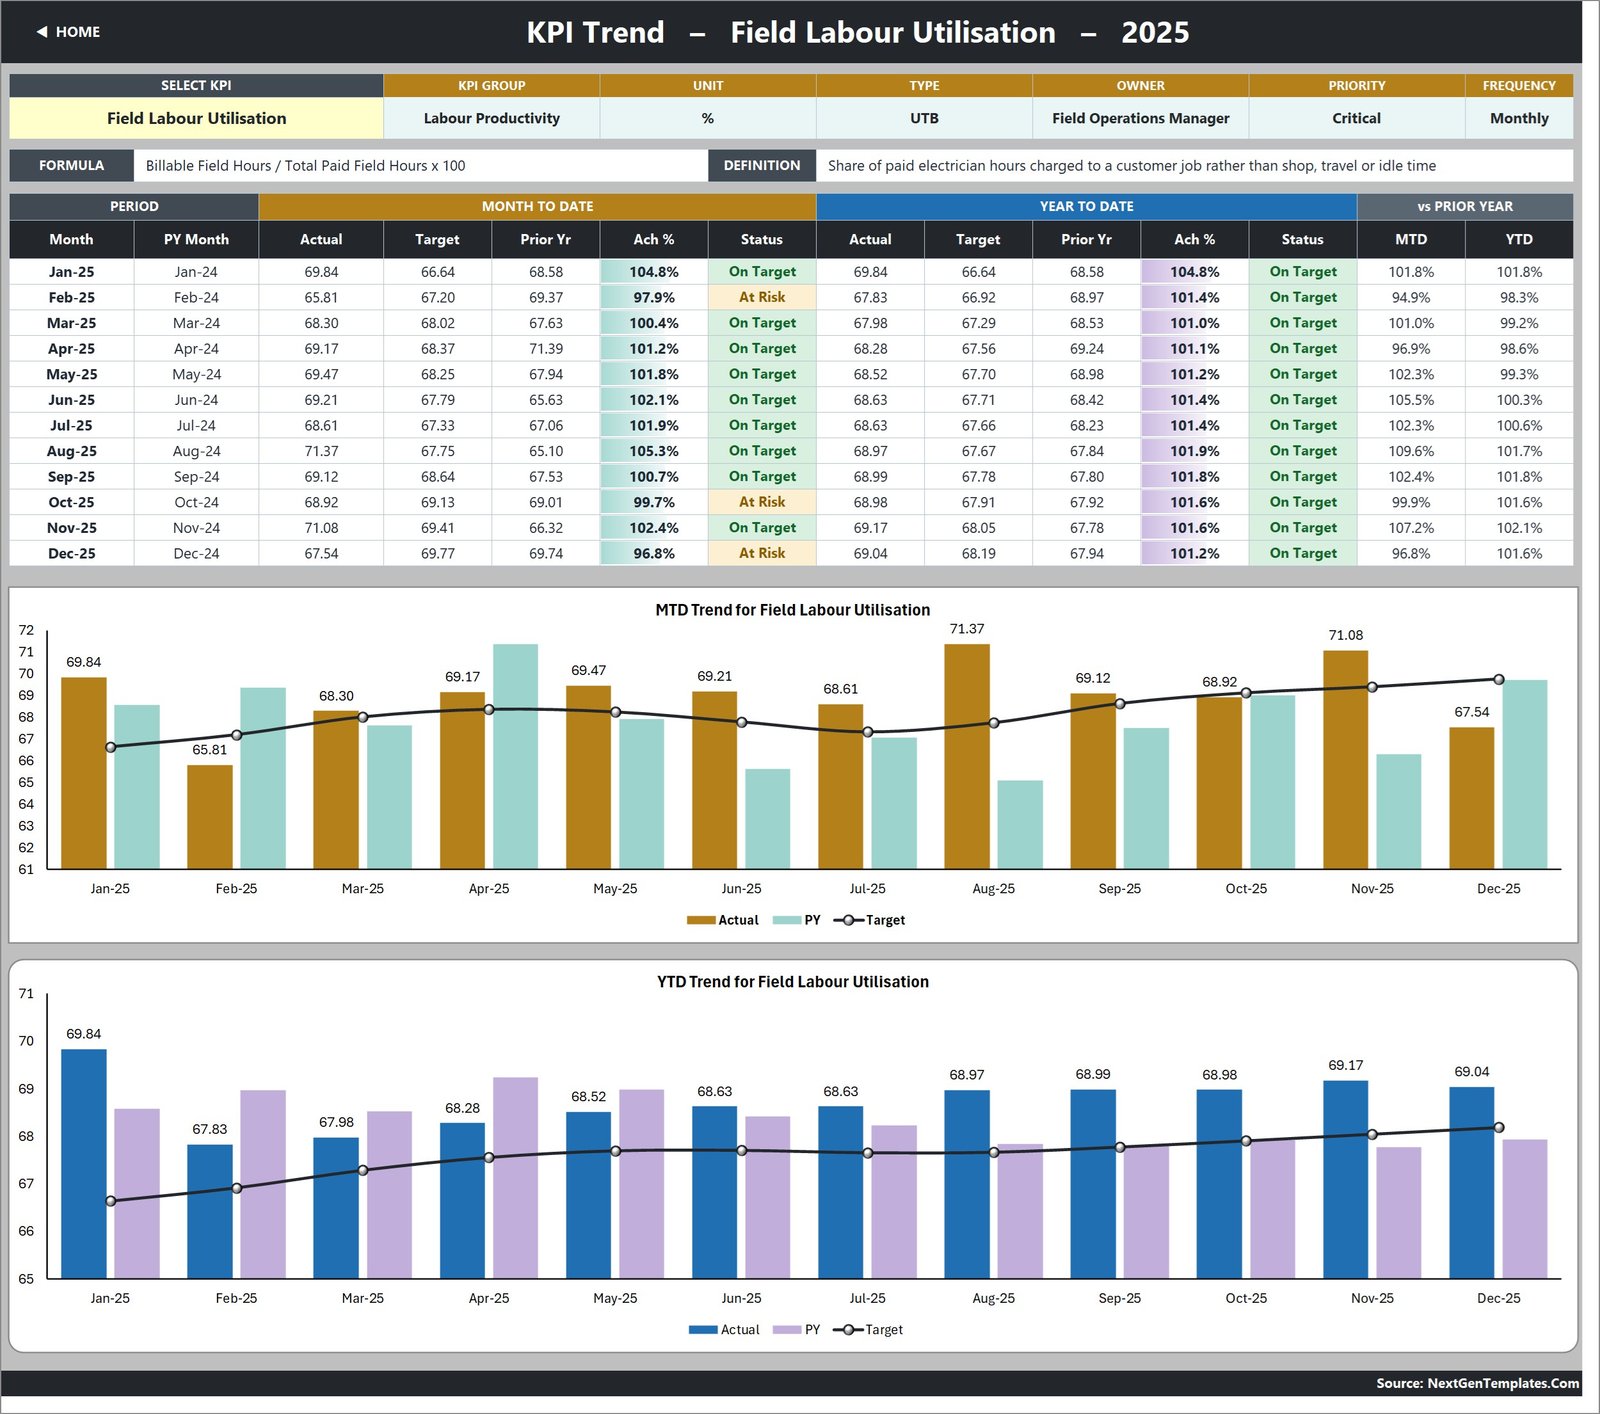
Pick a KPI in cell B4 and everything redraws: the attribute strip (group, unit, type, owner, priority, frequency), the formula and definition text, a twelve-month table with MTD and YTD actual, target, prior year, achievement and status, and two combo charts – MTD Trend and YTD Trend – each plotting actual and prior-year columns against a target line.
KPI Analysis
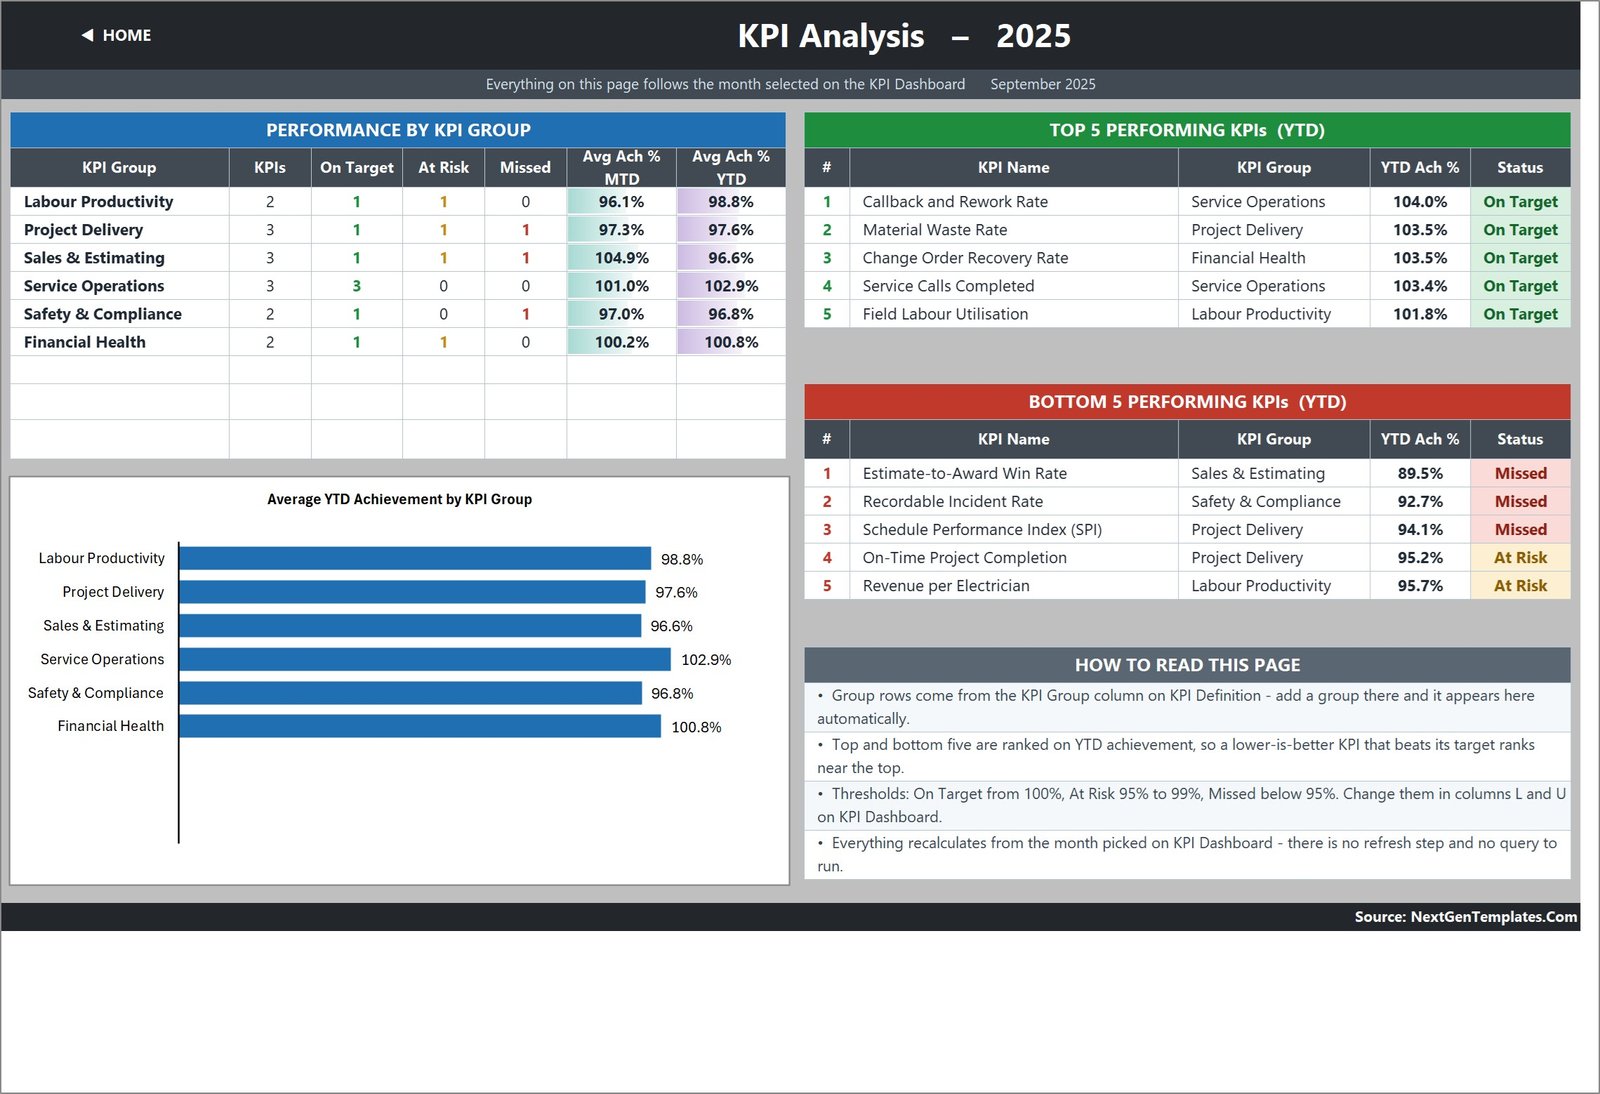
Three panels that follow the same month you picked on the scorecard. Performance by KPI Group counts On Target, At Risk and Missed per group and shows average achievement MTD and YTD. An Average YTD Achievement by KPI Group bar chart puts the six groups on one scale. Top 5 and Bottom 5 Performing KPIs rank on YTD achievement – which is why a lower-is-better KPI that beats its target can sit at the top of the list.
The three input sheets
KPI Input – Actual, KPI Input – Target and KPI Input – PY. Same 15 rows, driven by KPI Definition, with an MTD and a YTD column for each of the twelve months. The workbook deliberately does not derive YTD from MTD – you decide whether a KPI accumulates or averages.
KPI Definition, Read Me and Get More Templates
KPI Definition is the master list: number, group, name, unit, formula, definition, type, owner, priority and frequency. Rename a KPI here and every other sheet follows. Read Me is the five-minute manual. Get More Templates links out to the rest of the catalogue.
Electrical Contractor KPI Dashboard vs. Google Sheets vs. Paid Field-Service SaaS – Feature Comparison
| This Excel KPI Dashboard | Google Sheets equivalent | ServiceTitan / Procore-class SaaS | |
|---|---|---|---|
| Cost | One payment, 12.99 on sale | One payment, similar | Per-user monthly subscription |
| Platform | Excel 2013+, Excel for the web | Browser, Google account | Vendor cloud |
| Setup time | Minutes – replace the sample numbers | Minutes | Weeks, plus onboarding |
| Real-time team collaboration | Only via OneDrive / SharePoint co-authoring | Yes, natively | Yes |
| Mobile access | Excel mobile app, read-mostly | Yes | Yes, purpose-built |
| Customisable KPIs | Yes – 22 KPI rows, rename on one sheet | Yes | Vendor’s KPI set |
| Share with a link | Via your own cloud storage | Yes | Yes |
| Year-1 cost at 5 users | 12.99 total | Similar | Typically four figures |
| Pulls data from job costing | No – you type or paste monthly figures | No | Yes |
| Dispatching, timesheets, invoicing | No | No | Yes |
Who Should Use This Template
It suits an electrical contracting business of roughly 5 to 150 field electricians that already has the raw numbers and needs a monthly management page. Owners and general managers get the seven cards and the group roll-up. Service managers get First-Time Fix Rate, Callback and Rework Rate and Service Calls Completed on the same sheet as Gross Margin per Project. Controllers get Days Sales Outstanding and Change Order Recovery Rate in a format that goes straight into a lender pack.
It does not suit anyone who wants the workbook to collect data. There is no job table, no work-order list, no timesheet, no customer record and no invoice register – the input sheets hold one number per KPI per month and nothing else. It does not suit anyone who needs code compliance, licence or permit tracking, OSHA record-keeping, or live dispatching.
Real-World Use Cases
The monthly partners’ meeting. Export last month’s figures from job costing, paste them into the three input sheets, pick the month, print one page. In the sample data, Estimate-to-Award Win Rate at 89.5% YTD is the row that would start the conversation – it is the worst of the fifteen.
The Monday service huddle. Callback and Rework Rate is a lower-is-better KPI. Open KPI Trend on it, show the twelve-month MTD chart against the target line, and the discussion becomes about a shape rather than a single bad month.
The covenant pack. The Financial Health group has two KPIs and its own row on the group roll-up. That row, plus the two trend charts behind it, is usually all a lender wants to see.
Advantages of the Electrical Contractor KPI Dashboard in Excel
- Nothing to enable. No macro warning, no query refresh, no add-in prompt. It opens and it is correct.
- Fully auditable. Every figure on the scorecard is a worksheet formula you can select and trace. Nothing is hidden in a model.
- Honest about direction. Cost, waste, callback and cycle-time KPIs are scored the right way round, which is where most home-made scorecards quietly go wrong.
- Sample data that behaves. Rates and indices average across the year; volumes such as Service Calls Completed accumulate. A compliance percentage that sums to 1,100% by December is the classic sign of an invented KPI pack, and the sample data does not do it.
- Extensible without a rebuild. Seven empty KPI rows are already wired; going beyond 22 is a fill-down plus two range edits.
Opportunities for Improvement
Three things are worth knowing before you buy, because they are true of the file as it ships:
- The Home page and the Read Me both say “14 KPIs” while the workbook ships 15. Everything that calculates – the scorecard, the Total KPIs Tracked card, KPI Definition and all three input sheets – uses 15. It is a stale label in two text cells, not a maths error, and you can correct the wording in ten seconds.
- The Read Me’s “Cumulative or average YTD” note still uses examples from another industry (“aircraft deliveries, non-conformance reports”). The rule it explains is correct and applies exactly as written; only the illustration is left over from a sibling build.
- YTD is typed, not derived. That is a design choice rather than a bug, but it does mean you enter two numbers per KPI per month instead of one.
Also worth stating plainly: the Frequency column on KPI Definition is documentation, not a switch. Every KPI in the shipped file is marked Monthly and the grid is monthly throughout.
Best Practices
- Fix your KPI list before you type a single number. Rename and regroup on KPI Definition first; the input sheets inherit the names, so doing it in the other order creates rework.
- Set the UTB/LTB flag deliberately. It is the one field that changes how a KPI scores. Waste, callbacks, incident rate, DSO and estimating variance are all LTB.
- Agree the YTD rule per KPI and write it down. Rates average, volumes accumulate. Put the decision in the definition text so the next person does not re-litigate it.
- Move the thresholds to match your governance. 95% and 100% are defaults, not a standard. Edit columns L and U rather than arguing with the colours.
- Keep the sample file. Save a copy before you overwrite the demo numbers – it is the fastest reference when a formula stops looking right.
- Never let a green light stand in for evidence. Especially on the two Safety & Compliance rows. The workbook reports what you typed; your incident records live elsewhere.
Explore Relevant Templates
The same trade in a different layout: Electrical Contractor KPI Scorecard in Excel and Electrical Contractor KPI Scorecard in Google Sheets – ten KPIs on one tiled page with sparklines, rather than fifteen in a table. A Power BI edition of this scorecard is in preparation as Electrical Contractor KPI Dashboard in Power BI.
Neighbouring trades: HVAC Contractor KPI Scorecard in Excel, Plumbing Business KPI Scorecard in Excel and the forthcoming Plumbing Business KPI Dashboard in Excel. Power and utilities: Electricity Project KPI Dashboard in Excel, Power Distribution KPI Dashboard in Excel and Power Grid KPI Dashboard in Excel.
Frequently Asked Questions
Is this the same as the Electrical Contractor KPI Scorecard?
No. They are two different workbooks. This KPI Dashboard is a fifteen-row table with MTD and YTD blocks side by side, plus separate KPI Trend and KPI Analysis pages. The KPI Scorecard is a tile layout: ten KPIs, a sparkline on every tile, and an MTD/YTD toggle. Same trade, different reading experience – most buyers pick one, some own both.
Does it check electrical code compliance or track permits and licences?
No, none of that. There is no code library, no permit register, no inspection calendar and no certification tracker. It reports numbers you enter.
The Recordable Incident Rate KPI looks like safety software. Is it?
No. It is a single cell you type into each month, formatted per 200,000 field hours because that is the trade’s benchmark base. The workbook holds no injury records, builds no OSHA log and cannot validate the figure. Inspection First-Pass Rate works the same way.
Can it estimate a job or produce a bid?
No. Estimate-to-Award Win Rate and Estimating Accuracy Variance report on estimating outcomes after the fact. This is not estimating or accounting software.
Do I need Microsoft 365, macros or Power Query?
None of them. Plain worksheet formulas only, so Excel 2013 or later on Windows or Mac works, and so does Excel for the web.
How many KPIs can I add?
Seven more without any work – the sheets are wired for 22 and 15 are used. Beyond 22, fill the last data row down on each sheet and widen the summary-card ranges on KPI Dashboard row 4 and the helper columns on the Support sheet.
What exactly is in the download?
One ZIP holding the .xlsx workbook and a PDF user manual. Instant download, one payment, lifetime access to the file.
About the Author
Built by PK – Microsoft Certified Professional with 15+ years of Excel, Google Sheets, and Power BI experience. Founder of NextGenTemplates, reaching 300K+ subscribers across YouTube channels. Every template is hand-built and tested before release.
Conclusion
The Electrical Contractor KPI Dashboard in Excel does one job properly: it turns fifteen numbers you already have into a monthly management page that reads in ninety seconds, with the direction of every KPI scored the right way round and the whole thing built out of formulas you can see. It will not run your jobs, price your bids or keep your compliance records – and it says so on the tin. If what you need is the page, this is the page.
Get the Electrical Contractor KPI Dashboard in Excel →
For video walkthroughs of this and other Excel dashboards, subscribe to youtube.com/@PKAnExcelExpert.