Employment Law Services Dashboard in Power BI gives employment lawyers, HR compliance consultants, labor relations advisors, legal operations teams, and practice managers a ready PBIX report for tracking Total Fees Billed, Total Cases, Total Case Value, Closed Cases, Total Billable Hours, case stages, practice areas, client types, outcomes, priorities, regions, and closure days. Employment law teams often manage hundreds of matters across advisory, disputes, compliance, investigations, and settlement workflows; without a clean reporting layer, case data and billing signals stay scattered across spreadsheets, billing exports, and case lists.
This Power BI dashboard turns those structured records into 5 report pages with KPI cards, slicers, and visual analysis. You can open the PBIX file in Power BI Desktop, replace the sample data or connect your own source, and refresh the dashboard. For official guidance on Power BI Desktop workflows, see Microsoft Learn: Get started with Power BI Desktop.
View the Employment Law Services Dashboard in Power BI on NextGenTemplates.
Key Features of Employment Law Services Dashboard in Power BI
- 5 Power BI report pages covering Overview, Case Pipeline, Practice Areas, Consultant View, and Revenue Review.
- 5 headline KPI cards for Total Fees Billed, Total Cases, Total Case Value, Closed Cases, and Total Billable Hours.
- Interactive slicers for quickly filtering the report by available case, time, client, region, priority, stage, and practice-area fields.
- Case pipeline reporting by month, year, priority, stage, billable hours, and fees billed.
- Practice-area analysis by client type, region, and case outcome.
- Consultant and revenue review for closure days, case value, fees billed, closure rate, and stage performance.
- Editable PBIX file that can be customized in Power BI Desktop.
Dashboard Pages Explanation
1. Overview Page
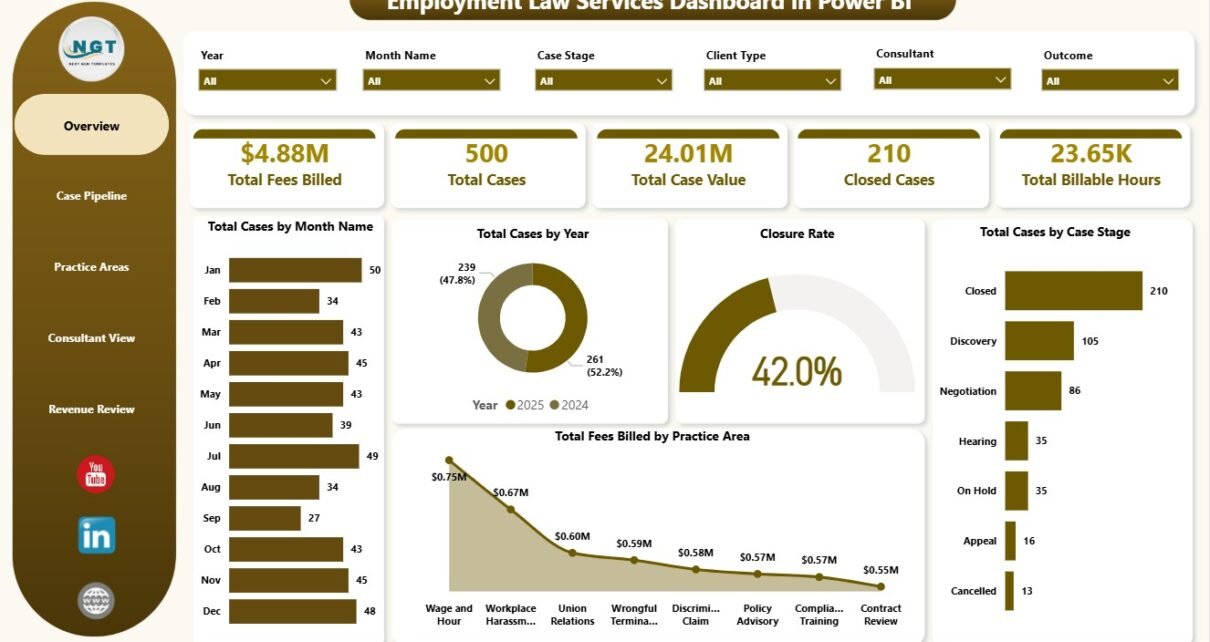
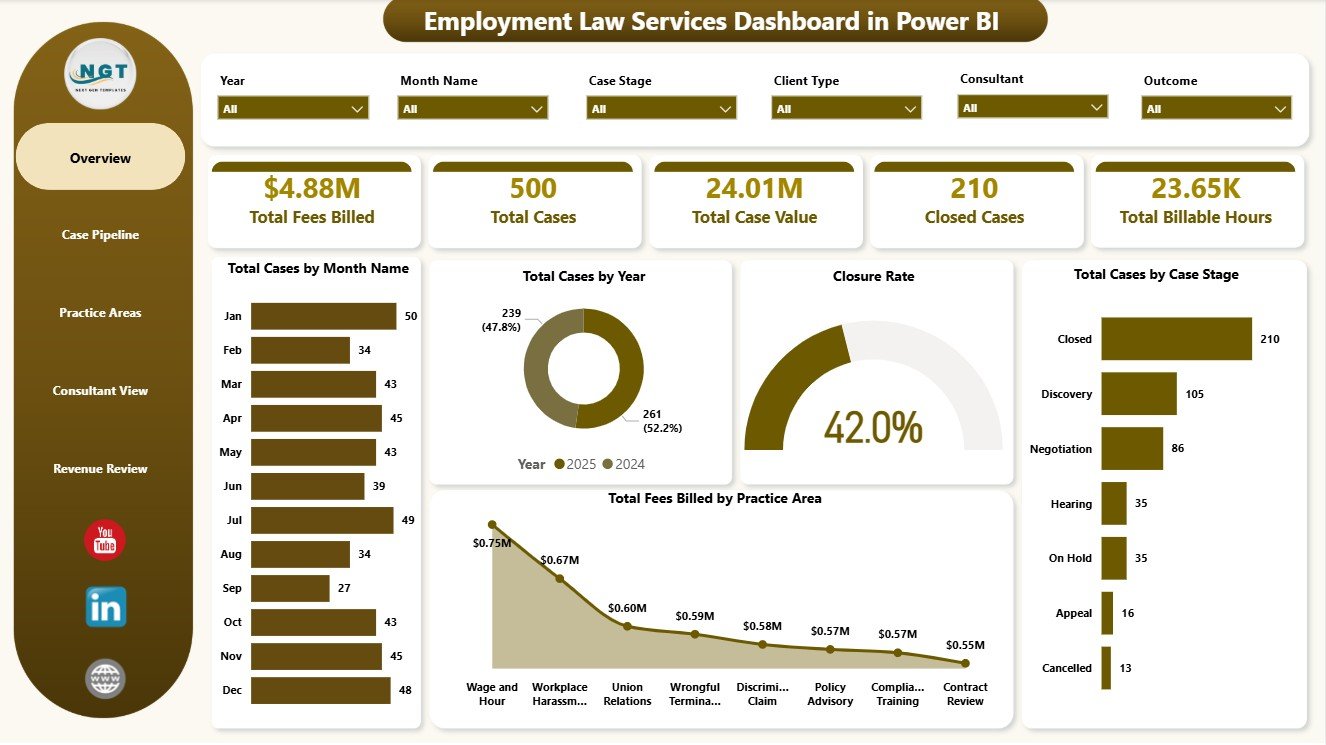
The Overview Page is the executive summary of the dashboard. At the top, KPI cards show Total Fees Billed, Total Cases, Total Case Value, Closed Cases, and Total Billable Hours so partners and managers can understand billing, workload, case value, closure activity, and effort from a single screen.
Total Cases by Month Name: This chart shows how employment law case volume changes month by month. It helps managers identify intake spikes, slower periods, and seasonal workload patterns.
Total Cases by Year: This visual compares annual case volume. It helps leadership see whether the employment law practice is growing, stable, or declining over time.
Closure Rate: This chart shows how effectively cases are being moved to closure. A declining closure rate can point to backlog, staffing gaps, or workflow delays.
Total Cases by Case Stage: This chart breaks matters by stage so teams can see where work is concentrated. It is useful for finding bottlenecks in intake, review, negotiation, litigation, or closing stages.
Total Fees Billed by Practice Area: This visual compares billed fees across practice areas. It helps partners identify which employment law services contribute the most revenue.
2. Case Pipeline
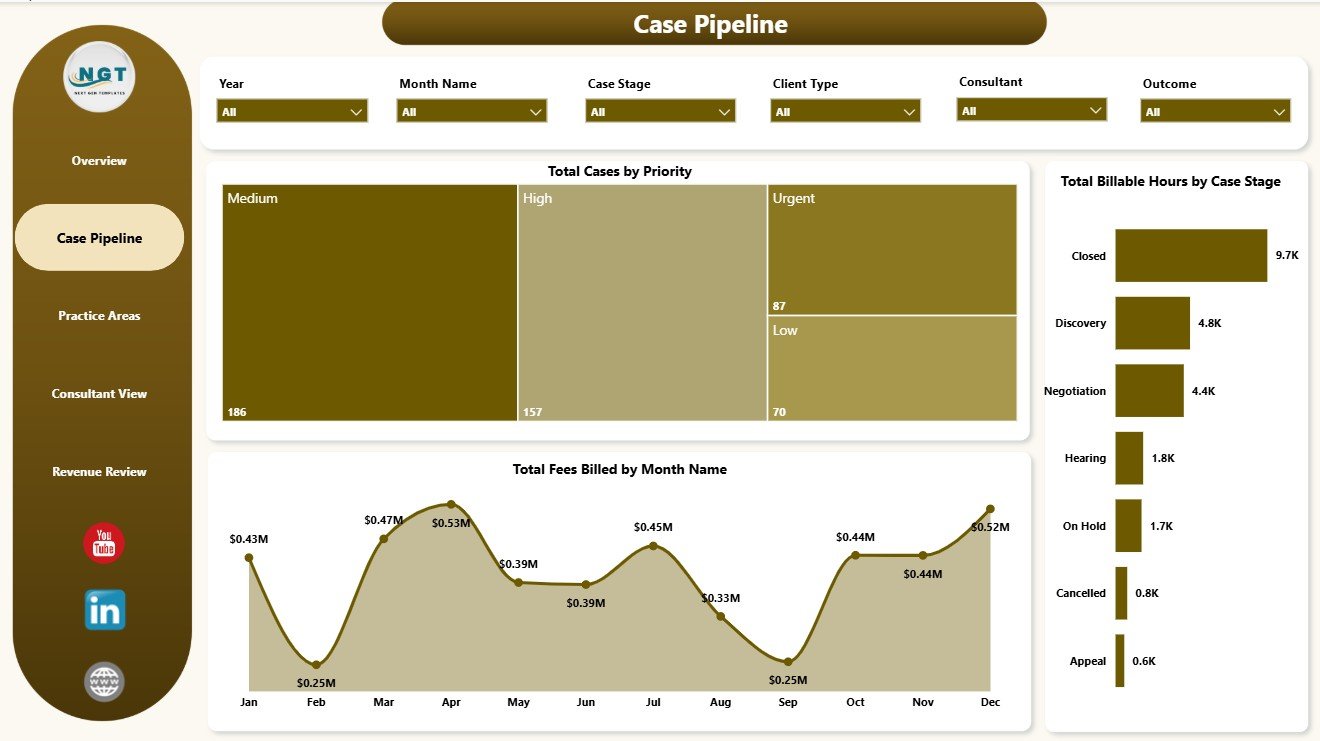
The Case Pipeline page focuses on active workload and billing movement. Total Cases by Priority shows how many matters need urgent attention, which helps the team prioritize case handling. Total Billable Hours by Case Stage reveals where the legal team spends the most time, making stage-level workload easier to discuss.
Total Fees Billed by Month Name tracks billing momentum across the year. Together, these visuals help employment law leaders review urgent matters, effort distribution, and monthly revenue movement without manually rebuilding reports.
3. Practice Areas
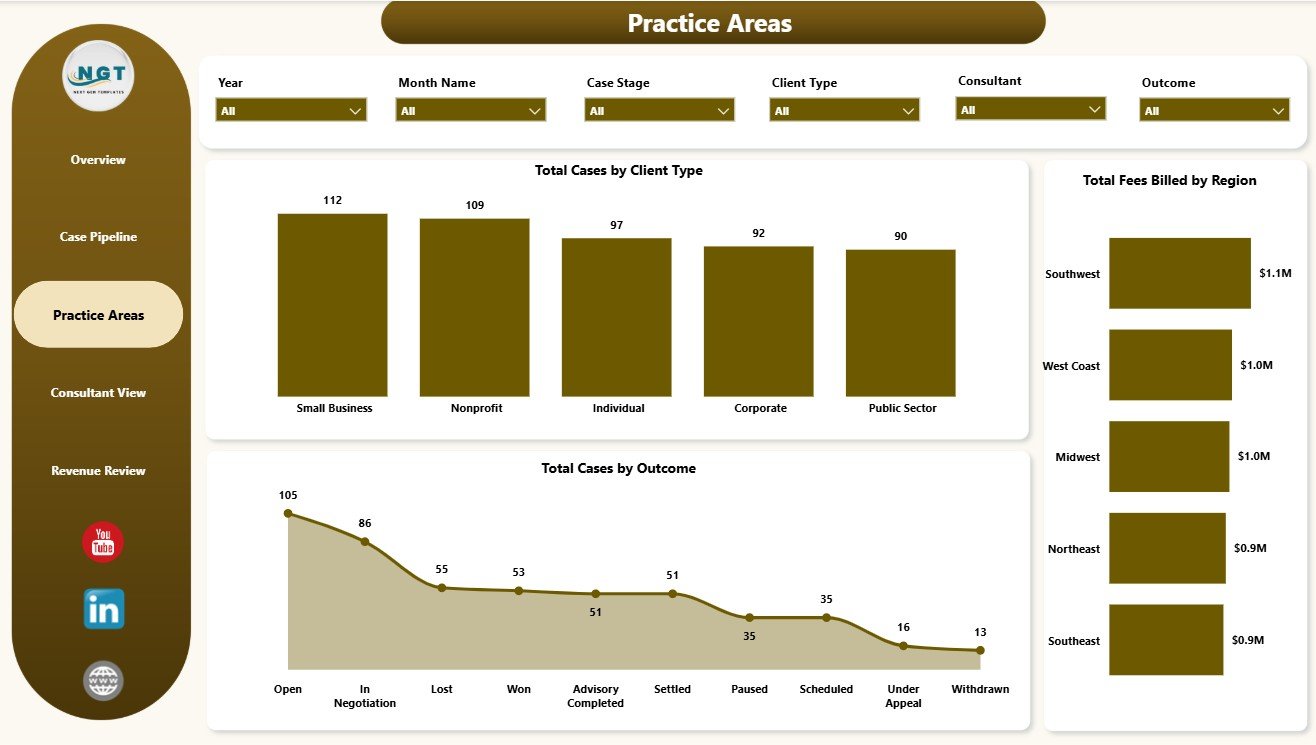
The Practice Areas page reviews the service mix from client, region, and outcome angles. Total Cases by Client Type shows whether work is concentrated among employers, employees, corporate clients, unions, or other client groups. Total Fees Billed by Region compares regional fee contribution and helps identify stronger service locations.
Total Cases by Outcome shows how matters are resolved. This is useful for practice reviews, service planning, and understanding whether certain client or case groups produce different resolution patterns.
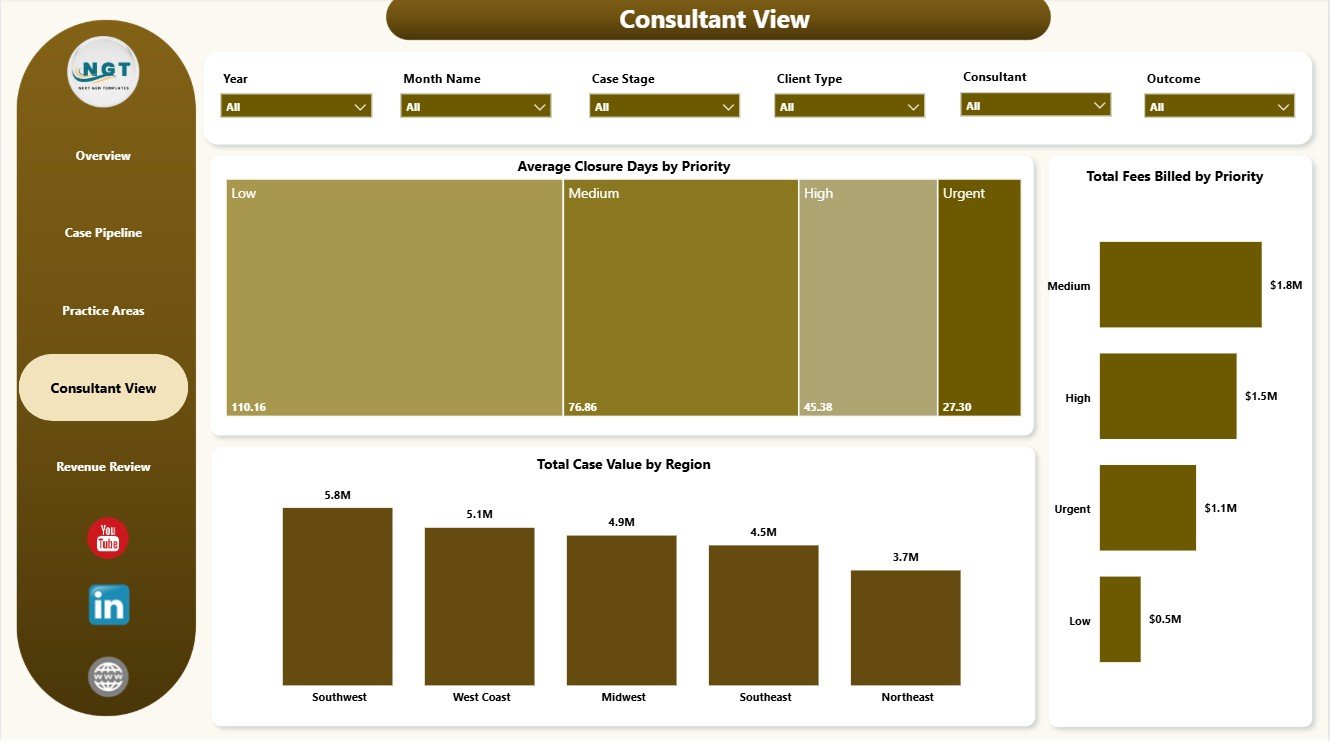
4. Consultant View
The Consultant View page helps managers review turnaround time and commercial value. Average Closure Days by Priority shows whether high-priority cases are closing faster than lower-priority matters. Total Case Value by Region compares regional case value so leaders can understand where higher-value matters are concentrated.
Total Fees Billed by Priority connects billing with case urgency. This gives partners and consultants a clearer view of whether urgent matters are also driving meaningful revenue.
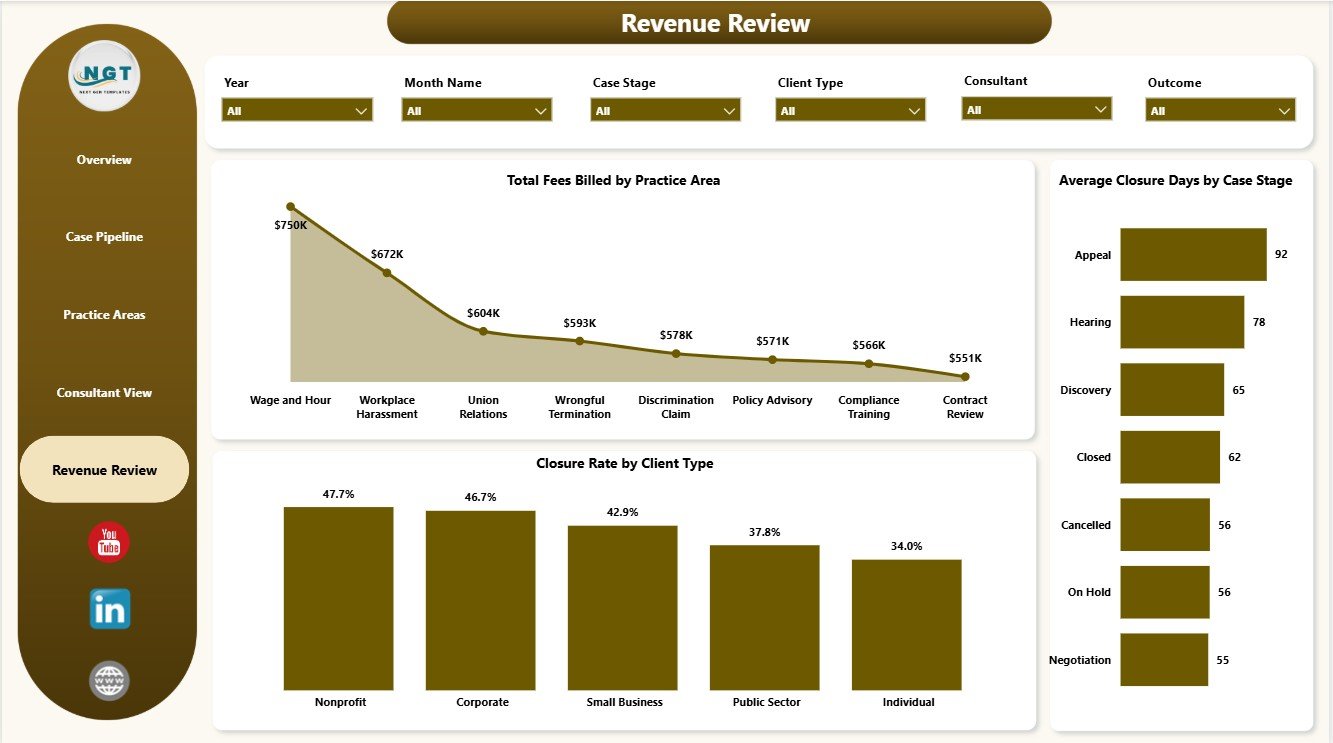
5. Revenue Review
The Revenue Review page is built for partners, finance reviewers, and practice managers. Total Fees Billed by Practice Area shows which services create the strongest billing contribution. Closure Rate by Client Type compares completion progress across client groups and can reveal where cases need more attention.
Average Closure Days by Case Stage highlights stage-level delay. When one stage takes much longer than others, leaders can review process gaps, staffing, or case complexity before delays become normal.
Employment Law Services Dashboard in Power BI vs. Tableau vs. Paid Legal CRM/SaaS – Feature Comparison
| Feature | Employment Law Services Dashboard in Power BI | Tableau Alternative | Paid Legal CRM/SaaS |
|---|---|---|---|
| Cost | $17.99 one-time | Requires Tableau licensing or custom build time | Monthly or annual subscription |
| Platform | Power BI Desktop / Power BI Service | Tableau Desktop / Tableau Cloud | Vendor cloud platform |
| Setup time | Open PBIX, connect data, refresh | Build model and visuals manually | Onboarding and configuration required |
| Real-time team collaboration | Available through Power BI Service depending on licensing | Available through Tableau Cloud | Usually included by user seat |
| Mobile access | Power BI mobile app or shared report | Tableau mobile or browser | Vendor app or browser |
| Customizable fields | Editable model, visuals, measures, and pages | Editable with Tableau skills | Limited by vendor settings |
| Employment law analytics | Built around cases, fees, value, hours, stages, priorities, outcomes, and closure | Requires custom design | May require higher-tier reporting |
| Year-1 cost at 5 users | $17.99 plus Microsoft licensing if needed | Usually much higher | Often hundreds or thousands |
Who Should Use This Template
This template is best for employment law firms, HR compliance consultants, labor relations advisors, in-house legal operations teams, legal service coordinators, and practice managers who already track structured case data and want an editable Power BI reporting layer.
It is not meant to replace a legal matter management platform. If your team needs conflict checks, trust accounting, legal billing automation, document management, secure client portals, court filing workflows, or e-signature automation, you will still need dedicated legal software.
Real-World Use Cases
Anita, employment law partner: Anita reviews Total Fees Billed, Total Case Value, Closed Cases, and Closure Rate before monthly partner meetings so financial and operational discussions stay tied to actual case data.
Marcus, HR compliance consultant: Marcus filters the Practice Areas page by client type and region to understand which service lines are growing and which clients need more support.
Priya, practice coordinator: Priya checks Average Closure Days by Priority and Total Cases by Case Stage to follow up on urgent matters and reduce process delays.
Advantages of Employment Law Services Dashboard in Power BI
- Uses a familiar Microsoft BI workflow for analysts and reporting teams.
- Includes multiple report pages instead of a single flat summary.
- Connects operational case analysis with billing and value metrics.
- Provides slicers for faster filtering during review meetings.
- Can be customized in Power BI Desktop for internal fields, colors, or measures.
- Works as a lightweight analytics layer without buying a full legal SaaS system.
Opportunities for Improvement
Larger legal teams may want to connect the dashboard to a central case database, billing export, SharePoint list, SQL database, or Microsoft Fabric workspace. Teams can also add consultant-level targets, year-over-year fee comparison, matter aging bands, realization rate calculations, or row-level security if the report is shared through Power BI Service.
Best Practices
- Keep consistent names for case stages, priorities, outcomes, regions, and practice areas.
- Review the Overview Page first, then move into pipeline and revenue pages for detail.
- Validate Total Fees Billed and Total Billable Hours after every data refresh.
- Use slicers during review meetings instead of exporting multiple static reports.
- Back up the PBIX before editing measures, relationships, or Power Query steps.
- Protect sensitive case data before publishing any report to Power BI Service.
Explore Relevant Templates
Explore the Employment Law Services Dashboard in Power BI product page, or compare it with the Employment Law Services Dashboard in Excel. Related legal analytics templates include Cyber Law Advisory Dashboard in Power BI and Cyber Law Advisory Dashboard in Excel. You can also browse more Power BI dashboard templates.
Frequently Asked Questions
What does the Employment Law Services Dashboard in Power BI track?
It tracks fees billed, total cases, case value, closed cases, billable hours, month, year, closure rate, case stage, practice area, priority, client type, region, outcome, and closure days.
How many pages are included?
The report includes 5 pages: Overview, Case Pipeline, Practice Areas, Consultant View, and Revenue Review.
Can I use my own employment law data?
Yes. Replace the sample source or connect Power BI to your own structured case data, then refresh the report.
Do I need Power BI Desktop?
Yes. You need Power BI Desktop to open and edit the PBIX file. Sharing through Power BI Service may require Microsoft licensing.
Can I customize the dashboard?
Yes. You can edit visuals, pages, colors, fields, Power Query steps, relationships, and DAX measures.
Does this replace legal software?
No. This is an analytics dashboard, not a legal CRM, billing system, document platform, or client portal.
About the Author
Built by PK – Microsoft Certified Professional with 15+ years of Excel, Google Sheets, and Power BI experience. Founder of NextGenTemplates, reaching 300K+ subscribers across YouTube channels. Every template is hand-built and tested before release.
Conclusion
The Employment Law Services Dashboard in Power BI is a practical reporting template for legal teams that want clearer visibility into cases, fees, case value, stages, priorities, outcomes, and closure performance. It gives partners, consultants, and practice managers a structured way to review employment law service performance without starting a Power BI model from scratch.
Visit YouTube.com/@PKAnExcelExpert for more Excel and Power BI tutorials.

