Most compliance teams end up owning a stack of tools long before they own a way to report on it. A policy manager here, a vendor-risk platform there, an audit-automation tool a predecessor bought, and a privacy tool that arrived with a data-protection hire. The renewal dates are scattered, the seat counts are stale, and when finance asks what the stack costs and what it is delivering, the answer is a scramble through invoices and four separate admin consoles.
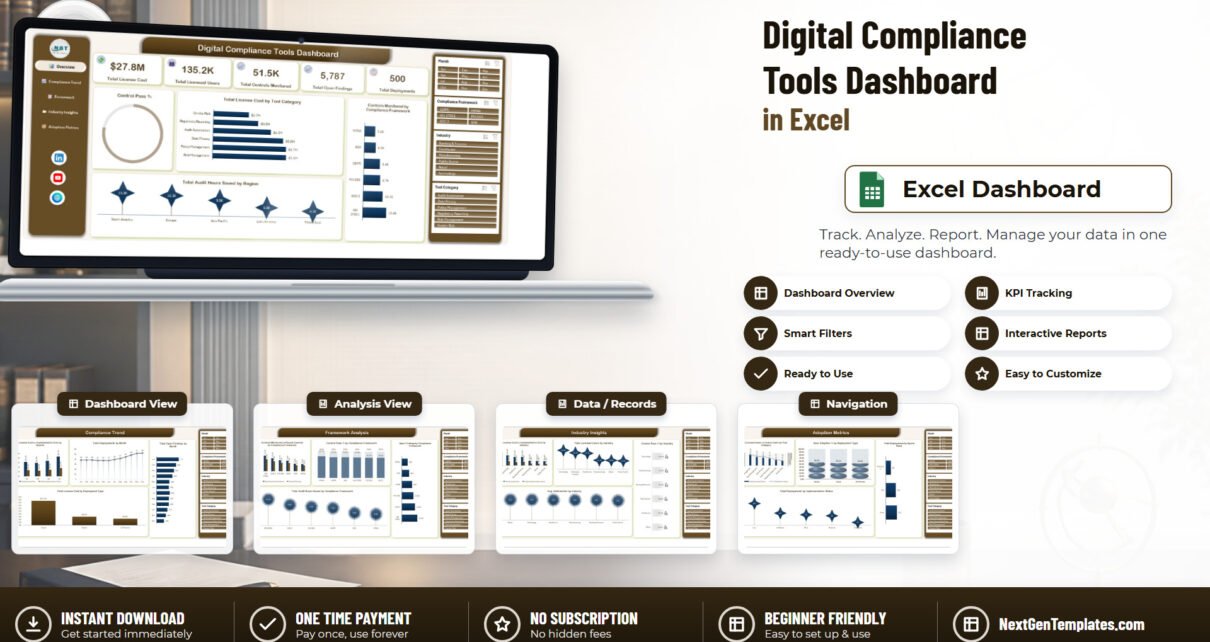
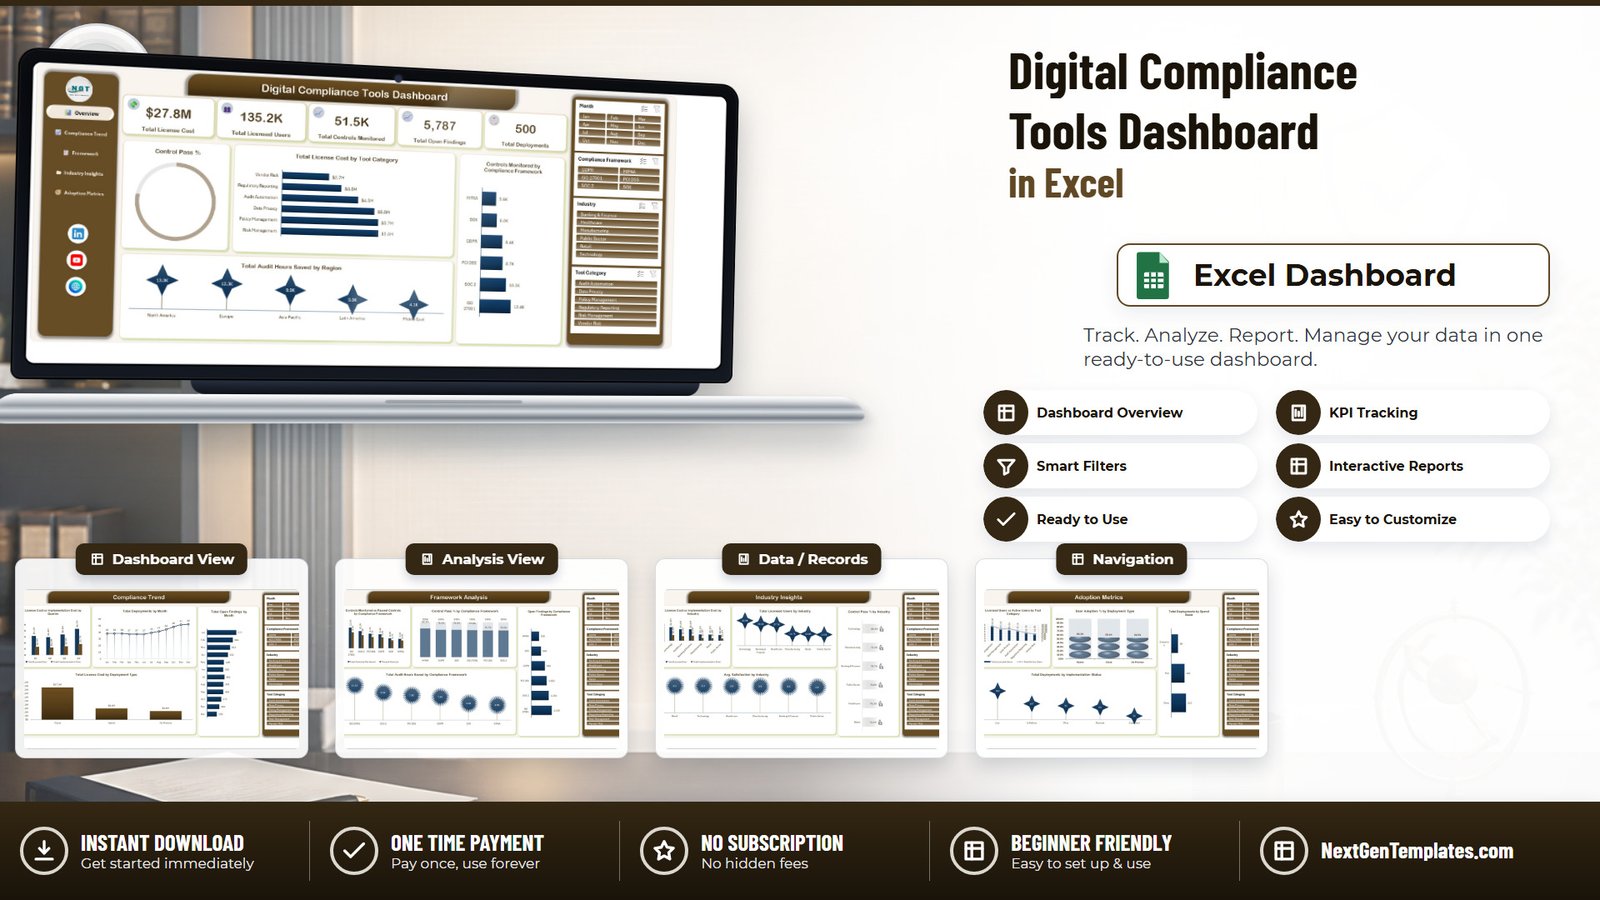
The Digital Compliance Tools Dashboard in Excel is a reporting layer for exactly that problem. It is a single .xlsx workbook with five linked report pages, 20 charts, 25 background pivot tables and four shared slicers, all driven by one Excel Table of 500 sample deployment records across 28 columns. Paste your own register over the sample rows, press Refresh All, and the five pages redraw against your numbers.
One thing to be clear about before anything else. This is an offline analytics workbook. It is not a GRC platform and not an audit system of record. It does not connect to any compliance tool, ticketing system, evidence repository, cloud account or regulator feed, and using it does not make an organisation compliant with SOC 2, ISO 27001, GDPR, HIPAA, PCI DSS, SOX or any other framework. Those names appear in the shipped file purely as sample category labels you can filter by. Every figure in the screenshots below is fictional sample data.
Key Features of the Digital Compliance Tools Dashboard in Excel
- Five report pages from one dataset – Overview, Compliance Trend, Framework Analysis, Industry Insights and Adoption Metrics, each with four charts.
- Four slicers shared across every page – Month, Compliance Framework, Industry and Tool Category. One click filters all 20 charts.
- Five KPI cards on the Overview: Total License Cost, Total Licensed Users, Total Controls Monitored, Total Open Findings and Total Deployments.
- Control Pass % is calculated, not typed – controls passed over controls monitored, shown as a donut and then broken out by framework and by industry.
- Licence cost and implementation cost kept separate – paired columns by quarter and by industry, so a cheap licence with an expensive rollout cannot hide.
- Adoption measured against seats – Licensed Users versus Active Users by tool category, plus an adoption rate by deployment type.
- A plain .xlsx – no macros, no add-ins, no Power Query, no security prompt.
- An unlocked Support sheet holding all 25 pivots, if you want to build a sixth page from the same cache.
Dashboard Pages Explanation
1. Overview
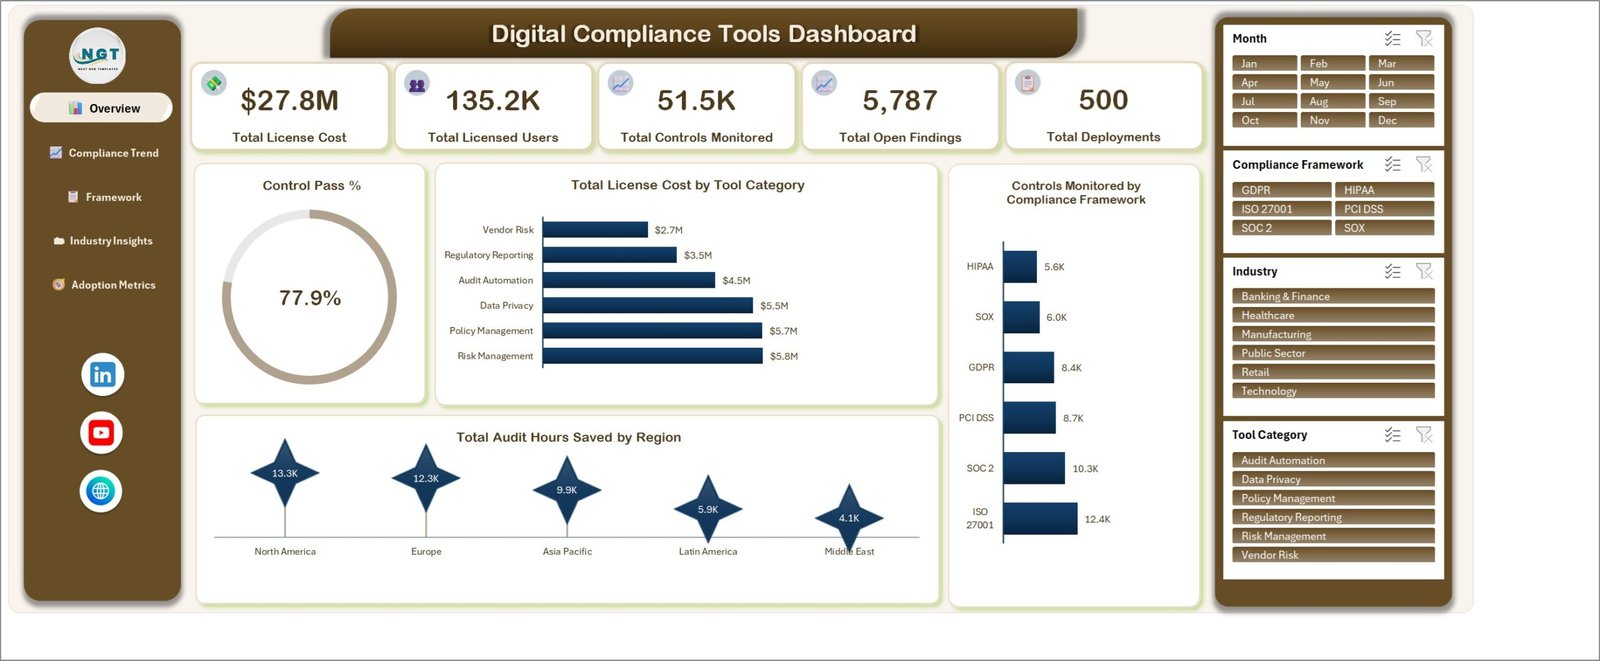
Five KPI cards run across the top – in the sample data, $27.8M of licence cost, 135.2K licensed users, 51.5K controls monitored, 5,787 open findings and 500 deployments. Below them, a Control Pass % donut reads 77.9%, Total License Cost by Tool Category ranks the six categories (Risk Management highest at $5.8M, Vendor Risk lowest at $2.7M), Controls Monitored by Compliance Framework puts ISO 27001 on top at 12.4K, and Total Audit Hours Saved by Region runs from North America at 13.3K down to the Middle East at 4.1K.
2. Compliance Trend
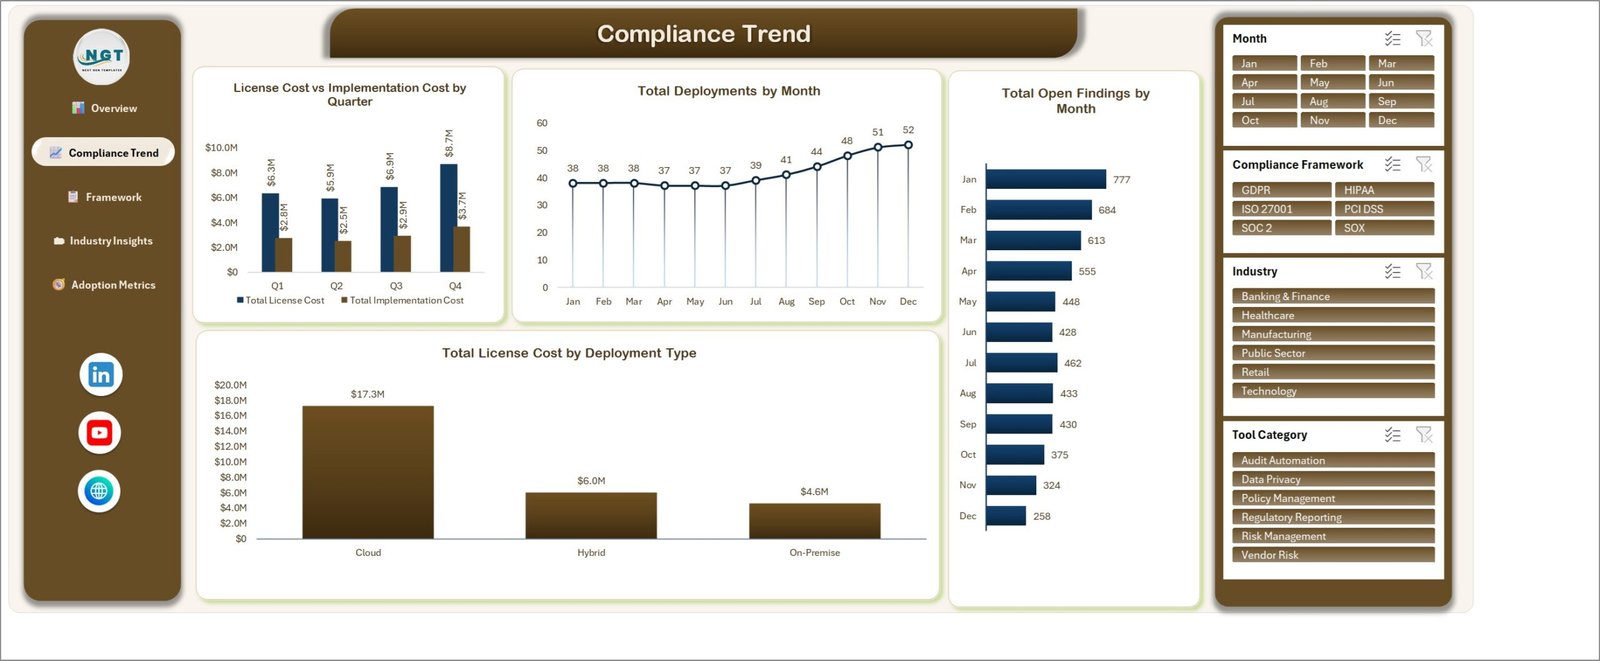
This is the time view. License Cost vs Implementation Cost by Quarter pairs the two spend types (Q4 is the heaviest quarter in the sample at $8.7M against $3.7M), Total Deployments by Month climbs from 38 in January to 52 in December, and Total Open Findings by Month falls the other way, from 777 in January to 258 in December. The fourth chart, Total License Cost by Deployment Type, shows Cloud carrying $17.3M against Hybrid at $6.0M and On-Premise at $4.6M.
3. Framework Analysis
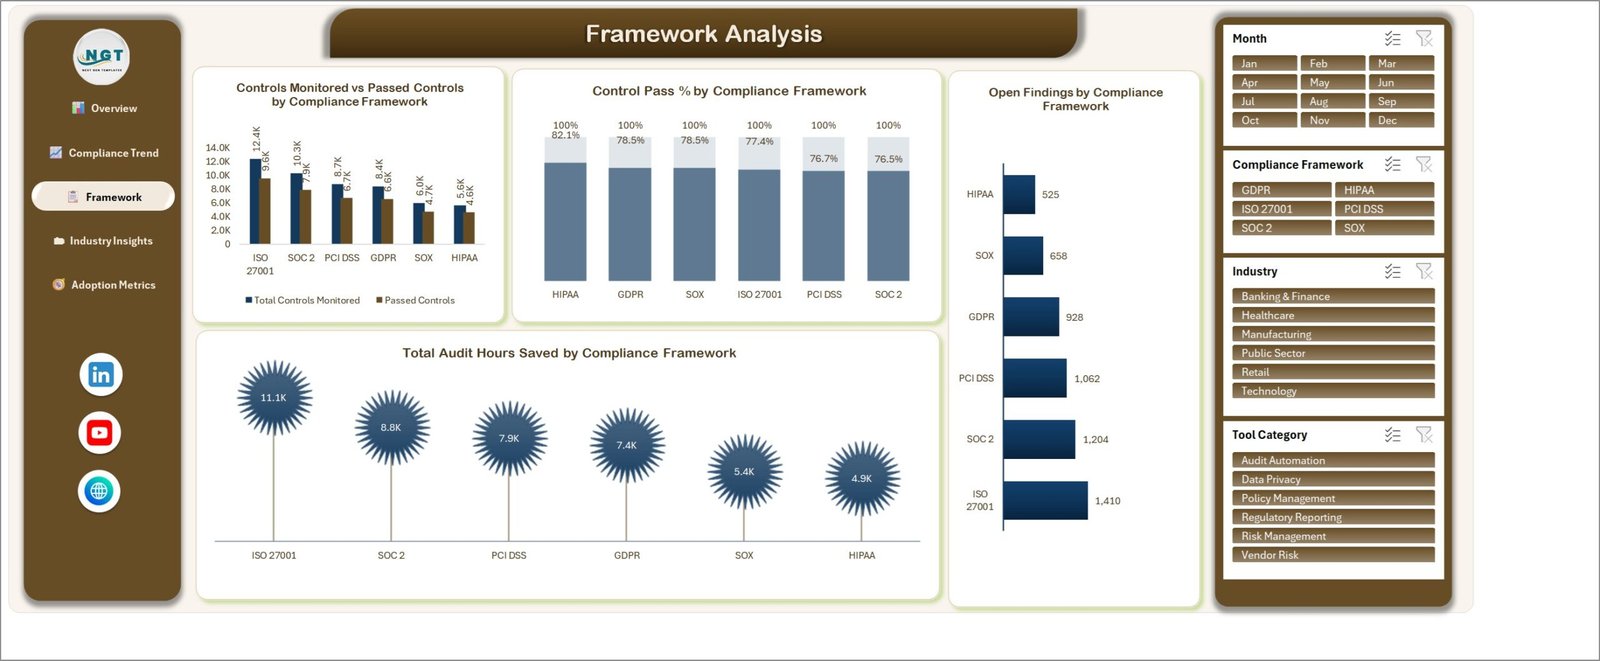
Four views of the same six framework labels. Controls Monitored vs Passed Controls by Compliance Framework puts the raw counts side by side, Control Pass % by Compliance Framework converts them to a rate (82.1% at the top down to 76.5% at the bottom in the sample – a narrow band, which is itself the finding), Open Findings by Compliance Framework ranks the backlog, and Total Audit Hours Saved by Compliance Framework shows where the automation is actually paying back. Read the last two together: the framework with the most open findings in the sample is also the one saving the most audit hours, which is what heavy coverage looks like.
4. Industry Insights
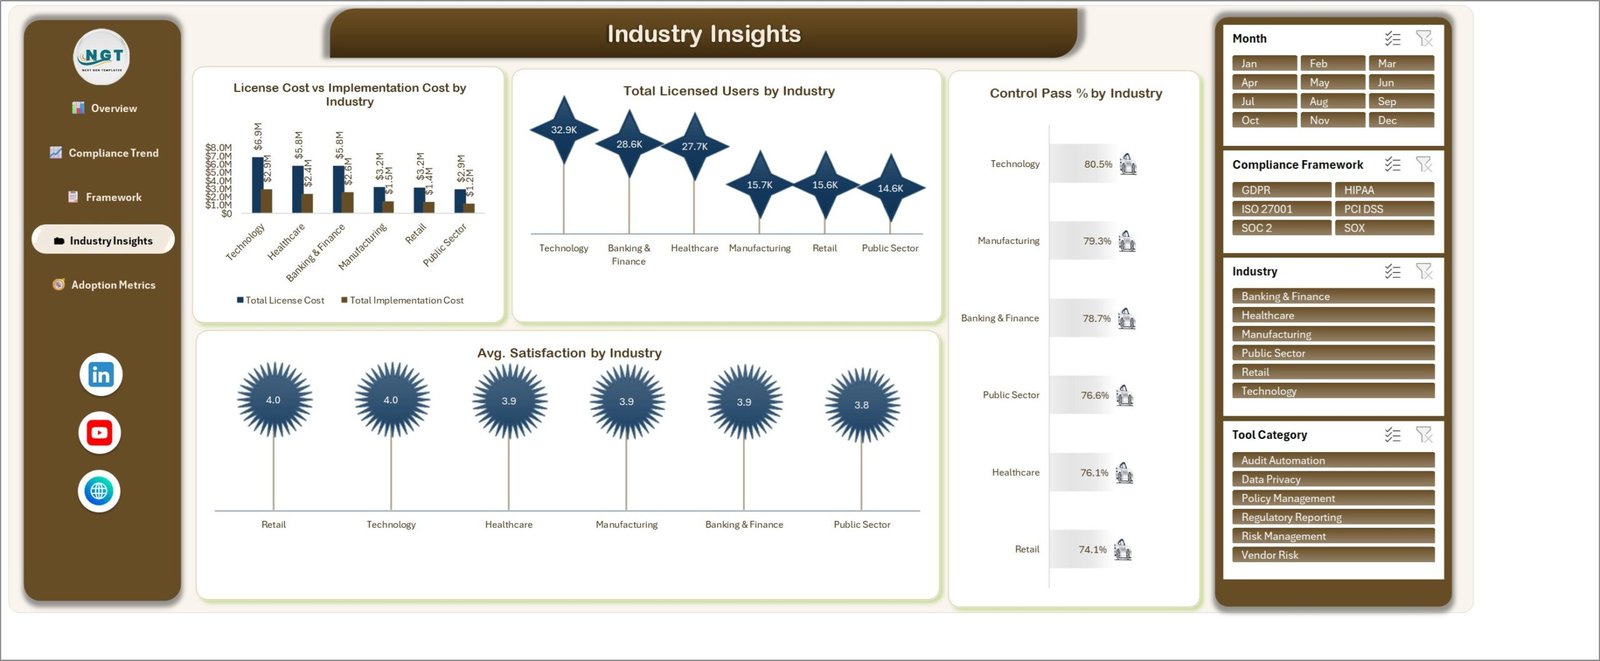
Useful if you report across business units or, as a consultant, across clients. License Cost vs Implementation Cost by Industry, Total Licensed Users by Industry (Technology leads at 32.9K in the sample), Control Pass % by Industry ranked from 80.5% down to 74.1%, and Avg. Satisfaction by Industry on the 1-5 score carried in the data. Satisfaction is the softest number on the dashboard and it is worth treating as a conversation starter rather than a metric.
5. Adoption Metrics
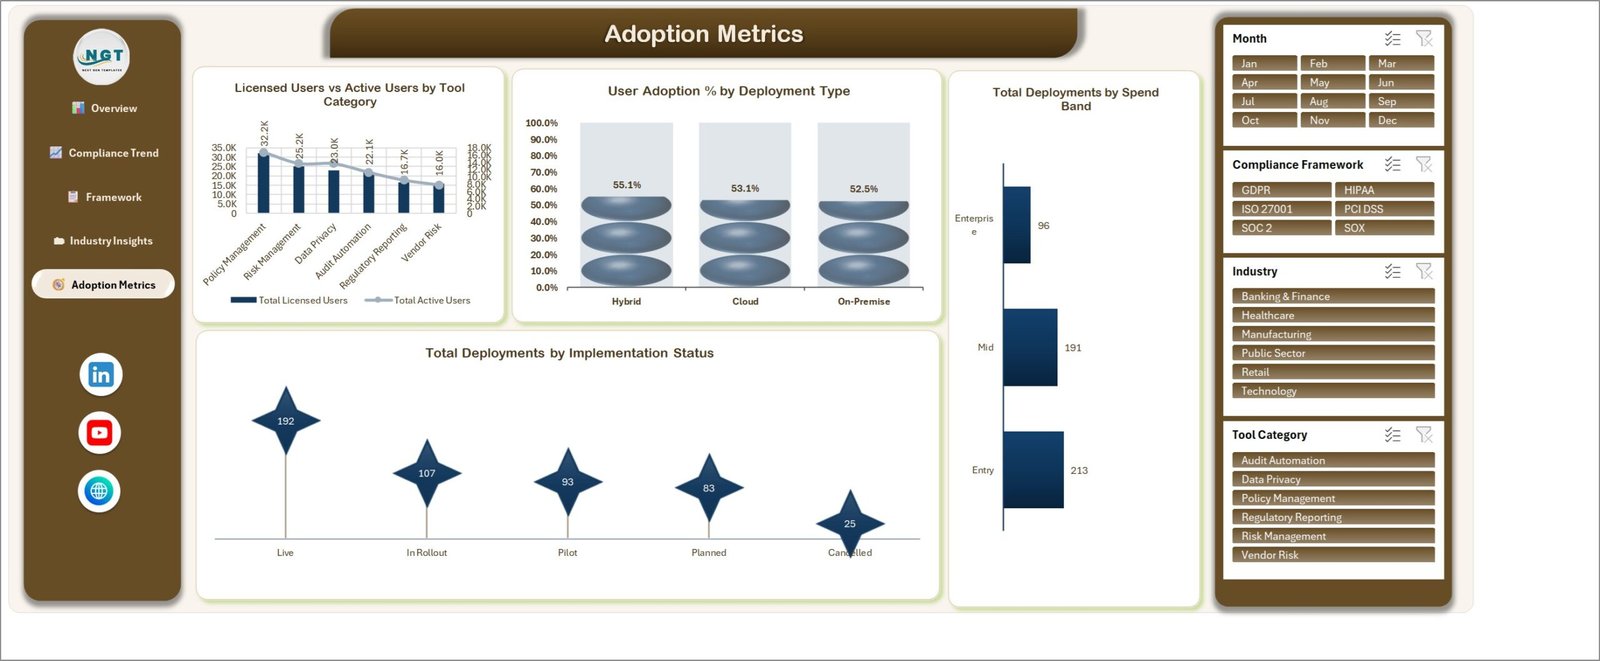
The page that pays for the workbook. Licensed Users vs Active Users by Tool Category is the seat-waste chart; User Adoption % by Deployment Type compares Hybrid, Cloud and On-Premise (55.1%, 53.1% and 52.5% in the sample – close enough that deployment model is clearly not the driver); Total Deployments by Spend Band splits Entry, Mid and Enterprise; and Total Deployments by Implementation Status breaks the 500 records into Live 192, In Rollout 107, Pilot 93, Planned 83 and Cancelled 25.
The two working sheets
The Data sheet holds the TblData Excel Table across columns B to AC: Deployment ID, Date, Tool Name, Tool Category, Compliance Framework, Industry, Region, Deployment Type, Implementation Status, License Cost, Implementation Cost, Licensed Users, Active Users, Controls Monitored, Controls Passed, Open Findings and Satisfaction Score, plus derived Month, Year, Quarter, Spend Band, Control Pass Rate and User Adoption columns that fill down on their own. The Support sheet holds the 25 pivot tables the charts read from – you never need to touch it unless you are extending the workbook.
Digital Compliance Tools Dashboard in Excel vs. Google Sheets vs. Paid GRC SaaS – Feature Comparison
| This Excel dashboard | A Google Sheets build | Paid GRC SaaS | |
|---|---|---|---|
| Cost | $17.99 one-time | Free tool, your build time | Typically four to five figures per year |
| Platform | Excel for Windows or Mac | Browser | Vendor cloud |
| Setup time | About 10 minutes | Days to weeks | Weeks of onboarding |
| Real-time collaboration | Via OneDrive co-authoring | Yes | Yes |
| Mobile access | Read-only in the Excel app | Yes | Yes |
| Customisable fields | Yes – unlocked table and pivots | Yes | Limited to the vendor schema |
| Share with a link | OneDrive or SharePoint only | Yes | Yes |
| Year-1 cost at 5 users | $17.99 | $0 plus build time | Thousands of dollars |
| Automated evidence collection | No | No | Yes |
| Control pass rate by framework | Yes, calculated | Only if you build it | Yes |
| Works offline | Yes | No | No |
These are not competing products so much as different jobs. A GRC platform runs the programme and collects evidence. A spreadsheet dashboard reports on what the programme costs and how it is being used. If you already pay for the platform, this workbook is still useful as the management-reporting layer the platform’s own dashboards rarely cover: spend, seats and adoption across every tool, including the ones the platform does not know about.
Who Should Use This Template
It fits a compliance or GRC manager preparing a monthly steering-committee pack; an IT procurement lead who needs seat usage in front of them before a renewal call; an internal audit lead trending open findings and audit hours saved by framework; a CISO or IT manager consolidating a tool estate after an acquisition; and consultants who benchmark client tooling and want a repeatable five-page appendix.
It does not fit anyone who needs automated evidence collection, continuous control monitoring, an auditor-facing system of record, approval workflow, per-user permissions, an edit audit trail, or live sync with Jira, ServiceNow or a cloud security posture tool. It is also the wrong home for personal or regulated data – an unencrypted local workbook is not appropriate storage for that.
Real-World Use Cases
Quarterly tool-spend review. Filter the Month slicer to the quarter, and the Compliance Trend page gives you licence against implementation cost, the deployment curve and the findings backlog on a single screen. That is the entire first slide of a steering-committee deck.
Pre-renewal seat negotiation. Open Adoption Metrics, look only at Licensed Users vs Active Users by Tool Category, and flag any category where the gap is wide. Seat counts are the easiest line to cut in a renewal and the hardest to argue about once the chart is on screen.
Framework coverage review before an audit. Filter Compliance Framework to one label. Every page narrows to it: how many controls are monitored, what share pass, how many findings are open and how many audit hours the tooling saved. It will not produce evidence for the auditor, but it will tell you where to go looking.
Consultant client benchmarking. One workbook per client, Industry slicer set to their sector, five pages exported to PDF as the appendix of the assessment.
Advantages of the Digital Compliance Tools Dashboard in Excel
- No new system to learn or licence. It runs in the Excel your team already has, offline, with no admin, no seats and no vendor onboarding.
- One cache, five pages. All 25 pivots share a single pivot cache, so a filter is consistent everywhere and the file stays small.
- Derived columns do the arithmetic. Control Pass Rate, User Adoption, Spend Band, Month and Quarter are formula columns – you supply raw counts, not ratios.
- Charts named by metric and dimension. Every title says what it plots, which makes the pages readable by people who did not build them.
- Genuinely editable. Nothing is protected, so adding a framework, a tool category or a whole extra page is a normal Excel job.
Opportunities for Improvement
Worth knowing before you buy, because they are real:
- The pivot cache does not refresh on open. The workbook has no refresh-on-load flag set, so after pasting new data you must press Data > Refresh All (Ctrl+Alt+F5). Skip it and the charts quietly show yesterday’s numbers.
- It is a snapshot, not a monitor. There is no alerting, no threshold colouring on the KPI cards, and no target column – a metric that is drifting will not announce itself.
- Satisfaction Score is a single averaged number with no response count behind it, so treat it as directional only.
- Row volume has a practical ceiling. A few thousand rows are fine; past roughly 50,000 the refresh becomes noticeable and a database-backed tool is the better answer.
- No currency switch. Costs are formatted in dollars; changing that is a number-format pass across the pages.
Best Practices
- Keep one row per tool per period rather than one row per tool. The Compliance Trend page is only meaningful if the same tool reappears month after month.
- Never rename the headers in
TblData. The pivot fields are bound to those exact names; renaming one drops it silently out of the charts. - Record Controls Monitored and Controls Passed as counts, not percentages. The pass rate is derived – entering a rate twice is how dashboards start disagreeing with themselves.
- Refresh, then read. Make Ctrl+Alt+F5 the first thing you do after every paste. Microsoft’s guidance on refreshing PivotTable data is worth a two-minute read if the behaviour is new to you.
- Clear the slicers before you save. A workbook saved with three slicers filtered is the classic cause of “the numbers changed overnight”.
- Keep the raw export. Paste a copy of your source extract into a separate file each month so you can rebuild if a paste goes wrong.
Explore Relevant Templates
If this dashboard fits, these usually do too. The Cyber Risk Management Dashboard in Excel covers the threat and mitigation side and also ships in a Power BI edition. The Data Protection Office Dashboard in Excel reports privacy requests and DPO workload. For control testing and findings, the Audit & Internal Controls Dashboard in Excel is the closest neighbour, and the IT Manager & CISO Toolkit bundles ten IT and security templates together. There is currently no Power BI or Google Sheets edition of this particular dashboard.
Frequently Asked Questions
Does this dashboard make my organisation compliant with SOC 2, ISO 27001 or GDPR?
No. It makes no certification or compliance claim for any framework. Those labels are sample values in the dataset that you can filter by. Compliance comes from your controls, your evidence and your auditor.
Does it connect to my compliance tools or pull data automatically?
No. There is no integration or live connection of any kind. It is a fully offline Excel file and you paste the numbers in yourself.
Are the figures in the screenshots real data?
No. All 500 rows are fictional sample records built to demonstrate the layout. Nothing in them is a benchmark.
Do I need macros or a Microsoft 365 subscription?
Neither. It is a plain .xlsx using Excel Tables, pivot tables and slicers, and it works in any Excel version that supports slicers – Excel 2013 and later on Windows, Excel 2016 and later on Mac.
Why did my charts not update after I pasted new data?
The workbook does not refresh its pivot cache when it opens. Press Data > Refresh All, or Ctrl+Alt+F5, and all 20 charts redraw.
Can I add my own frameworks or tool categories?
Yes. They are plain text values in the Data sheet, so anything new appears in the slicers after a refresh.
Can I use it alongside a GRC platform we already pay for?
That is a common pairing. The platform runs the programme; this workbook reports spend, seats and adoption across the whole estate, including tools the platform does not manage.
About the Author
Built by PK – Microsoft Certified Professional with 15+ years of Excel, Google Sheets, and Power BI experience. Founder of NextGenTemplates, reaching 300K+ subscribers across YouTube channels. Every template is hand-built and tested before release.
Conclusion
Compliance tooling gets bought one problem at a time and reported on almost never. The Digital Compliance Tools Dashboard in Excel closes that gap with the least possible ceremony: one table, five pages, twenty charts and four slicers, in a file that opens on any desktop Excel and asks nothing of IT. It will not collect your evidence, monitor your controls or certify you against anything – and it does not pretend to. What it will do is put licence spend, implementation cost, control pass rates, open findings and real seat usage on five pages your steering committee can read in a couple of minutes.
Get the Digital Compliance Tools Dashboard in Excel for $17.99 (regular $29.99) – instant download, one-time payment, lifetime access.
For step-by-step Excel dashboard tutorials, subscribe to youtube.com/@PKAnExcelExpert.