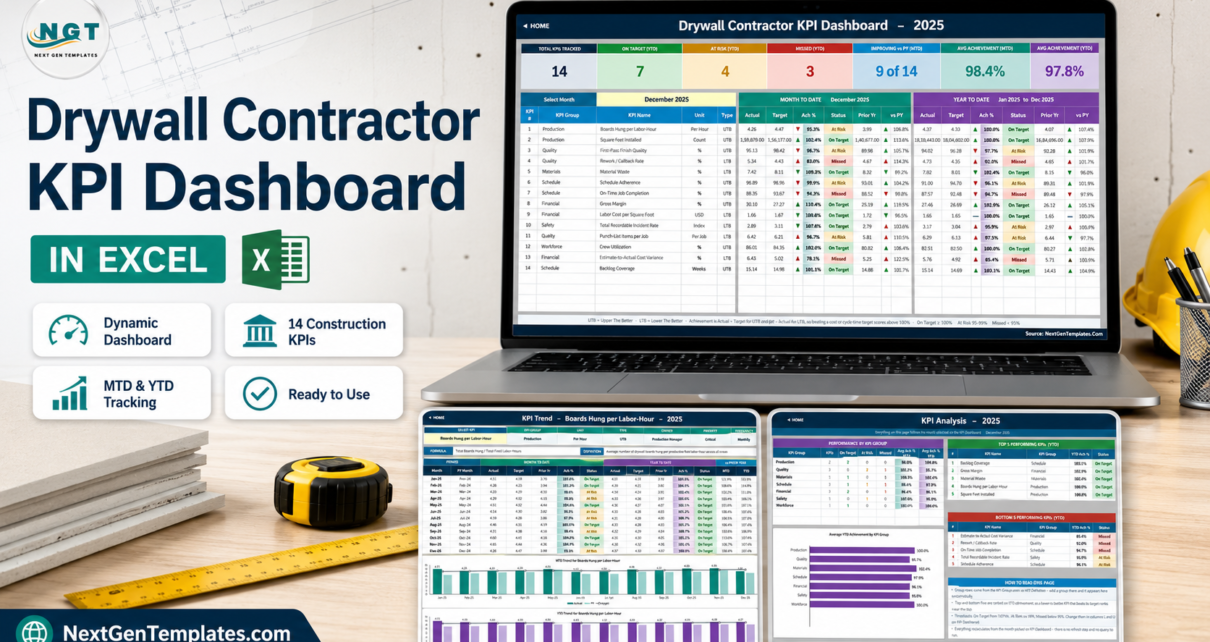
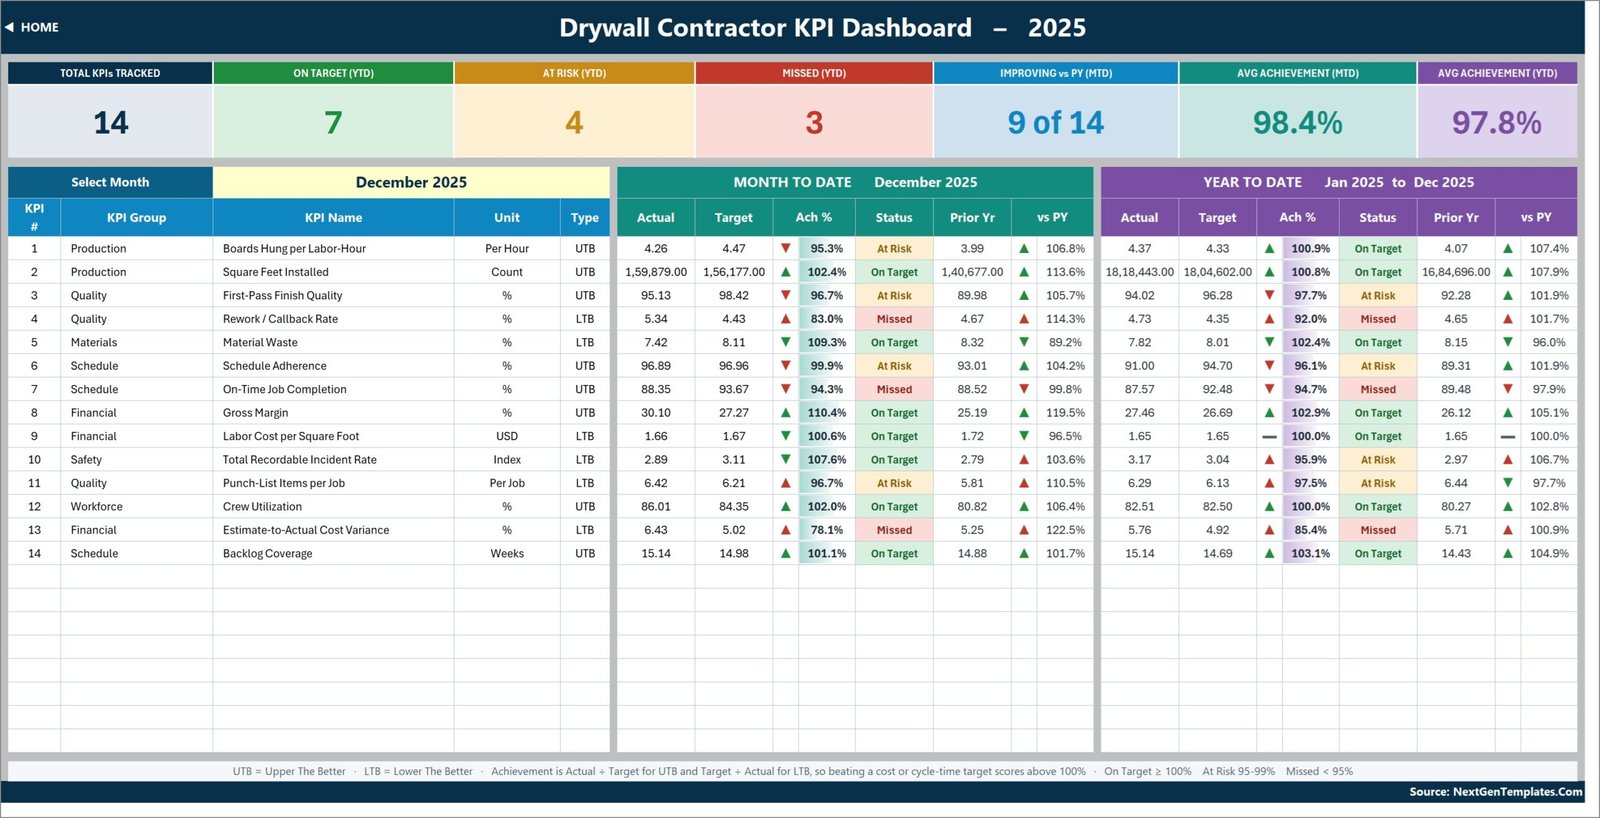
Most drywall subcontractors already know their revenue. Far fewer can say, in one glance, whether last month’s boards-per-labor-hour beat target, whether callbacks are trending the wrong way, and whether the year-to-date margin is holding. The Drywall Contractor KPI Dashboard in Excel is built for exactly that gap: 14 drywall KPIs, one month dropdown, and a full MTD and YTD scorecard with traffic lights – all in a plain .xlsx with no macros, no Power Query and no add-ins. It ships with a complete 2025 sample year (December selected, 7 KPIs On Target, 4 At Risk, 3 Missed) so nothing is theoretical when you open it.
First, which template is this? There are three similarly named product lines and they are genuinely different files. The analytical dashboards chart a transaction table through slicers. The KPI Scorecard line is a lighter monthly scorecard. This one is the KPI Dashboard line: a month picker that drives every page, traffic lights on every row, and dedicated KPI Trend and KPI Analysis pages. If you already own the Drywall Contractor KPI Scorecard in Excel, this is a step up, not a duplicate.
Key Features of the Drywall Contractor KPI Dashboard in Excel
- 14 KPIs in 7 groups. Production (2), Quality (3), Materials (1), Schedule (3), Financial (3), Safety (1) and Workforce (1).
- A single month dropdown. Cell D6 on KPI Dashboard lists the twelve months of the reporting year; the scorecard, the seven summary cards and the whole KPI Analysis page follow it instantly.
- MTD and YTD blocks side by side. Each block carries actual, target, achievement %, traffic-light status, prior-year value and a vs-PY percentage with a direction arrow.
- Direction-aware achievement. Eight KPIs are UTB (upper the better) and six are LTB (lower the better). Achievement is Actual / Target for UTB and Target / Actual for LTB, so cutting material waste or callbacks scores above 100% rather than reading as a miss.
- Editable status thresholds. On Target from 100%, At Risk 95-99%, Missed below 95% – written as ordinary formulas in columns L and U, not baked into conditional formatting you cannot reach.
- Three charts. Two combo charts on KPI Trend (actual and prior-year columns with a target line) and one bar chart, “Average YTD Achievement by KPI Group”, on KPI Analysis.
- 22-KPI capacity. 14 rows are filled; the remaining eight are live and empty, so a new KPI needs no formula work at all.
- Plain formulas only. VLOOKUP, MATCH, INDEX, COUNTIF and IF – the same functions documented in Microsoft’s own VLOOKUP reference. Every one of them is traceable with Excel’s formula auditing tools.
Dashboard Pages Explanation
Home
A nine-tile launcher split into Dashboard Pages, Input Sheets and Reference & Help, followed by a five-point summary of what the file does. Nothing is hidden behind a menu – every sheet is one click away.
KPI Dashboard – the scorecard
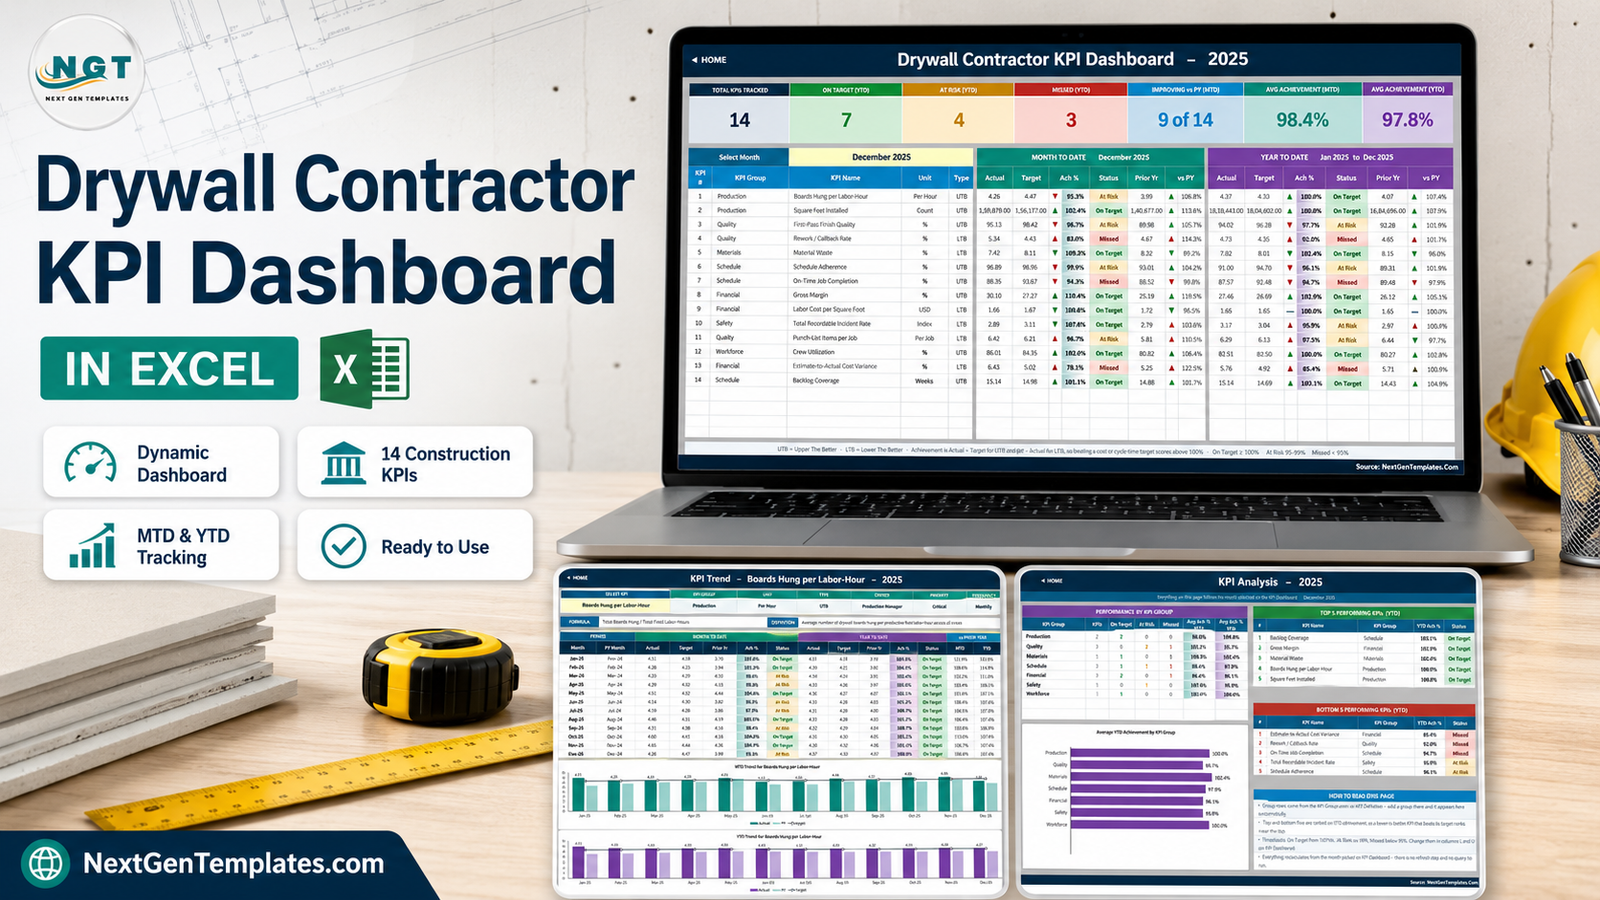
The centre of the workbook. Seven summary cards run across the top: Total KPIs Tracked, On Target (YTD), At Risk (YTD), Missed (YTD), Improving vs PY (MTD), Avg Achievement (MTD) and Avg Achievement (YTD). With the sample data and December 2025 selected they read 14, 7, 4, 3, 9 of 14, 98.4% and 97.8%. Below them, one row per KPI carries number, group, name, unit and UTB/LTB type, then a full Month To Date block and a full Year To Date block.
Reading the sample December row by row: Boards Hung per Labor-Hour is 4.26 against a 4.47 target (95.3%, At Risk) while its YTD sits at 4.37 against 4.33 (100.9%, On Target). Rework / Callback Rate is 5.34% against a 4.43% target – an LTB KPI, so 83.0% and Missed. Gross Margin is 30.10% against 27.27% (110.4%, On Target). Estimate-to-Actual Cost Variance is the worst row on the board at 78.1% MTD and 85.4% YTD.
KPI Trend – one KPI, twelve months
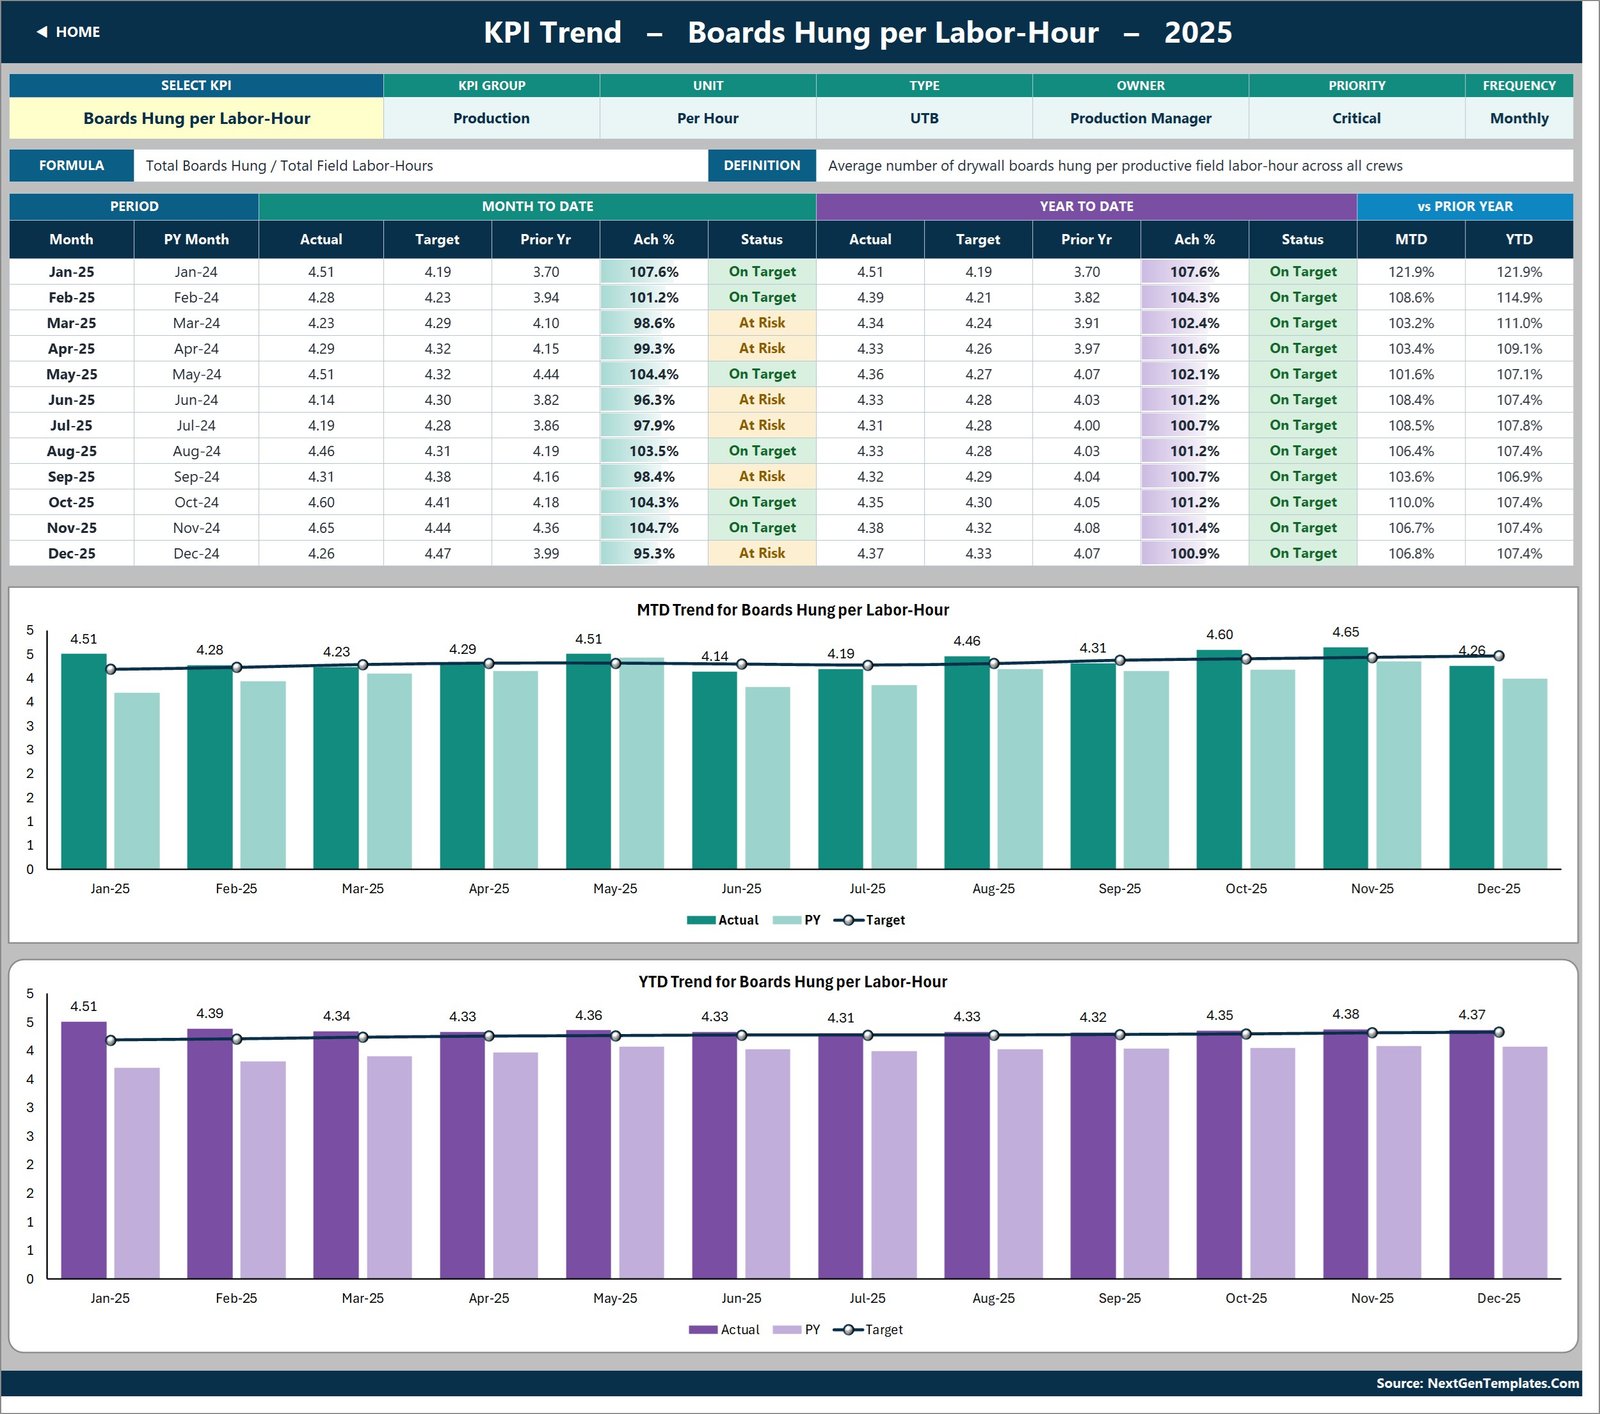
A second dropdown lists every KPI name from KPI Definition. Choose one and the attribute strip (KPI group, unit, type, owner, priority, frequency), the formula, the definition, a twelve-month table and both charts redraw together. For Boards Hung per Labor-Hour the strip reads Production / Per Hour / UTB / Production Manager / Critical / Monthly, and the table shows the MTD result swinging between 4.14 and 4.65 while the YTD line barely moves off 4.33 – which is exactly the point of showing both.
KPI Analysis – group roll-up and rankings
Performance by KPI Group counts KPIs, On Target, At Risk and Missed per group and averages achievement for MTD and YTD. In the sample, Quality is the problem group (3 KPIs, 0 On Target, 2 At Risk, 1 Missed, 95.7% YTD) while Materials leads at 102.4%. Beside it sit Top 5 and Bottom 5 tables ranked on YTD achievement, so a lower-is-better KPI that beats its target ranks near the top rather than being punished for it.
The three input sheets
KPI Input – Actual, – Target and – PY hold an MTD and a YTD column for every month. The KPI rows on all three are driven by KPI Definition, so they can never drift out of alignment. Cell E3 on the Actual sheet is the first month of the reporting year: change it and the Target sheet, the Prior Year sheet, the month dropdown and every sheet title re-base themselves.
KPI Definition and Read Me
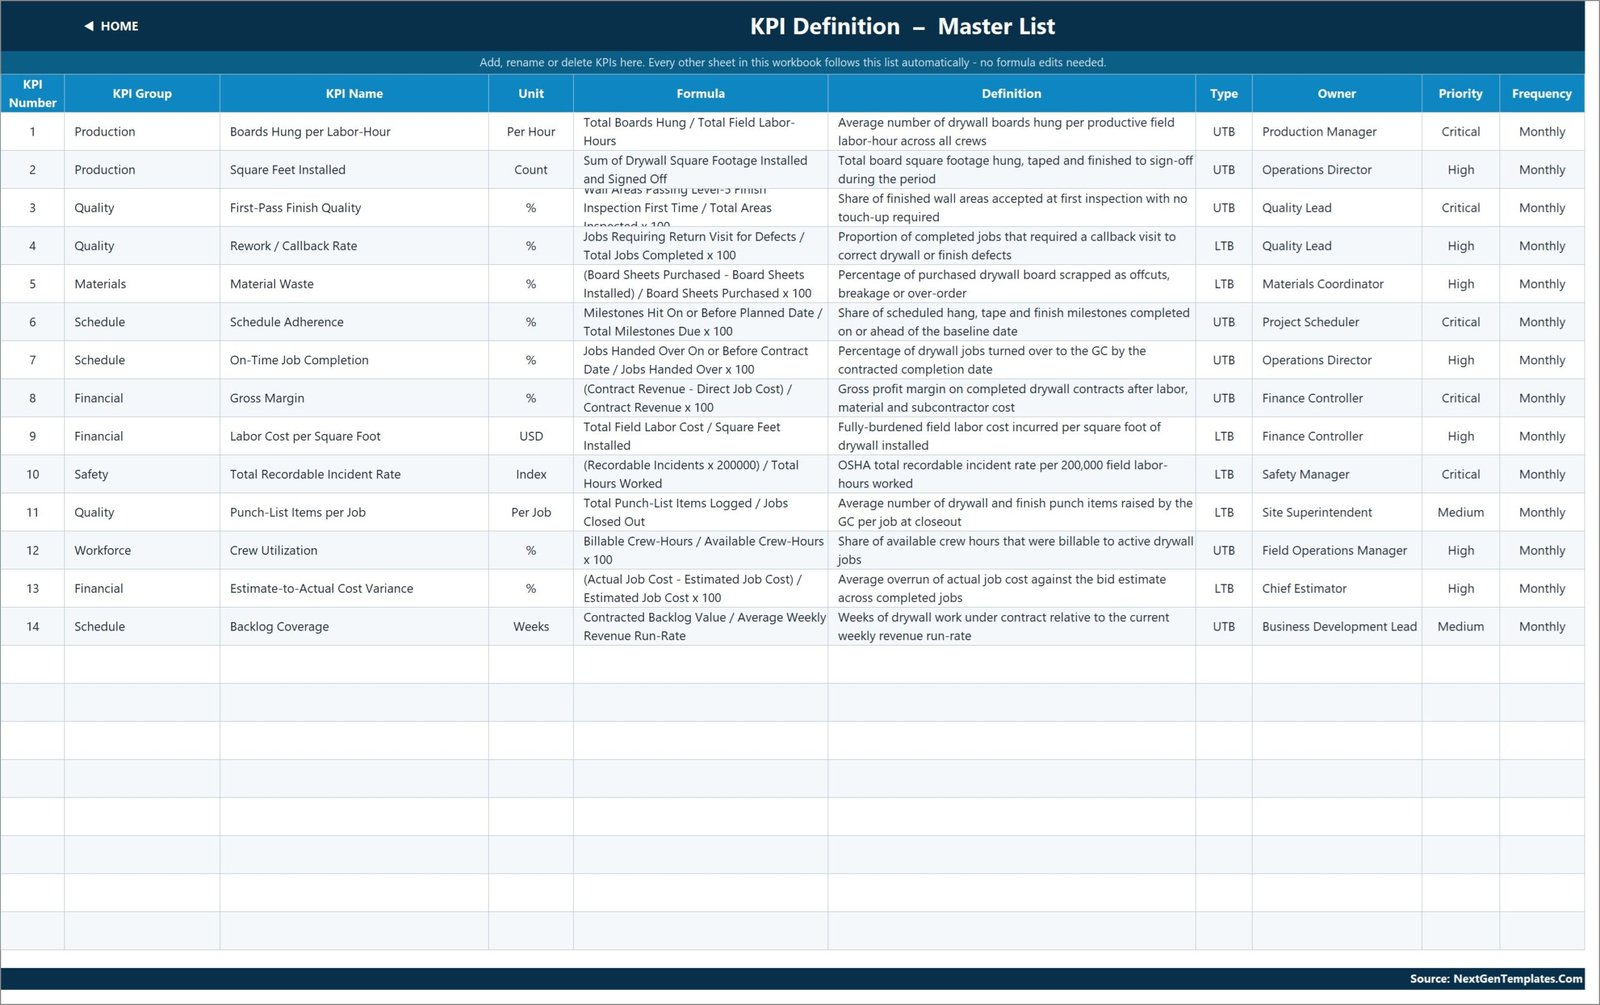
KPI Definition is the master list – number, group, name, unit, formula, definition, UTB/LTB type, owner, priority, frequency – and every other sheet reads from it. Read Me documents the MTD/YTD rules, the achievement maths, the status thresholds and how to add, rename or remove a KPI.
Drywall Contractor KPI Dashboard in Excel vs. Google Sheets vs. Paid Construction SaaS – Feature Comparison
| This template (Excel) | Google Sheets KPI scorecard | Procore / Buildertrend | |
|---|---|---|---|
| Cost | 19.99 one time (12.99 on sale) | 13.99 one time | Quoted annually, commonly four figures and up |
| Platform | Excel 2013+, Excel for Mac, Excel for the web | Any browser | Vendor cloud |
| Setup time | Minutes – type over the sample data | Minutes | Weeks, usually with onboarding |
| Real-time team collaboration | Via OneDrive / SharePoint co-authoring | Yes, natively | Yes |
| Mobile access | Excel mobile app | Browser and Sheets app | Native apps |
| Customizable fields | Every cell – nothing locked or hidden | Every cell | Vendor-defined fields only |
| Share with link | Via a OneDrive share | Yes | Per-seat login |
| Year-1 cost at 5 users | 19.99 total | 13.99 total | Per-seat, four figures and up |
| Where the numbers come from | You type MTD and YTD per month | You type MTD and YTD per month | Captured from live job data |
| Drywall-specific KPI set | 14 named drywall KPIs out of the box | Depends on the build | You configure it |
Who Should Use This Template
It suits a drywall subcontractor running roughly 5-60 crews who already pulls monthly figures out of QuickBooks, Sage 100 Contractor or a spreadsheet and wants one page that scores them consistently. It suits an operations manager who runs a monthly review and needs a defensible rule for what counts as a miss. It suits a finance controller who wants gross margin, labor cost per square foot and estimate-to-actual variance sitting next to production, schedule and safety instead of in three unconnected files.
It is not for anyone who wants the workbook to read live job data, and it is not a job-level or crew-level analysis tool – the grid holds one number per KPI per month. It is also not a safety or compliance system; see the honest list further down.
Real-World Use Cases
Monthly leadership pack. A commercial drywall owner types twelve numbers at month-end and prints the scorecard for the Monday meeting. The Bottom 5 table sets the agenda automatically – in the sample it opens on Estimate-to-Actual Cost Variance at 85.4% and Rework / Callback Rate at 92.0%.
Supervisor one-to-ones. An operations manager walks the KPI Trend page one KPI at a time. Seeing a 95.3% month sitting under a 100.9% YTD line changes the conversation from “you missed” to “this month was noise”.
Board reporting with tighter tolerances. A controller moved the At Risk floor from 95% to 97% in columns L and U, renamed three KPIs on KPI Definition, and added a fourth in the empty rows – none of which required touching a formula.
Advantages of the Drywall Contractor KPI Dashboard in Excel
- Nothing to install or enable. A plain .xlsx opens and calculates – no macro warning, no query refresh, no data model.
- Fully readable. Every number traces back to a worksheet formula you can select and follow.
- Fair scoring for cost and defect KPIs thanks to the UTB/LTB flag, which is where most home-grown KPI sheets go wrong.
- Owner and priority per KPI – accountability is built into the definition sheet, not bolted on in a separate RACI file.
- Real drywall KPIs, not generic business metrics: boards per labor-hour, first-pass finish quality, punch-list items per job, backlog coverage in weeks.
- Cross-platform – the same file works on Windows, Mac and Excel for the web.
Opportunities for Improvement
Stated plainly, because you should know before you buy:
- MTD and YTD are both typed. The workbook does not derive YTD from the monthly cells, and there is no source-transaction table, job list or timesheet import. You supply both figures.
- The Frequency column is a label, not a switch. All 14 KPIs are stored on a monthly grid regardless of what that column says.
- Indian digit grouping on large numbers. Six-figure Square Feet Installed values render as 18,18,443.00 instead of 1,818,443.00 – a regional number-format setting from the export machine. Select the cells and reapply your own format and it is gone.
- Leftover aerospace wording in the Read Me. The “Cumulative or average YTD” row still gives “aircraft deliveries, non-conformance reports” as its examples – text carried over from a sibling build. The rule it describes is correct; only the example is wrong for a drywall business.
- Two cosmetic rendering quirks. On KPI Definition, the long formula text in row 3 clips at the fixed row height, and on KPI Trend the chart value axis repeats its tick labels (5, 5, 4, 4 …) because a 0.5 major unit is displayed with no decimals. Both are one-click fixes in Excel.
- No incident or inspection records. Total Recordable Incident Rate is a single typed number per month. If you need the underlying calculation and reporting rules, they live with OSHA, not in this workbook.
Best Practices
- Fix the KPI list before you type a single number. Rename and delete on KPI Definition first; everything else follows it.
- Set UTB or LTB deliberately. Six of the fourteen are LTB here – waste, callbacks, labor cost per square foot, TRIR, punch-list items and cost variance. Getting one of these backwards inverts its score.
- Agree what YTD means before month one. Volumes accumulate; rates, ratios and per-unit costs should be running averages. A percentage that sums to 1,100% by December is the classic sign of a KPI pack nobody checked.
- Keep prior-year data. The vs-PY columns and both trend charts are only useful if the PY sheet is filled.
- Move the thresholds once, in writing. If your board wants a tighter amber band, change columns L and U and note it in the Read Me so next year’s reviewer knows.
- Save a copy per reporting year rather than re-basing the same file, so last year’s scorecard stays exactly as it was reported.
Explore Relevant Templates
- Drywall Contractor KPI Dashboard in Excel – the template covered in this post.
- Drywall Contractor KPI Dashboard in Power BI – the same 14 KPIs rebuilt as a Power BI report.
- Masonry Contractor KPI Dashboard in Excel and Electrical Contractor KPI Dashboard in Excel.
- Flooring Installation KPI Dashboard in Excel and Roofing Contractor KPI Dashboard in Excel.
- Drywall Contractor KPI Scorecard in Excel – the lighter scorecard line, same trade.
- KPI Dashboard Library (Excel) – 15 Premium Templates if you want the whole set.
Frequently Asked Questions
Does the dashboard calculate KPIs from my job data?
No. You type or paste the MTD and the YTD figure for each KPI, each month. The workbook then scores, colours, ranks and charts them. There is no import, no query and no connection to accounting software.
How is achievement calculated?
Actual divided by Target for a UTB KPI, and Target divided by Actual for an LTB KPI. That is why beating a cost or waste target scores above 100% here instead of looking like a shortfall.
Can I change the traffic-light thresholds?
Yes. They are ordinary formulas in columns L and U on KPI Dashboard. The shipped rule is On Target from 100%, At Risk 95-99%, Missed below 95%.
How many KPIs can I add?
The sheets are wired for 22 and 14 are used, so eight more need no work. Beyond that, fill down the last row on each sheet and widen the summary-card ranges on row 4 and the helper columns on the hidden Support sheet.
Does it need macros or Power Query?
Neither. It is a plain .xlsx that opens without a security prompt and recalculates on its own.
Is it the same as the Drywall Contractor KPI Scorecard?
No – different product line. The scorecard is lighter; this file adds the month picker that drives every page, the KPI Trend page with two combo charts, and the KPI Analysis group roll-up with top and bottom five.
What exactly is in the download?
A ZIP containing the .xlsx workbook and the Excel KPI Dashboard User Manual PDF.
About the Author
Built by PK – Microsoft Certified Professional with 15+ years of Excel, Google Sheets, and Power BI experience. Founder of NextGenTemplates, reaching 300K+ subscribers across YouTube channels. Every template is hand-built and tested before release.
Conclusion
The Drywall Contractor KPI Dashboard in Excel does one job properly: it turns fourteen monthly numbers into a scored, colour-coded, board-ready view of a drywall business, with a trend page for the KPI you are arguing about and an analysis page that names the worst five before anyone has to look for them. It will not collect your data for you – and this post has been explicit about that – but if your numbers already exist, it is the fastest honest way to present them. Get the template on NextGenTemplates, and for step-by-step Excel walkthroughs subscribe at youtube.com/@PKAnExcelExpert.