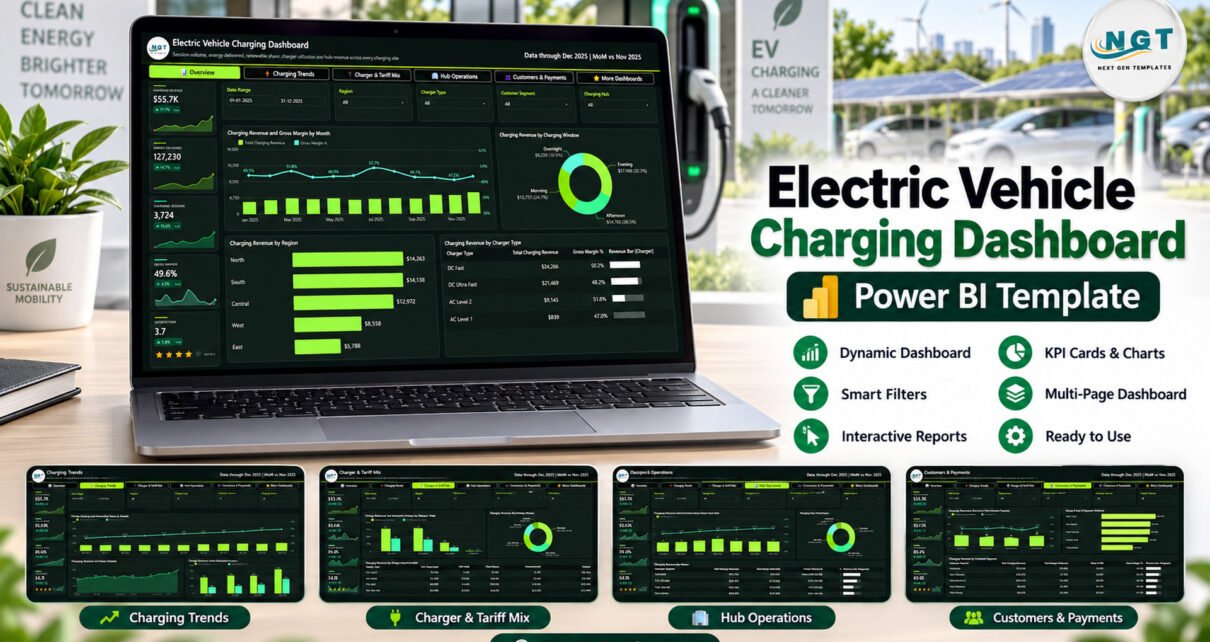
Electric Vehicle Charging Dashboard in Power BI turns entered charging-session, energy, revenue, hub, tariff, customer, and payment data into five connected analytical pages.
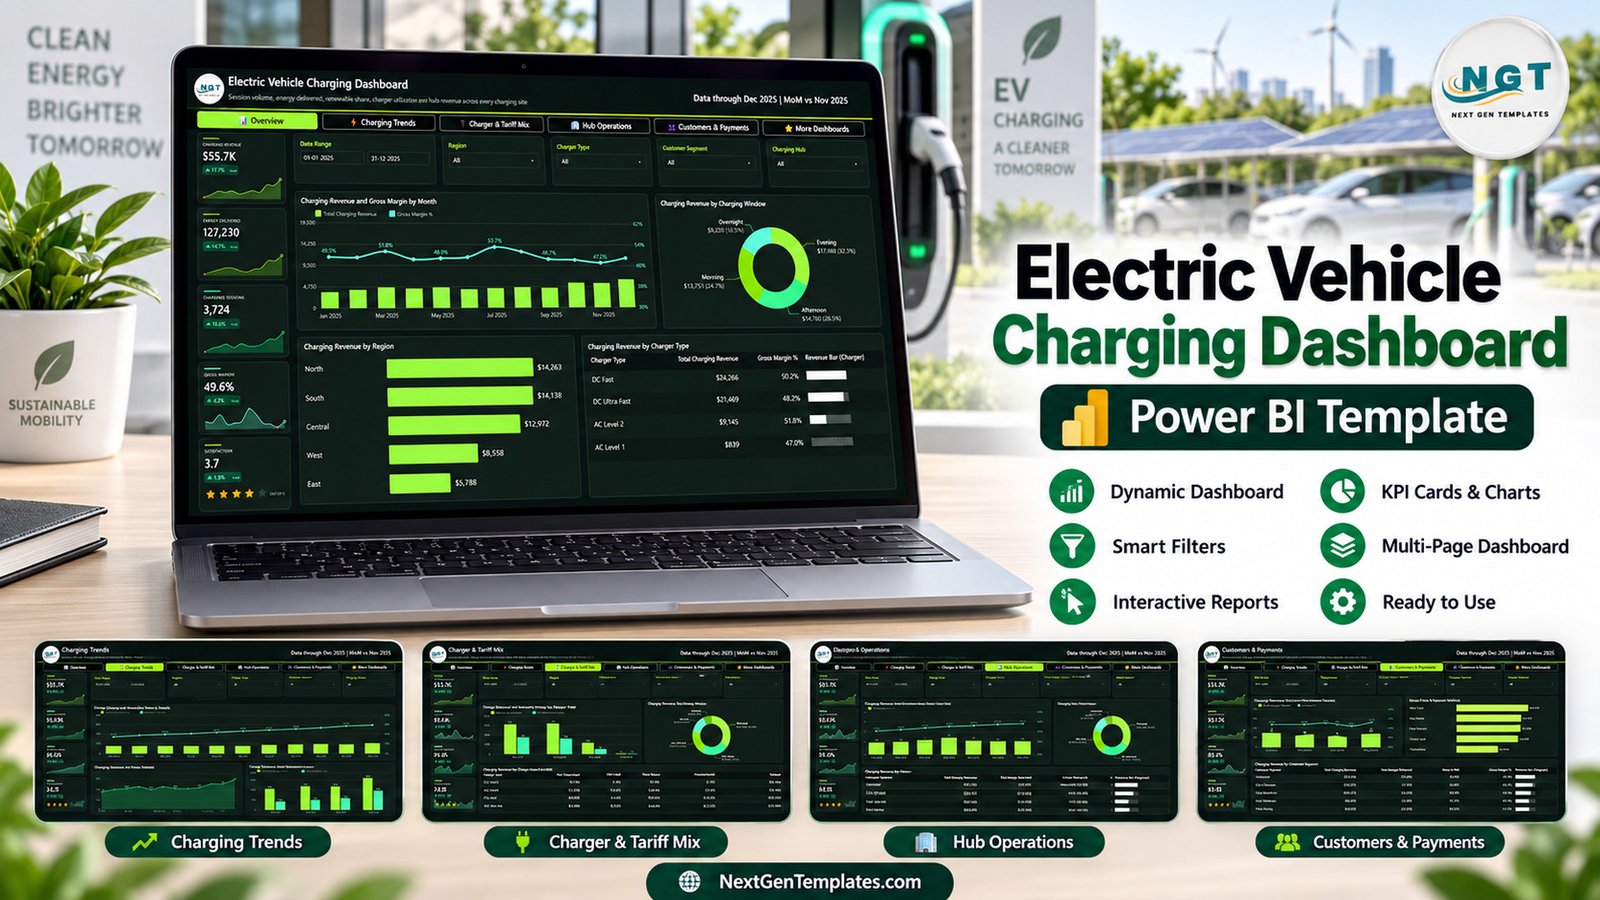
The package contains a PBIX report, Data.xlsx with 500 fictional sessions, and a user manual. It is reporting-only: it does not operate chargers, meter electricity, settle payments, optimize routes, forecast demand, send alerts, or connect to network hardware.
Why use an Electric Vehicle Charging Dashboard in Power BI?
Charging operations bring together commercial, energy, equipment, location, and customer measures. A shared reporting model helps authorized teams review those dimensions consistently while retaining the selected period and filter context.
Five report pages
Overview
Review revenue, energy delivered, sessions, gross margin, satisfaction, monthly performance, charging windows, regions, and charger types.
Charging Trends
Compare monthly energy with renewable share, session volume by month, and delivered versus renewable energy by quarter.
Charger & Tariff Mix
Examine energy by charger type, revenue by tariff plan, and revenue across charger-and-tariff combinations.
Hub Operations
Review utilization, idle and queue minutes, service cost, billing status, hub revenue, and satisfaction.
Customers & Payments
Compare revenue and margin by customer segment, gross profit by payment method, and segment-level energy and profit.
Prepare reliable source data
- Retain an untouched backup.
- Map only approved fields.
- Standardize energy and time units, currencies, categories, and statuses.
- Refresh the model.
- Reconcile totals with charging, billing, and finance systems.
- Record the filter and refresh context.
Interpret the measures carefully
Renewable share describes entered data and does not certify energy origin. Billing status does not prove payment settlement. Utilization depends on the model’s charging and availability definitions. Document those definitions before comparing hubs or periods.
Check duplicate session IDs, negative or impossible values, missing hub labels, inconsistent tariffs, and disputed transactions. Investigate exceptions in the source system rather than editing a chart to make the result appear cleaner.
Use the analysis responsibly
Charging and payment records may contain commercially sensitive or customer-related information. Minimize fields, restrict access, and follow applicable privacy, security, retention, payment, tax, and metering rules. The template provides no regulatory assurance.
Questions for review
Ask which hubs drive changes, whether session growth aligns with energy and revenue, where queue or idle time differs, how charger and tariff mixes shift, and whether margin changes reflect price, cost, or data coverage. Compare totals before percentages.
Validate the reporting cycle
Confirm that all expected hubs submitted data and that the selected date range is complete. Reconcile total sessions, energy delivered, revenue, and payment status with authorized source systems. Sample individual records across regions, charger types, tariffs, and billing outcomes. Check for duplicate session IDs, impossible durations, and mixed energy units.
Write down the definitions for charger availability, utilization, renewable share, gross margin, queue time, and settlement rate. These measures can change materially when the denominator or inclusion rules change. Keep the same definitions across periods or label a restatement clearly.
Related Power BI learning
Explore the Electric Vehicle Charging KPI Dashboard in Excel, Renewable Energy Dashboard in Power BI, and Fleet Management Dashboard in Power BI for related analytical patterns. For authoritative infrastructure background, see the U.S. Department of Energy Alternative Fuels Data Center or the responsible local authority.
Keep customer identifiers, payment credentials, network keys, and precise infrastructure secrets outside the report. Use access controls and aggregation appropriate to the audience, and record who approved each distributed export.
Archive the data dictionary and reconciliation evidence for each cycle. Record source owners, refresh time, currency, time zone, energy units, and exclusions so later reviewers can reproduce the reported figures and distinguish real movement from a definition or filter change.
Start a consistent reporting cycle
Use the fictional records to learn the model, replace them with validated data, reconcile the results, and keep operational action in authorized charging-network, maintenance, payment, and finance systems.