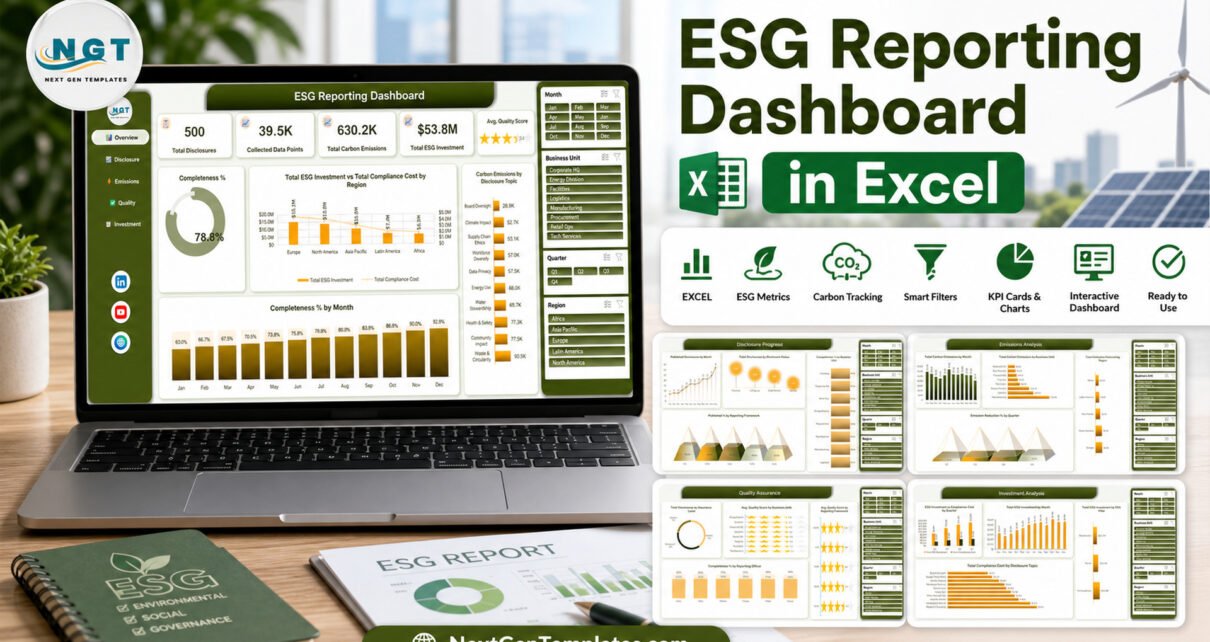
The ESG Reporting Dashboard in Excel is a seven-sheet workbook that turns 500 sample disclosure records into 5 interactive pages, 5 KPI cards and 16 linked charts, all filtered by 4 slicers: Month, Business Unit, Quarter and Region. Everything it shows comes from a single Data sheet with 20 input columns, so swapping in your own records takes under 10 minutes. There are no macros, no Power Query queries and no add-ins to install.
Most sustainability teams do not lose time analysing ESG data. They lose it chasing the data: which of the eight business units has actually submitted, how complete each submission is, which reports are overdue, and who signed off on what level of assurance. This workbook is built for exactly that internal chase — and it is deliberately not built to be anything more than that.
Important: what this template is, and what it is not
ESG reporting is a regulated disclosure area, and this is a spreadsheet. Being blunt about the boundary is more useful to you than a sales pitch, so here it is. This is an internal Excel reporting template for data a buyer types or pastes in. It does not:
- produce a compliant or assurable ESG, sustainability or climate disclosure;
- implement or certify conformance with GRI, SASB, CSRD/ESRS, TCFD, ISSB/IFRS S1-S2, CDP, SBTi, the GHG Protocol, the EU Taxonomy or the SEC climate rules;
- measure, calculate or verify emissions, energy, water, waste, diversity or any other metric — every figure is buyer-entered;
- constitute assurance, audit, limited or reasonable assurance, or third-party verification;
- give investment, legal or regulatory advice.
The framework names you can see on the Disclosure Progress page are values in a plain text column you tag your own rows with. Every emissions, carbon and intensity figure in the screenshots is demo data shipped with the file so the charts have something to draw — not a calculation the workbook performs. For the disclosure itself, work with a reporting platform and an assurance provider. Use this workbook for the internal tracking that feeds them. If you want a formal grounding in what those frameworks actually require, the IFRS Sustainability Standards Navigator is the primary source.
Key Features of the ESG Reporting Dashboard in Excel
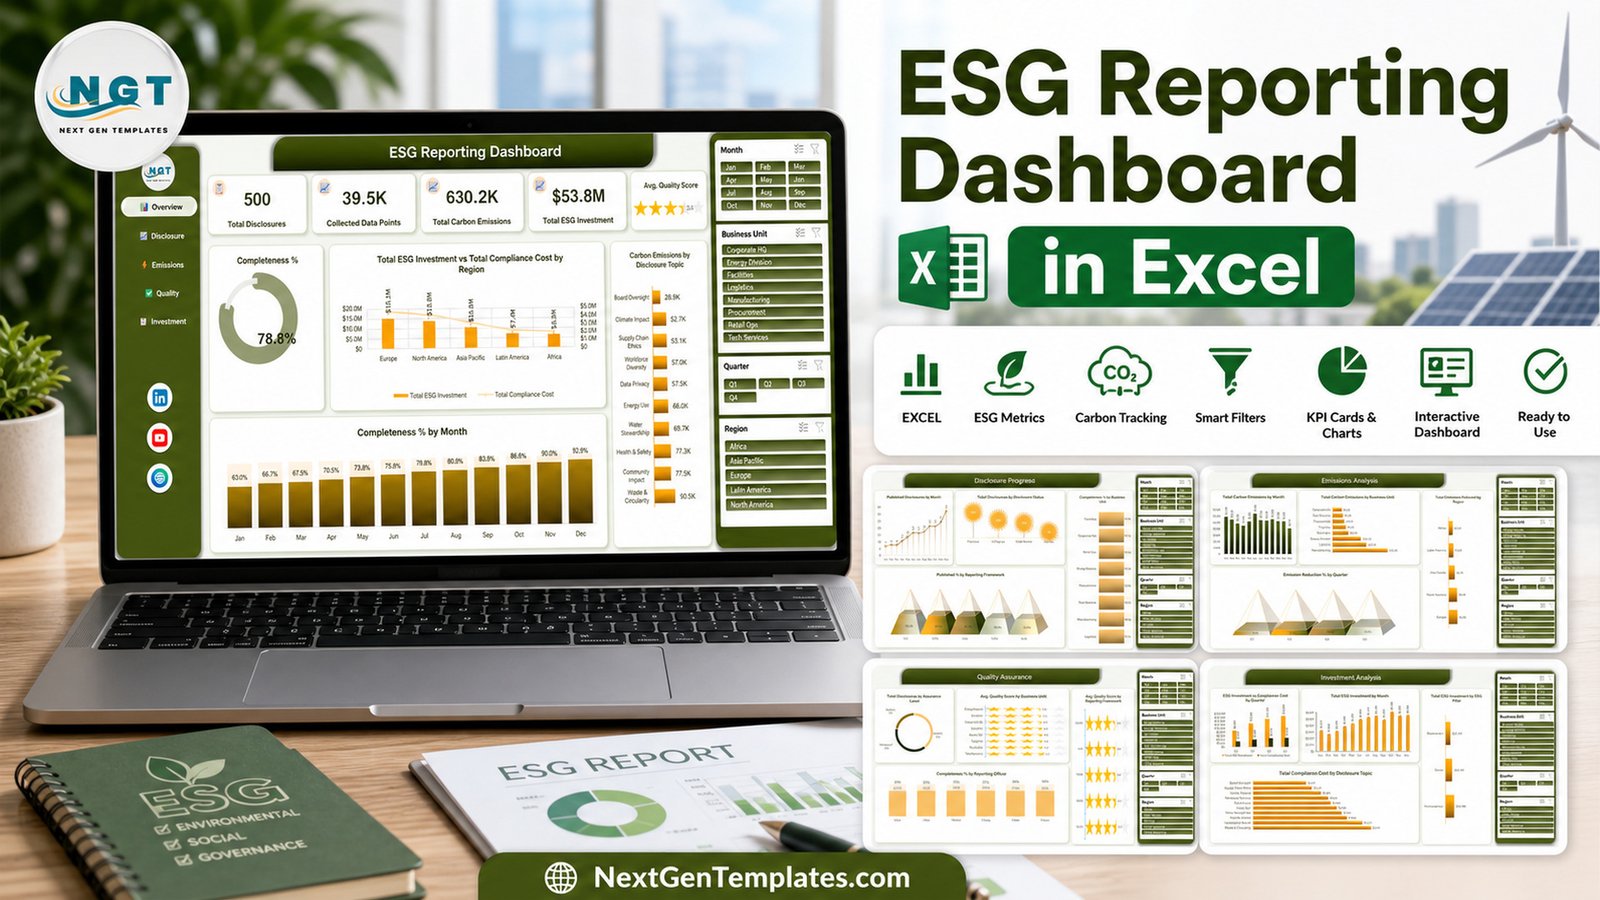
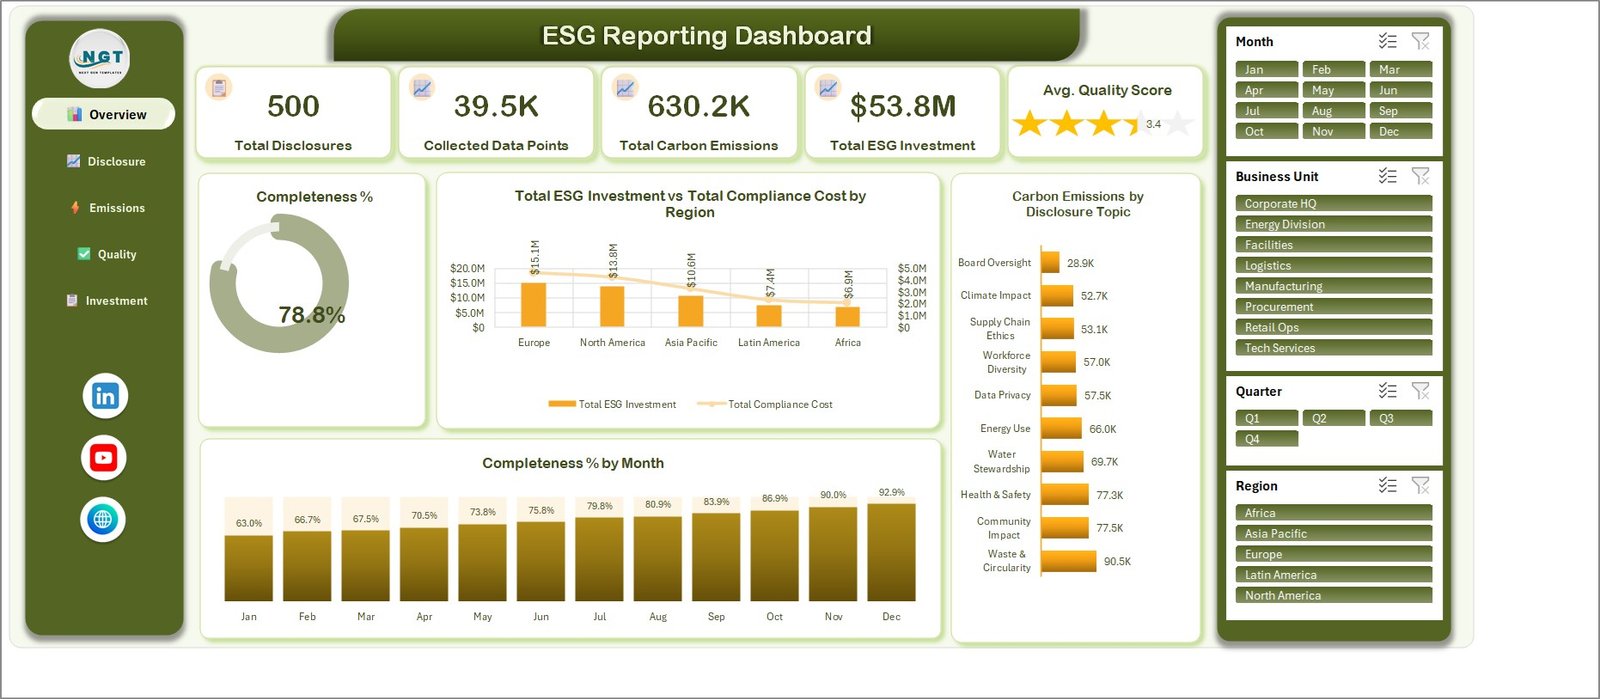
Five KPI cards sit across the top of the Overview page: Total Disclosures, Collected Data Points, Total Carbon Emissions, Total ESG Investment and Avg. Quality Score. On the shipped demo data these read 500, 39.5K, 630.2K, $53.8M and 3.4 out of 5. Each one is a sum or average of a column you fill in.
Four slicers — Month, Business Unit, Quarter and Region — are wired to every page in the workbook. Click Manufacturing or Q3 and all 16 charts across all five pages re-filter together, which is the part that usually takes a day to build by hand.
The Data sheet carries 20 input columns: Report ID, Report Date, Business Unit, Region, ESG Pillar, Reporting Framework, Disclosure Topic, Assurance Level, Reporting Officer, Disclosure Status, Data Points Required, Data Points Collected, Carbon Emissions, Emissions Reduced, ESG Investment, Compliance Cost, Disclosure Quality Score, Month, Year and Quarter. A separate Support sheet holds the helper aggregations the charts read, so adding rows never breaks a chart.
Dashboard Pages Explanation
Page 1: Overview
The landing page. Five KPI cards, then Completeness % as a single donut (78.8% on the demo data), Total ESG Investment vs Total Compliance Cost by Region as a combo chart across five regions, Carbon Emissions by Disclosure Topic across ten topics, and Completeness % by Month.
Page 2: Disclosure Progress
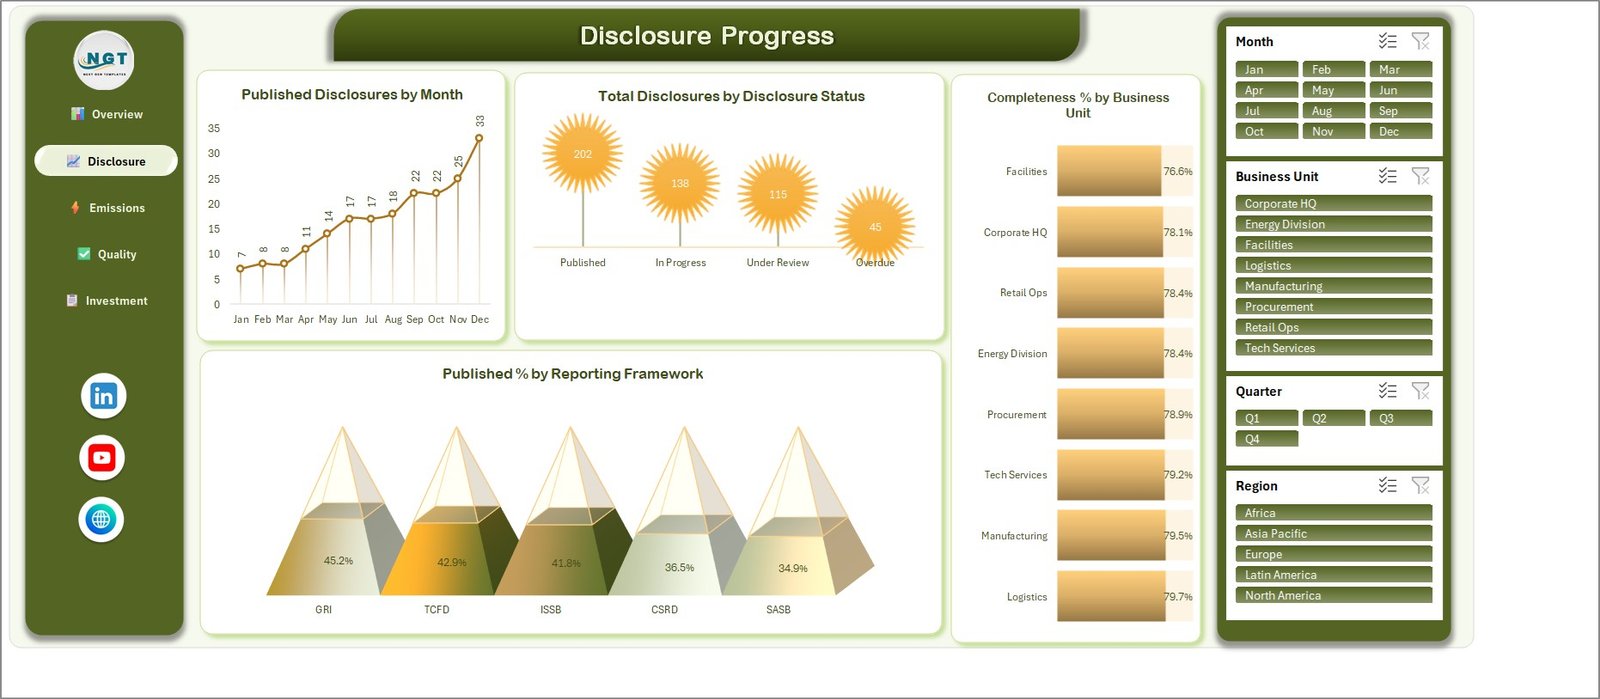
Where each disclosure has got to. Published Disclosures by Month runs as a line from 7 in January to 33 in December on the demo data. Total Disclosures by Disclosure Status splits into Published, In Progress, Under Review and Overdue. Completeness % by Business Unit covers all eight units, and Published % by Reporting Framework breaks out the five framework labels you can tag rows with.
Page 3: Emissions Analysis
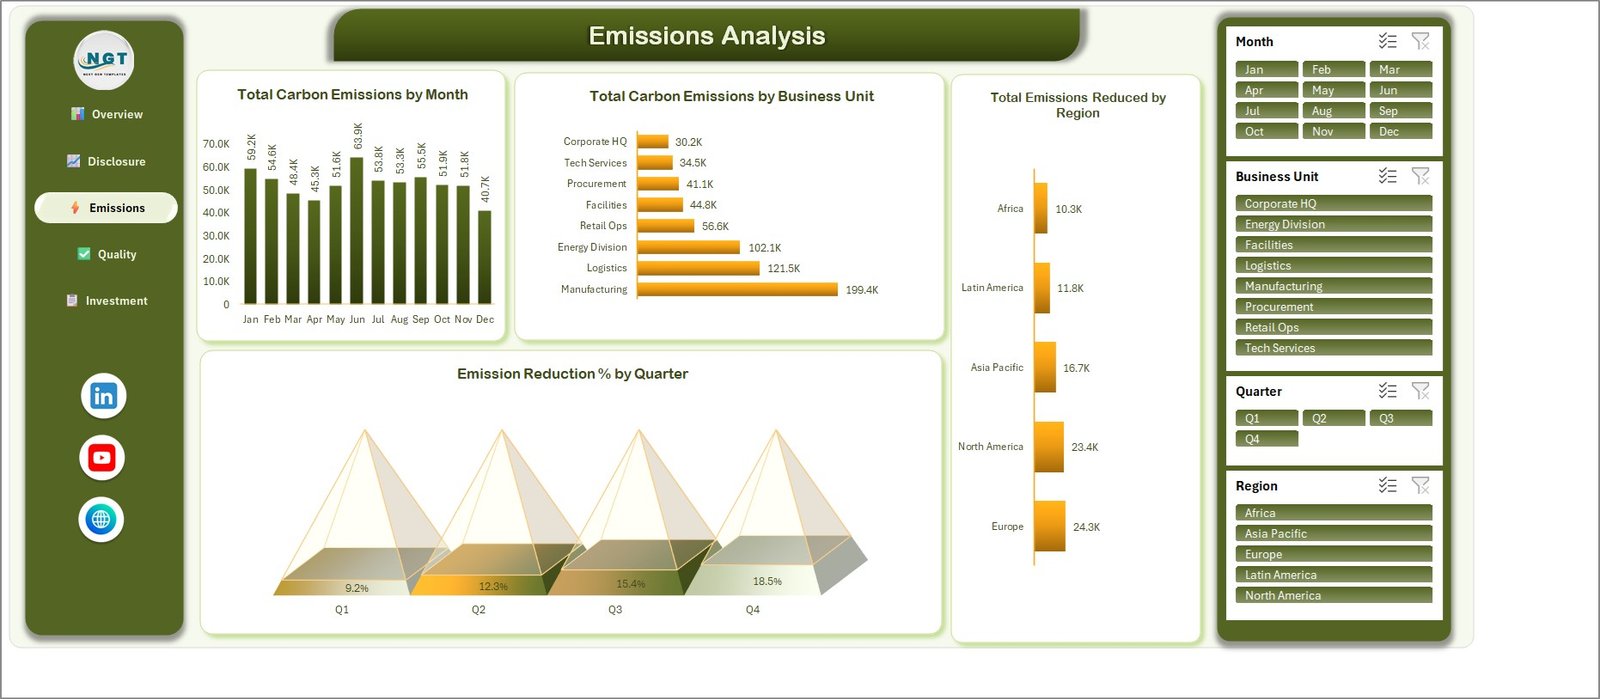
Total Carbon Emissions by Month, Total Carbon Emissions by Business Unit, Total Emissions Reduced by Region, and Emission Reduction % by Quarter. Worth repeating: the workbook sums and charts the emissions values you type in. It applies no emission factors, no unit conversion and no GHG Protocol scoping.
Page 4: Quality Assurance
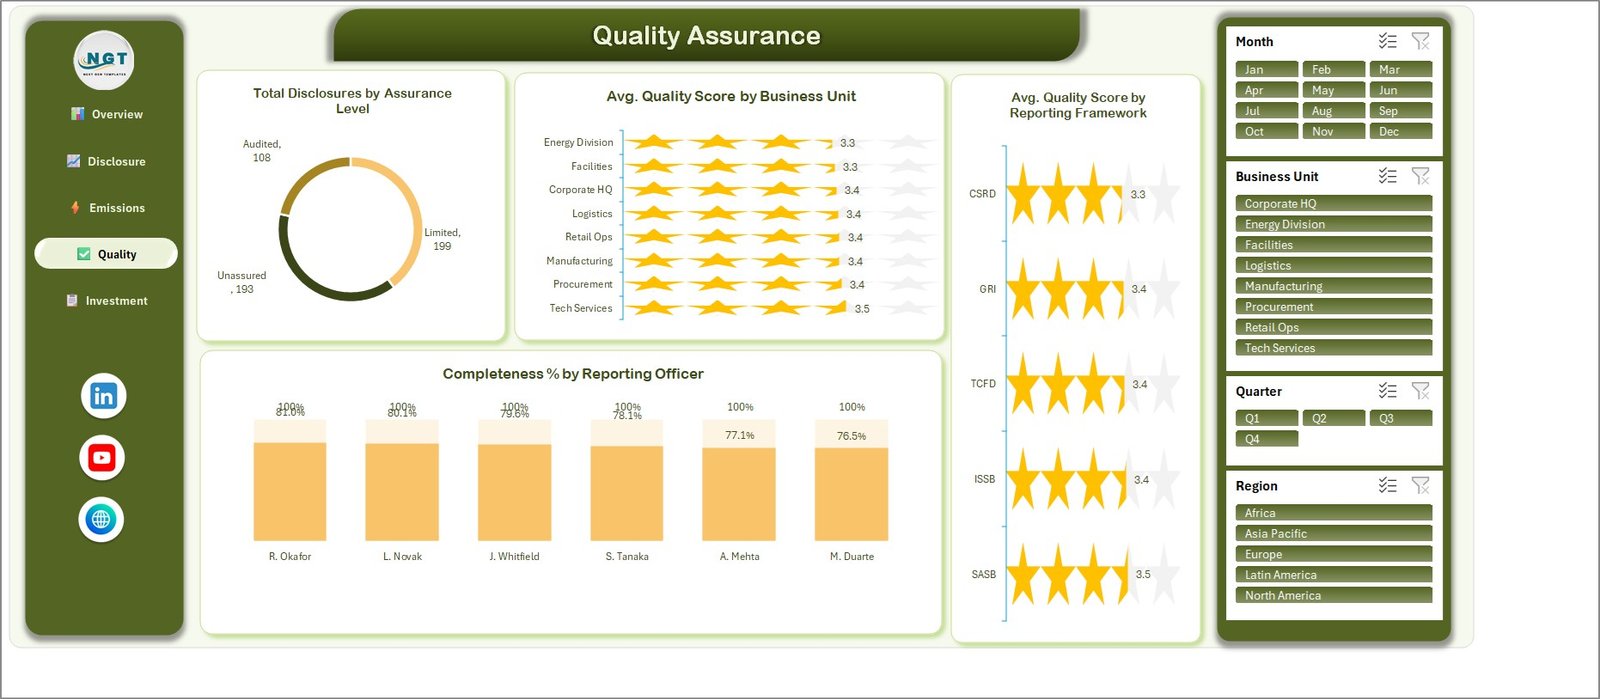
Total Disclosures by Assurance Level (Audited, Limited, Unassured), Avg. Quality Score by Business Unit, Avg. Quality Score by Reporting Framework, and Completeness % by Reporting Officer. The assurance level is a status you record about your own process — the workbook does not grant or verify it.
Page 5: Investment Analysis
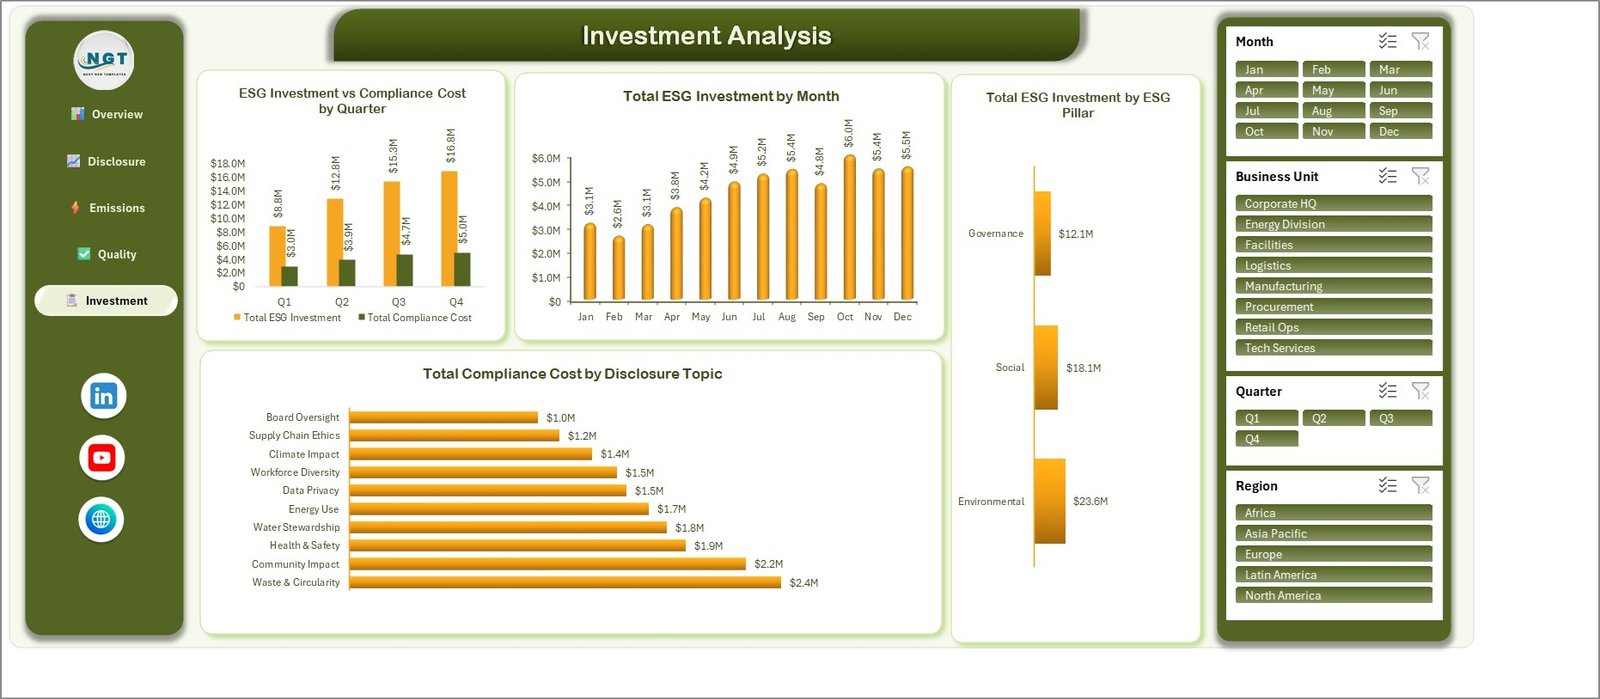
ESG Investment vs Compliance Cost by Quarter, Total ESG Investment by Month, Total ESG Investment by ESG Pillar (Environmental, Social, Governance) and Total Compliance Cost by Disclosure Topic. Currency formatting is applied only to the money columns, so the count and emissions KPIs stay unit-free.
Data sheet and Support sheet
The Data sheet holds 500 demo rows across those 20 columns — delete them and paste your own. The Support sheet holds the lookups and aggregations the charts point at; leave it alone unless you are adding a chart of your own.
ESG Reporting Dashboard in Excel vs. a Google Sheets Build vs. a Paid ESG Platform
| Feature | ESG Reporting Dashboard (Excel) | Google Sheets build | Workiva / Sphera / Watershed |
|---|---|---|---|
| Cost | ✅ $17.99 one-time | Free tool, days of build time | $15,000–$150,000+ per year |
| Platform | Excel 2016+ / 365, works offline | Browser only | Vendor cloud |
| Setup time | ✅ Under 10 minutes | Several days to build the charts | 6–16 week implementation |
| Real-time team collaboration | Via OneDrive / SharePoint co-authoring | ✅ Native | ✅ Native |
| Mobile access | Excel mobile app (view) | ✅ Browser | ✅ Native app |
| Customisable fields | ✅ Any column you like — it is your workbook | ✅ Yes | Vendor-defined schema |
| Produces an assurable statutory disclosure | ❌ No — internal tracking only | ❌ No | ✅ Yes, that is what you pay for |
| Third-party assurance workflow | ❌ Not included | ❌ No | ✅ Included |
| Year-1 cost at 5 users | ✅ $17.99 total | $0 + build time | $15,000+ |
For teams that need visibility over their internal ESG data collection without a six-figure platform contract, this workbook sits in the sweet spot — and hands tidy numbers to whoever prepares the real filing.
Who Should Use This Template
Perfect for:
- Sustainability and ESG coordinators at 50–2,000 person companies currently chasing submission status by email.
- Finance and internal-audit teams who need one view of what each business unit has submitted and how complete it is.
- Consultants organising a client’s internal data before a reporting cycle begins.
- Anyone who wants a clean Excel front end over ESG data that already lives in spreadsheets.
Not a fit if:
- You need a filing that is compliant with, or assured against, CSRD/ESRS, ISSB, GRI, SASB or the SEC climate rules.
- You need emissions calculated from activity data and emission factors — this is not a carbon accounting engine.
- You need audit trails, role permissions, SSO or SOC 2.
- You want live API feeds from utility, travel or ERP systems.
Real-World Use Cases
Priya coordinates sustainability reporting at a 600-person manufacturer. Every quarter she pastes the submission log from her eight business units into the Data sheet and opens Disclosure Progress before the steering committee meets. Overdue count, completeness by unit and the published trend are on one screen, replacing what used to be a long email thread.
Daniel is an internal auditor at a logistics group. He works from the Quality Assurance page to see how many disclosures the team has recorded as Audited versus Limited versus Unassured, and which reporting officers show the lowest completeness, so he can target his review time instead of sampling blindly.
Aisha runs a two-person ESG consultancy. She sends clients the workbook as an intake tool, gets clean 20-column data back in a consistent shape, and spends her billable hours on the actual disclosure rather than on reformatting spreadsheets.
Advantages of the ESG Reporting Dashboard
The economics are the obvious win: $17.99 once against $15,000 or more a year for a disclosure platform, for a job that is mostly internal coordination. But the practical advantage is that it is an ordinary Excel file. There is nothing to provision, no seats to buy, no vendor schema to bend your data into, and no one to ask before adding a column. It opens offline on any machine with Excel 2016 or later.
The four cross-page slicers are the part worth the money. Wiring one set of slicers to sixteen charts on five sheets is fiddly to build correctly, and it is already done. Setup genuinely is a paste-and-refresh: keep the 20 headings, keep Month, Year and Quarter populated, and every KPI and chart recalculates.
Opportunities for Improvement
Two things are worth knowing before you buy, and it is better you hear them here.
First, there is a cosmetic defect on the Quality Assurance page. On the Completeness % by Reporting Officer chart, the 100% target-cap data label prints on top of the actual value label for the first four bars, so “100%” and “81.0%” overlap and are hard to read. The underlying values are correct. Switching the cap series labels off, or dragging them, fixes it in about fifteen seconds.
Second, the 3-D pyramid charts — Published % by Reporting Framework on Disclosure Progress and Emission Reduction % by Quarter on Emissions Analysis — use very pale, semi-transparent fills. On a white card the lower-value pyramids read as almost invisible. They are legible enough with the data labels on, but a flat bar chart would communicate the same thing more clearly if you want to change them.
Beyond the cosmetics: there is no data validation on the Data sheet, so a misspelt business unit silently becomes a new chart category. There is no target or variance column, so you cannot show actual-versus-goal. And there is no dedicated Scope 1/2/3 structure — if you want GHG scopes you would add them as Disclosure Topic values yourself.
Best Practices
- Delete all 500 demo rows before entering real data, rather than editing over them. Leftover demo rows will quietly distort every KPI.
- Keep Business Unit, Region, Reporting Framework and Disclosure Topic spellings identical across rows — the charts group on exact text.
- Always populate Month, Year and Quarter. The slicers read those columns directly.
- Refresh with Ctrl+Alt+F5 after a large paste, then clear all slicer filters before reading the KPI cards.
- Keep one workbook per reporting cycle and archive the previous one, so year-on-year comparisons stay clean.
- Record what the numbers mean somewhere. The workbook stores figures, not the methodology behind them — and for a disclosure, methodology is what gets questioned.
Explore Relevant Templates
NextGenTemplates already sells several ESG templates, and they are genuinely different builds rather than other editions of this one:
- Environmental, Social, and Governance (ESG) Dashboard in Excel — a broader three-pillar scorecard rather than a disclosure-cycle tracker.
- ESG Environmental Dashboard in Excel — environmental metrics only, no disclosure status or assurance view.
- ESG Compliance KPI Dashboard in Excel — a KPI-scorecard layout with targets and traffic lights.
- ESG Investment Firms Dashboard in Excel — built for fund managers screening portfolios.
- Green Building Certification Dashboard in Excel and the Climate Tech Startups Dashboard in Excel if your focus is buildings or investment pipeline.
- Prefer another tool? There is a Sustainability and ESG Dashboard in Google Sheets and an ESG KPI Dashboard in Power BI.
Buying more than one? The Energy & ESG Sustainability Bundle packages eight Excel and Power BI templates at a 50% saving.
Frequently Asked Questions
Does this make our ESG report compliant or assured?
No. The ESG Reporting Dashboard in Excel is an internal tracking workbook. It does not produce a compliant or assurable disclosure, does not certify conformance with any framework, and does not constitute assurance, audit or verification of any kind. Use a disclosure platform and an assurance provider for the filing itself.
Does the workbook calculate carbon emissions?
No. Carbon Emissions and Emissions Reduced are columns you fill in yourself. The workbook sums, groups and charts those buyer-entered values. It applies no emission factors, no unit conversions and no GHG Protocol scope logic anywhere.
Are the numbers in the screenshots real?
No. The 500 records, the 630.2K emissions total and the $53.8M investment figure are demo data shipped so the charts render on first open. Delete the demo rows, paste your own, and every KPI card and chart recalculates immediately.
What do GRI, TCFD, ISSB, CSRD and SASB mean in this template?
They are text values in a Reporting Framework column that you tag each row with, so progress can be split by framework. The workbook does not implement those standards, does not check your data against them, and makes no claim of conformance.
How long does setup take?
Under 10 minutes. Open the .xlsx, delete the 500 demo rows on the Data sheet, paste your own records under the same 20 headings, press Ctrl+Alt+F5, and all five pages and sixteen charts update together.
How does this compare to a paid ESG platform?
Workiva, Sphera and Watershed cost $15,000 or more per year and produce an assurable disclosure with a full audit workflow. This is a $17.99 one-time Excel workbook for internal tracking. They solve different problems, and this template does not pretend to solve theirs.
Do I need macros or add-ins?
No. The ESG Reporting Dashboard in Excel is a plain .xlsx with no VBA, no Power Query and no add-ins. Slicers require a desktop build of Excel 2016 or later; Excel for the web displays the pages but slicer behaviour is limited.
About the Author
Built by PK — Microsoft Certified Professional with 15+ years of Excel, Google Sheets and Power BI experience. Founder of NextGenTemplates, reaching 300K+ subscribers across YouTube channels. Every template is hand-built and tested before release.
Conclusion
If your ESG reporting problem is coordination — who has submitted, how complete it is, what is overdue, which unit is behind — this workbook solves it for the price of a lunch and about ten minutes of setup. If your problem is producing an assured statutory disclosure, it does not, and no honest spreadsheet does.
👉 Click here to purchase the ESG Reporting Dashboard in Excel
Instant download · One-time payment · No subscription · Lifetime access
For step-by-step Excel tutorials, visit Youtube.com/@PKAnExcelExpert.
Last updated: September 2026