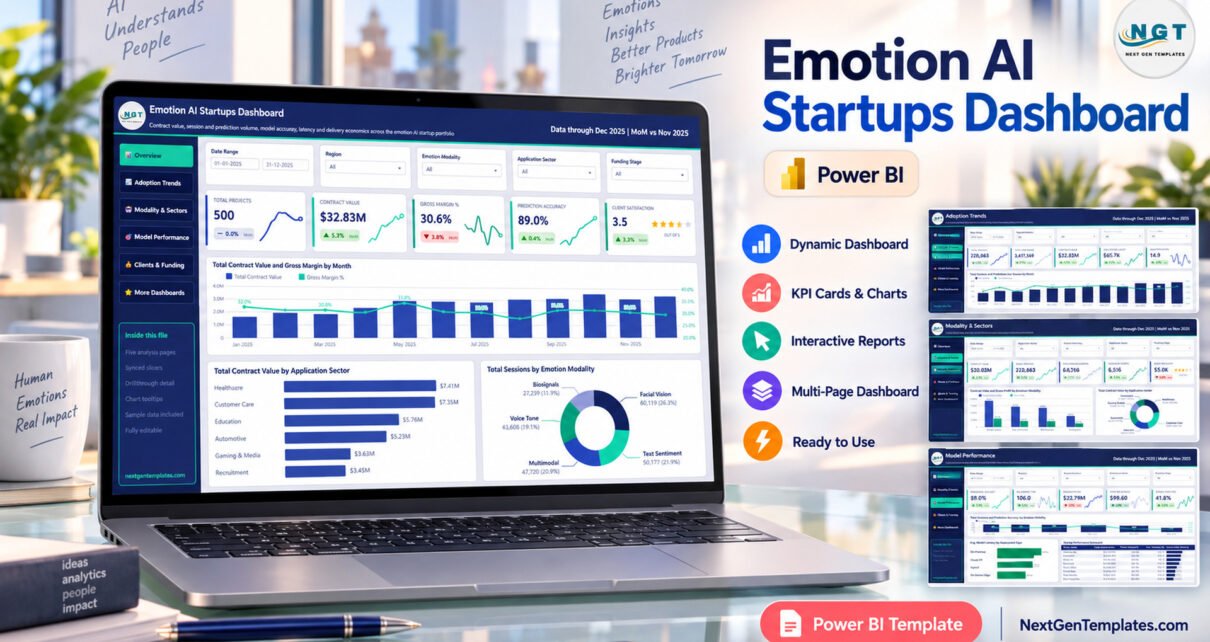
The Emotion AI Startups Dashboard in Power BI is a five-page Power BI report built over a 500-row, 18-column sample table spanning one calendar year, January to December 2025. Its visuals reference 32 distinct measure names, five synced slicers sit on every page, and behind the charts there is a hidden drillthrough page and two 280×360 tooltip pages. Every page uses a 1280×720 canvas set to Fit to Page.
Before anything else, the important part. This template is a reporting layer over data you supply. It performs no emotion detection, no affect recognition, no facial analysis, no voice analysis and no biometric processing of any kind. It makes no claim about whether emotion recognition is scientifically valid or accurate. It does not assess compliance with the EU AI Act, GDPR, BIPA or any other AI or privacy regulation, and it offers no investment advice. Every funding figure, contract value and company name shipped in the file is invented demo data you are expected to replace.
Key Features of the Emotion AI Startups Dashboard in Power BI
- Five analysis pages plus an upsell page. Overview, Adoption Trends, Modality & Sectors, Model Performance and Clients & Funding are the analysis pages. A sixth page, “Get More Dashboards”, is a promotional page and is not part of the report.
- Five synced slicers on each page. Date Range, Region, Emotion Modality and Application Sector appear on all five; the fifth slot changes — Funding Stage on Overview and Model Performance, Deployment Type on Adoption Trends, Project Status on Modality & Sectors, Product Lead on Clients & Funding.
- Hidden pages that are already wired up. A “Details” drillthrough page is filtered on Startup Name, Region and Emotion Modality. Two tooltip pages, “Metric Detail” and “Trend Detail”, carry three cards each plus a regional bar chart.
- 32 distinct measure names referenced by the visuals, including Total Contract Value, Gross Profit, Gross Margin %, Prediction Accuracy %, Predictions Per Session, Avg. Model Latency, Contract Value Per Client, Cost Per Session, Total Enterprise Clients and Completion Rate %. The model file itself is compressed, so this is a count of what the report references rather than a claim about the model’s total.
- A 500-row sample table with 18 columns — Startup ID, Record Date, Startup Name, Region, Emotion Modality, Application Sector, Funding Stage, Product Lead, Deployment Type, Project Status, Sessions Analyzed, Predictions Made, Accurate Predictions, Model Latency Ms, Enterprise Clients, Contract Value, Delivery Cost and Client Satisfaction.
- Five regions, five modalities, six sectors, five funding stages, four deployment types and five project statuses in the sample data, so every slicer has something to filter on out of the box.
Dashboard Pages Explanation
Page 1: Overview
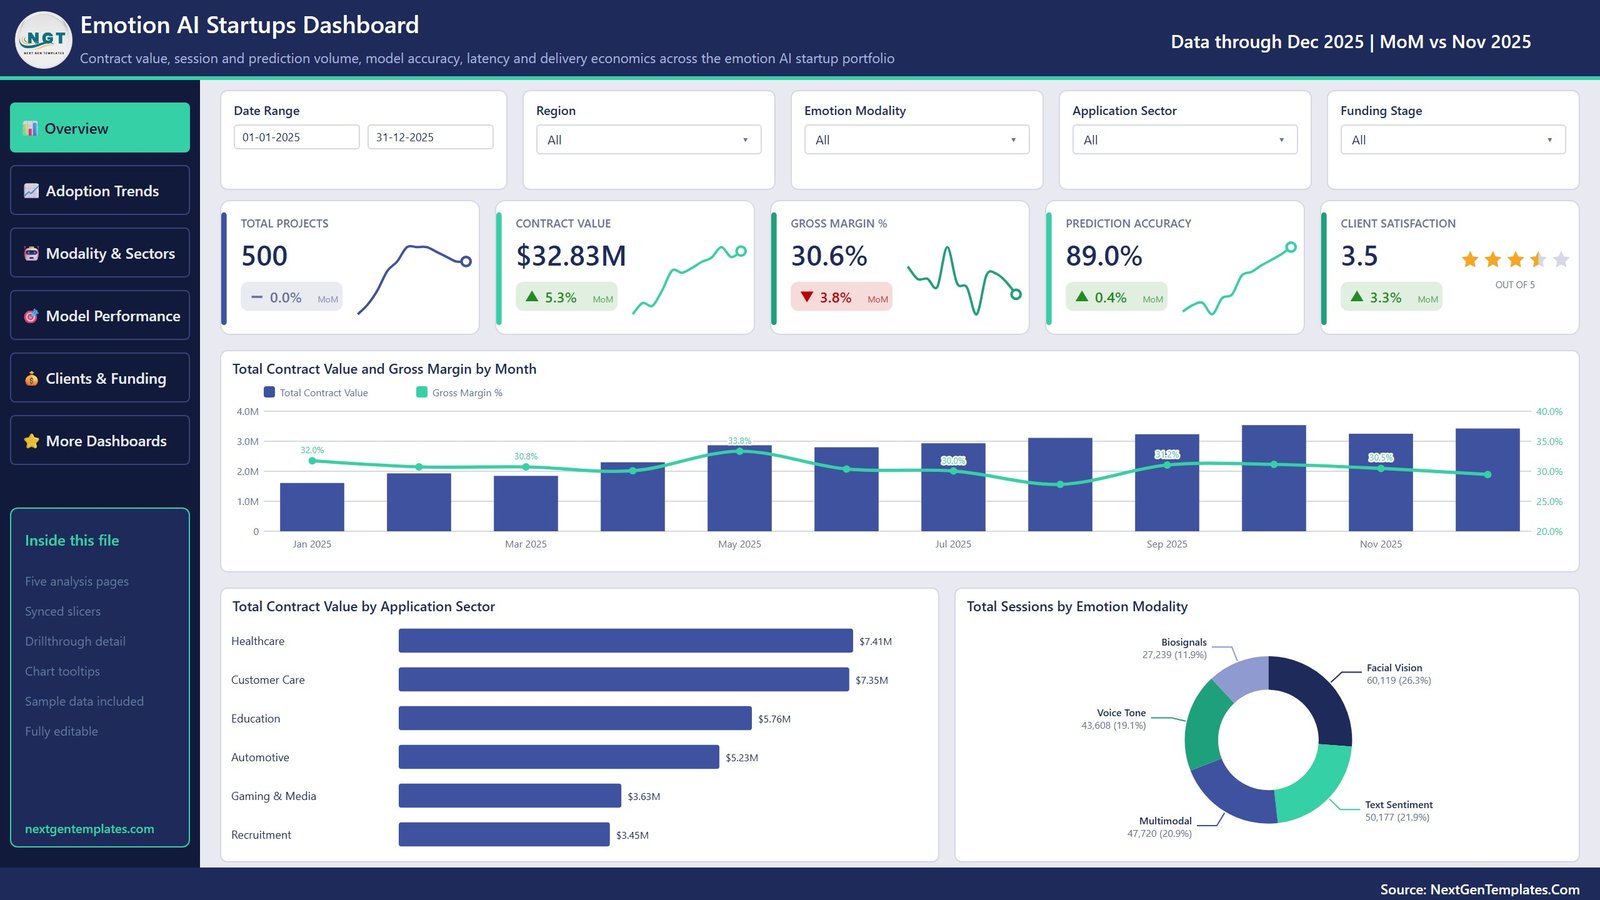
Five KPI cards run across the top: Total Projects, Contract Value, Gross Margin %, Prediction Accuracy and Client Satisfaction, each with a month-on-month delta and a sparkline. Below them sit Total Contract Value and Gross Margin by Month, Total Contract Value by Application Sector and Total Sessions by Emotion Modality.
Page 2: Adoption Trends
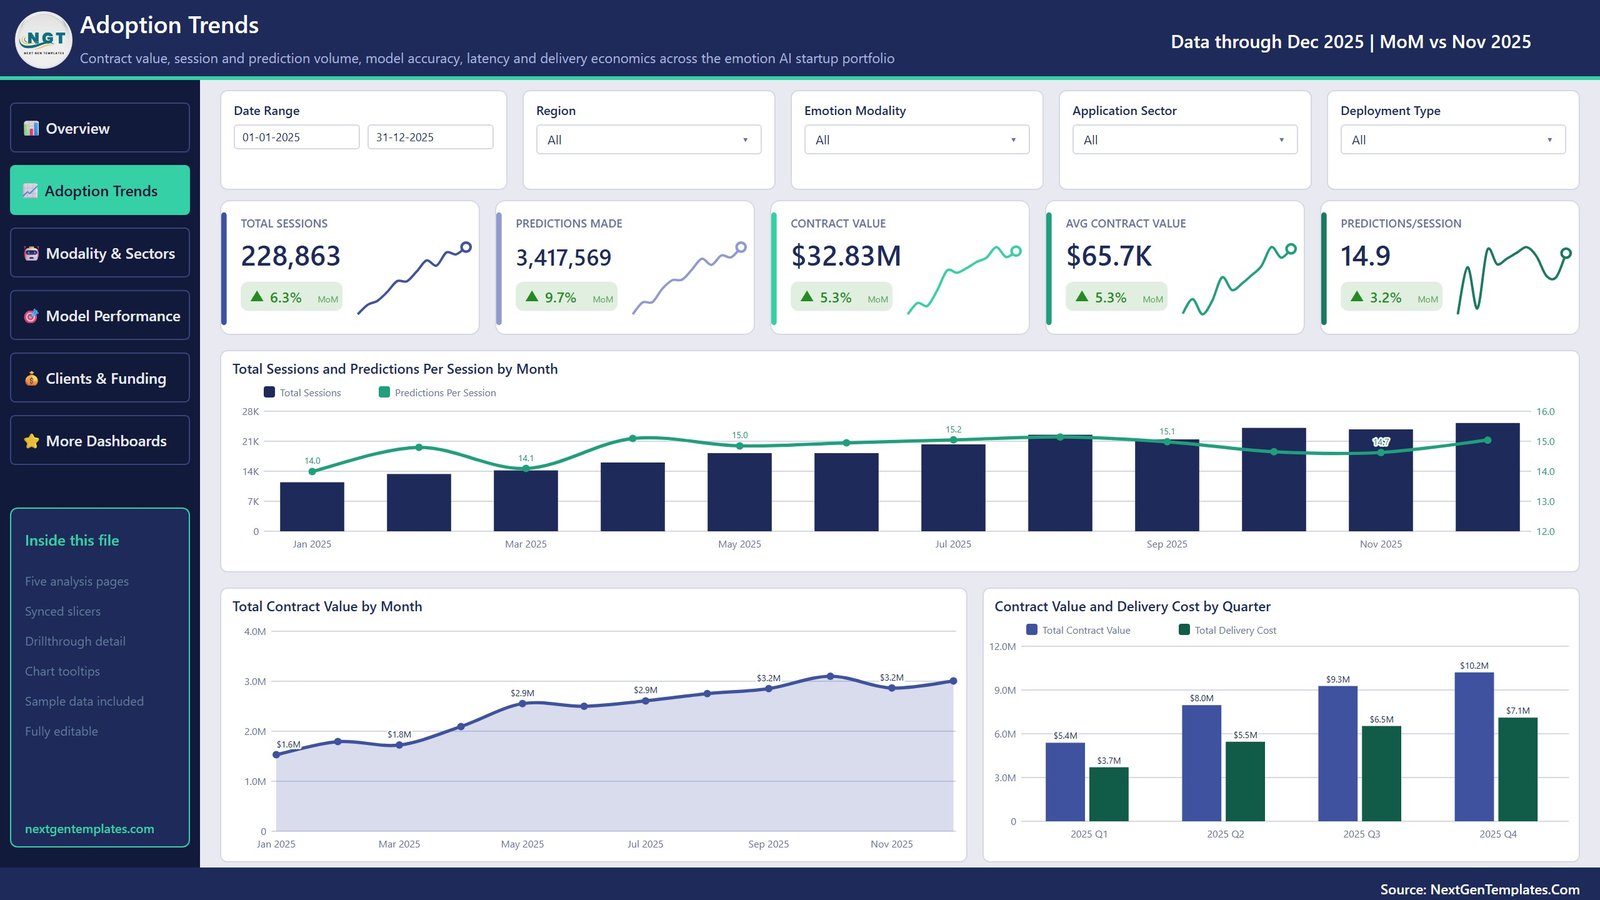
Cards for Total Sessions, Predictions Made, Contract Value, Avg Contract Value and Predictions/Session sit above Total Sessions and Predictions Per Session by Month, Total Contract Value by Month, and Contract Value and Delivery Cost by Quarter.
Page 3: Modality & Sectors
Cards for Contract Value, Gross Profit, Total Sessions, Enterprise Clients and Value Per Client sit above Contract Value and Gross Profit by Emotion Modality, Total Contract Value by Application Sector, and a matrix of Total Contract Value by Emotion Modality and Deployment Type.

Page 4: Model Performance
Cards for Prediction Accuracy, Avg Latency (ms), Delivery Cost, Cost Per Session and Completion Rate sit above Total Sessions and Prediction Accuracy by Emotion Modality, Avg. Model Latency by Deployment Type, and a Startup Performance Scorecard table with an in-cell contract bar.

Page 5: Clients & Funding
Cards for Enterprise Clients, Contract Value, Value Per Client, Avg Contract Value and Client Satisfaction sit above Total Contract Value and Gross Margin by Funding Stage, Total Projects by Project Status, and a Regional Client Scorecard table.

Emotion AI Startups Dashboard vs. Tableau / Qlik vs. PitchBook / CB Insights
| Feature | Emotion AI Startups Dashboard (Power BI) | Tableau / Qlik build | PitchBook / CB Insights |
|---|---|---|---|
| Cost | $17.99 one-time | $75+ / user / month for Creator seats | $12,000-$30,000+ / year |
| Platform | Power BI Desktop (free) | Tableau Desktop or Qlik Sense | Vendor web portal only |
| Setup time | Under 10 minutes | Days to build five pages from scratch | Instant, but the model is fixed |
| You own the data | Yes — your own table | Yes | No — vendor data and vendor definitions |
| Customisable fields | All 18 columns editable | Editable | Fixed schema |
| Drillthrough and tooltip pages | Included and pre-wired | Build them yourself | Not applicable |
| Works offline | Yes, a .pbix on your machine | Yes | No |
| Year-1 cost at 5 users | $17.99 total | $4,500+ | $12,000+ |
| Market research included | No — you supply the figures | No | Yes, that is the product |
For teams that already hold their own pipeline or delivery figures and want them charted properly without a five-figure research subscription, this template sits in the sweet spot. If what you actually need is the research data itself, buy a research service.
Who Should Use This Template
Perfect for:
- Venture and corporate-venture analysts who already keep an emotion-AI or affective-computing watchlist in a spreadsheet
- Product and partnership teams at an AI vendor comparing their own latency, accuracy and contract figures across modalities and deployment types
- Consultants and sector writers who want a repeatable five-page report to repoint at a new dataset each quarter
- Power BI learners who want a finished, well-structured file to take apart
Not a fit if:
- You wanted software that detects or measures emotions — this file does none of that
- You expected real market, funding or valuation data — every shipped figure is invented
- You need a compliance assessment against the EU AI Act, GDPR or BIPA
- You want an investment signal rather than a reporting layer
Real-World Use Cases
Priya is an associate at an early-stage deep-tech fund. She maintains her own sheet of affective-computing companies in the pipeline and swaps it into the file each month, so partners see contract value by funding stage and value per client without her rebuilding a single chart.
Daniel runs partnerships at a conversational-AI vendor. He repoints the model at his own delivery data and uses the Model Performance page to compare average latency across Cloud API, Hybrid, On-Premise and On-Device Edge deployments before committing to a rollout.
Ana writes a quarterly sector newsletter. She loads her own collected figures, exports the five pages as images, and uses the hidden drillthrough page for the individual company profiles she writes up in detail.
Advantages of the Emotion AI Startups Dashboard in Power BI
The saving is mostly time rather than licence cost: building five linked pages with synced slicers, a drillthrough page and two custom tooltip pages is a day or two of work for someone who already knows Power BI, and considerably longer for someone who does not. Because the KPI cards are driven by measures rather than typed numbers, swapping the source table changes every figure on every page at once.
The second advantage is honesty of scope. The file does one thing — it charts numbers you already have — and the page structure makes that obvious to whoever you hand the report to. Power BI Desktop itself is a free download from Microsoft, so there is no seat cost to circulate the .pbix internally.
Opportunities for Improvement
Two things are worth knowing before you buy. First, on the exported page images a handful of percentage data labels on the combo charts sit on top of the column tops and are hard to read — the Gross Margin % labels around July, September and November on the Overview page, one Predictions/Session label on Adoption Trends, several accuracy labels on Model Performance, and the Series B margin label on Clients & Funding. They read correctly on screen, and the labels can be switched off per visual in Power BI Desktop, but the shipped images show the collision rather than hiding it.
Second, the sample data is deliberately generic: eight invented company names spread over five regions, so the scorecard tables are illustrative rather than representative. Anyone using this as a market view must bring their own figures. And there is no data-refresh scheduling built in — that is a Power BI Service concern, not a template one.
Best Practices
- Keep the 18 column headers spelled exactly as shipped. The measures reference them by name, and renaming one silently breaks the visuals that use it.
- Replace the sample rows rather than appending to them, so no invented company survives into your published report.
- Edit the header subtitle and the “Data through Dec 2025” caption to match your real reporting period.
- If you present externally, restate on the cover that the figures are your own collected data and that the report performs no emotion analysis.
- Use the Region and Emotion Modality slicers together before reading the Model Performance page — accuracy and latency vary sharply by modality in any real dataset.
Explore Relevant Templates
- Emotion AI Startups Dashboard in Excel — the same subject built as an Excel workbook, for teams without Power BI Desktop.
- Digital Innovation Hubs Dashboard in Power BI — the same five-page structure applied to innovation-hub reporting.
- Documentary Channels Dashboard in Power BI — a media-sector build on the same layout.
- Drone Services Dashboard in Power BI — operations-side reporting with the same navigation rail.
- Fire Safety Services KPI Dashboard in Power BI — the KPI-dashboard line, a different structure to this one.
- Disaster Relief Dashboard in Power BI — another sector build worth comparing.
Frequently Asked Questions
Does this dashboard detect or analyse emotions?
No. The Emotion AI Startups Dashboard in Power BI is a report over data you supply. It performs no emotion detection, no affect recognition, no facial or voice analysis and no biometric processing. It charts figures you have already collected about companies working in that market.
Does it claim emotion recognition is accurate or scientifically valid?
No. The template takes no position on that question. The Prediction Accuracy figure on the Model Performance page is simply a ratio calculated from two columns in your own table, or from the invented sample rows shipped with the file.
Are the startups, funding rounds and market figures real?
No. All 500 rows are demo data and the eight company names are invented placeholders. Nothing in the file is research, a valuation, or investment advice, and no association with any real vendor is implied.
Does it help with EU AI Act, GDPR or BIPA compliance?
No. The EU AI Act restricts emotion inference in workplaces and education, and biometric data is regulated under GDPR and laws such as BIPA. This template assesses none of that and provides no compliance function whatsoever.
How is this different from the KPI Dashboard and KPI Scorecard versions?
They are separate products with similar names. This is the Power BI dashboard edition: five analysis pages, synced slicers, a drillthrough page and two tooltip pages. The KPI Dashboard and KPI Scorecard lines use a different page structure and a different measure set.
How long does setup take?
Under ten minutes when your columns already match. Replace the rows in Data.xlsx, repoint the source in Power BI Desktop, and refresh — all five pages, the drillthrough page and both tooltip pages update at once.
What is actually in the download?
A zip containing three files: the .pbix report, Data.xlsx with the 500 sample rows, and a Power BI Dashboard user manual in PDF.
About the Author
Built by PK — Microsoft Certified Professional with 15+ years of Excel, Google Sheets and Power BI experience. Founder of NextGenTemplates, reaching 300K+ subscribers across YouTube channels. Every template is hand-built and tested before release.
Conclusion
If you already keep your own figures on companies in this market, the Emotion AI Startups Dashboard in Power BI turns them into five linked pages in about ten minutes, with the drillthrough and tooltip plumbing already done. If you were hoping for market research, or for software that measures emotions, this is not that — and it says so on every page of this review.
👉 Click here to purchase the Emotion AI Startups Dashboard in Power BI
Instant download · One-time payment · No subscription
🎥 For step-by-step video tutorials, visit Youtube.com/@PKAnExcelExpert
Last updated: September 2026