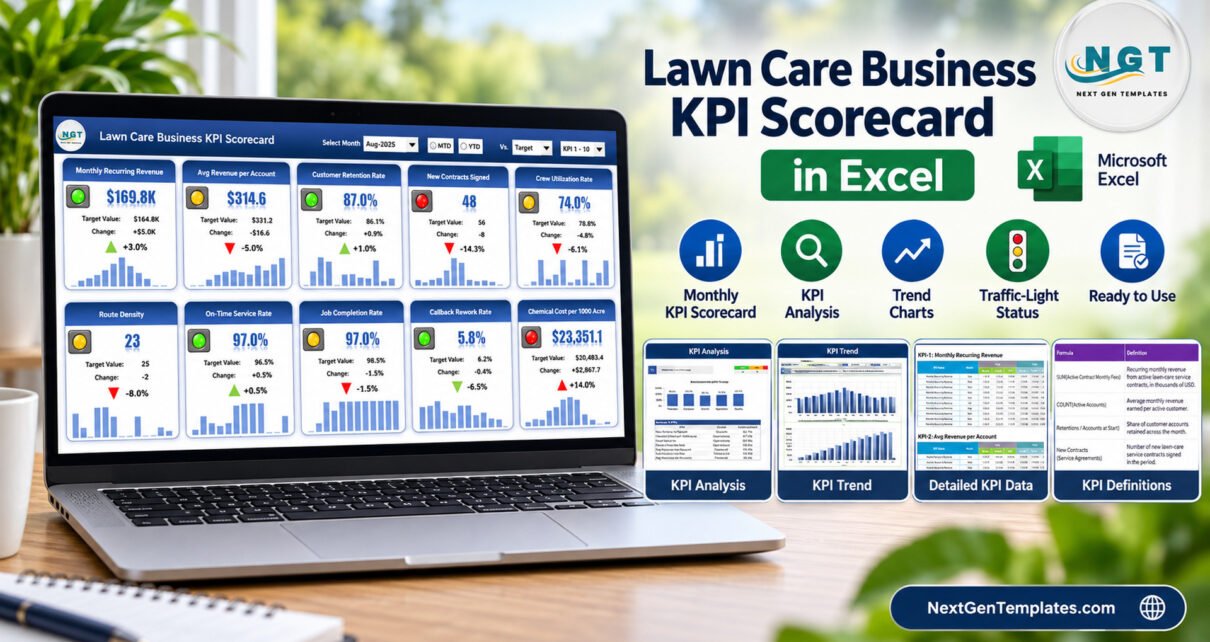
The Lawn Care Business KPI Scorecard in Excel is a ready-made monthly scorecard with 10 KPIs in 5 groups, 10 traffic-light tiles, a KPI Analysis page, a four-chart KPI Trend page and room for 20 KPIs in a single .xlsx file. The sample workbook opens on August 2025 and shows 4 Green, 4 Amber and 2 Red KPIs against target.
Most lawn care owners already have numbers scattered across a scheduling app, an accounting package and a notebook in the truck. What they rarely have is one page that says, at a glance, which parts of the business beat the plan last month and which did not. This scorecard gives you that page without macros, add-ins or a subscription. It is the Excel KPI Scorecard edition, a different template from the Lawn Care Business KPI Dashboard, which is still in preparation.
Key Features of the Lawn Care Business KPI Scorecard in Excel
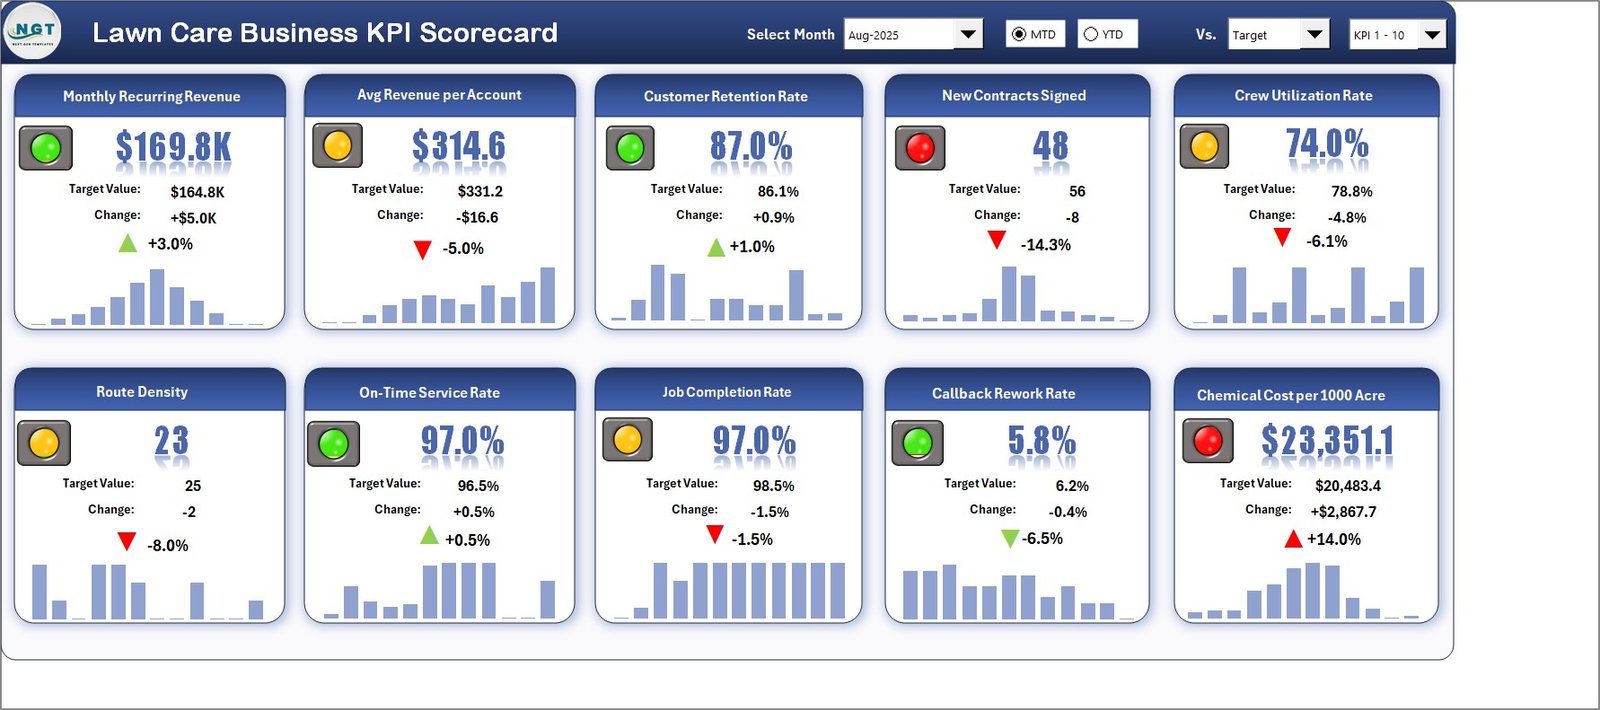
- 10 lawn care KPIs: Monthly Recurring Revenue, Avg Revenue per Account, Customer Retention Rate, New Contracts Signed, Crew Utilization Rate, Route Density, On-Time Service Rate, Job Completion Rate, Callback Rework Rate and Chemical Cost per 1000 Acre.
- Five KPI groups: Financial (2), Customer (1), Growth (1), Operations (3) and Quality (3).
- Direction-aware lights: 8 KPIs are upper-the-better and 2 are lower-the-better, so a lower callback rate or a lower chemical cost turns green.
- Header controls: Select Month, an MTD / YTD switch, a Vs. dropdown (Target, PY or Prior Month) and a KPI 1-10 / KPI 11-20 set picker.
- Editable bands: by default Green means at or above target, Amber within 10% and Red more than 10% off.
- No macros: formulas, conditional formatting, camera pictures and sparklines only.
The month picker is index-driven: the dropdown stores a month number, the workbook turns it into a month name, and every tile looks its actual and comparison values up with SUMIFS. Change the month and every tile, light and sparkline moves together.
Scorecard Sheets Explanation
The workbook has 9 visible sheets. You type on Input Data and KPI Definition; everything else calculates.
Home
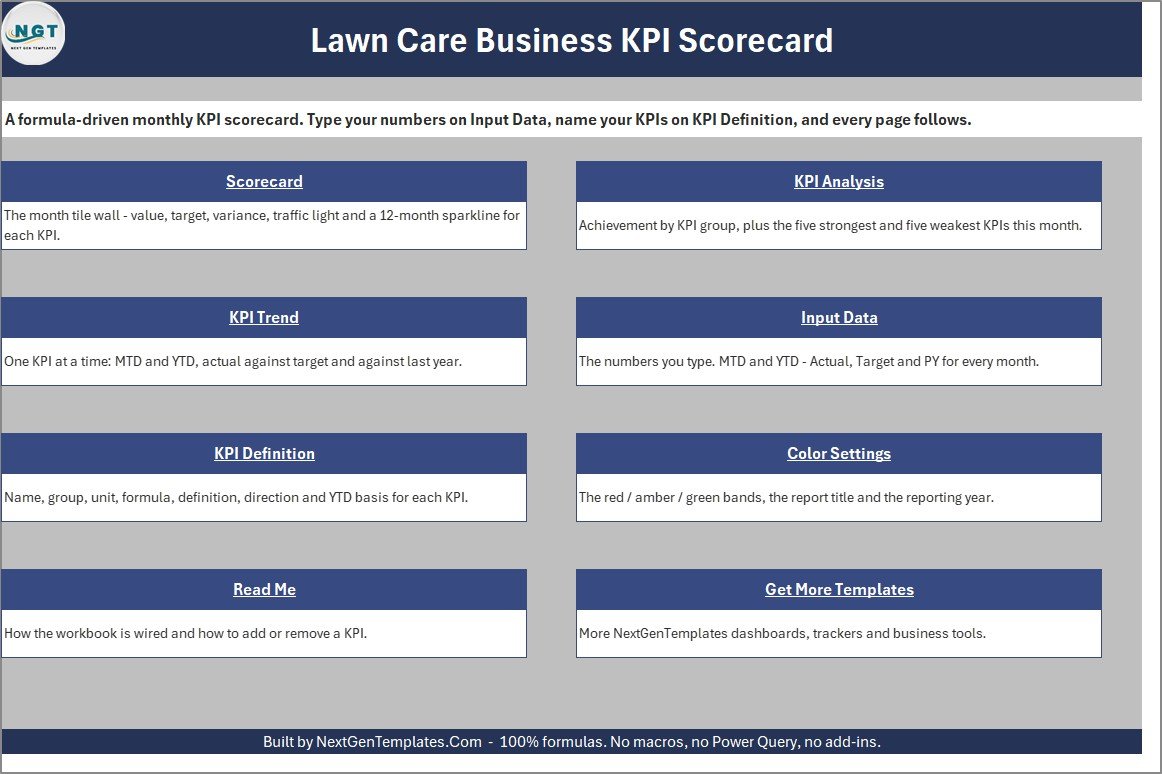
Eight linked buttons with a one-line description of each sheet, so a new user knows where to start.
Scorecard
Ten tiles in two rows of five. Each tile shows the value, target, change, an up or down arrow, a traffic light and a 12-month sparkline. In the August 2025 sample, Monthly Recurring Revenue reads $169.8K against $164.8K (+3.0%, green), Crew Utilization Rate reads 74.0% against 78.8% (amber) and Chemical Cost per 1000 Acre reads $23,351.1 against $20,483.4 (+14.0%, red).
KPI Analysis
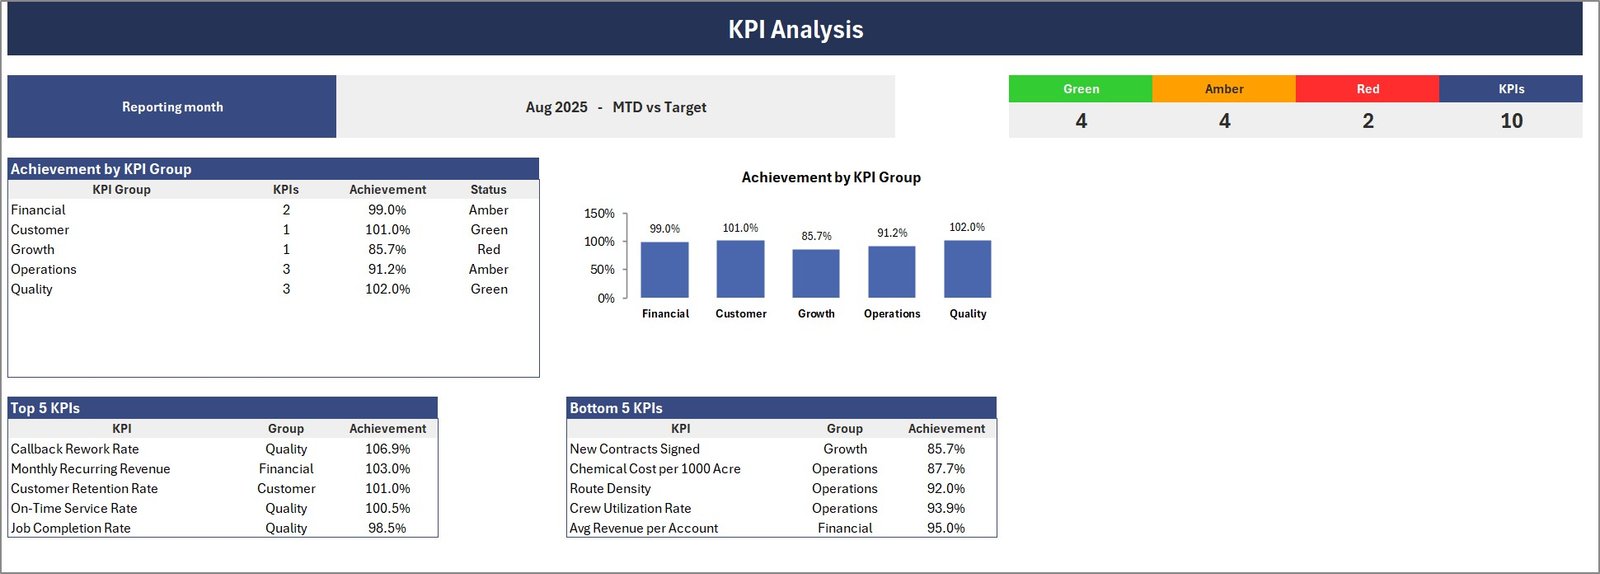
Counters for Green, Amber, Red and total KPIs; an Achievement by KPI Group table and chart; and Top 5 and Bottom 5 KPI tables. In the sample, Quality leads at 102.0% and Growth trails at 85.7%.
KPI Trend
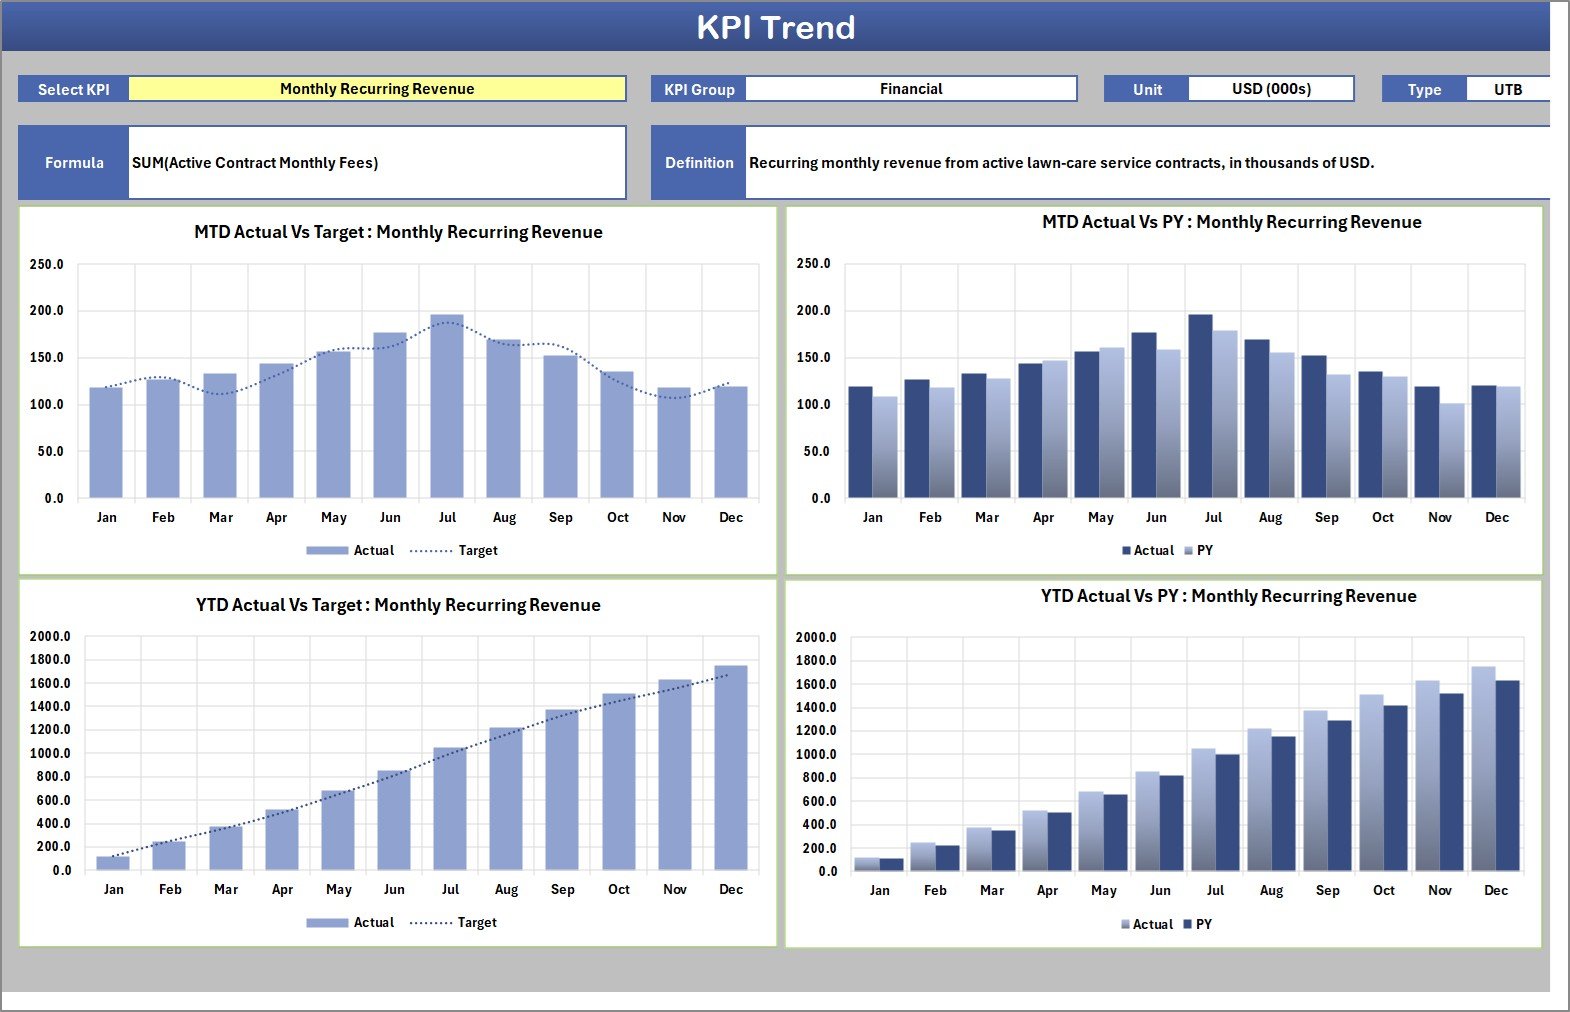
Pick one KPI to see its group, unit, type, formula and definition, then four charts: MTD Actual vs Target, MTD Actual vs PY, YTD Actual vs Target and YTD Actual vs PY.
Input Data
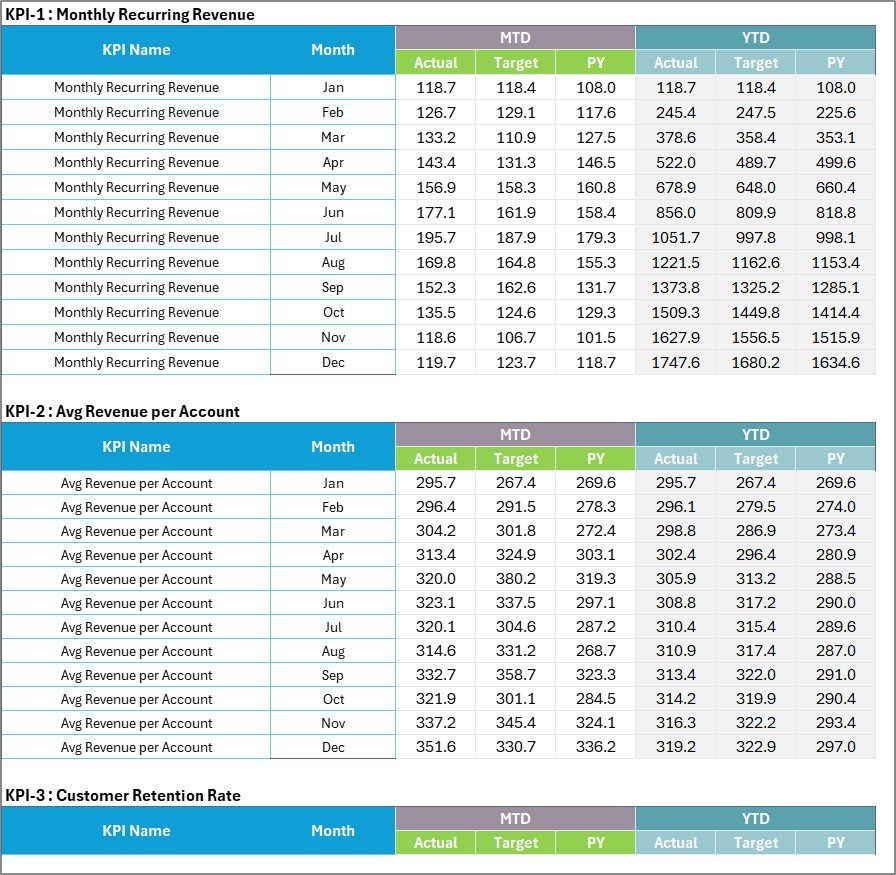
One numbered block per KPI with twelve month rows: MTD Actual, Target and PY, then YTD Actual, Target and PY. There are 20 blocks in total.
KPI Definition
Group, name, unit, formula, definition, UTB or LTB type and YTD basis for each KPI, plus a Check column that flags duplicate names.

Color Settings, Read Me and Get More Templates
Color Settings holds the RAG bands, report title and reporting year. Read Me explains every control in plain language, and Get More Templates points to other NextGenTemplates product families.

Excel Scorecard vs. Google Sheets vs. Field Service Software — Feature Comparison
| Feature | Lawn Care KPI Scorecard (Excel) | Build-your-own Google Sheets scorecard | Field service software (Jobber / LMN / Service Autopilot) |
|---|---|---|---|
| Cost | ✅ One-time purchase | Free tool, hours of build time | Recurring monthly subscription |
| Platform | Desktop Microsoft Excel | Browser | Web and mobile app |
| Setup time | ✅ Minutes to rename KPIs | Days to design | Onboarding and import |
| Monthly traffic-light KPIs | ✅ Built in | Only if you build them | Depends on plan |
| Target / PY / prior-month views | ✅ One dropdown | Manual formulas | Varies |
| Scheduling, routing, invoicing | ❌ Not included | ❌ Not included | ✅ Core feature |
| Real-time collaboration | Shared file, one editor at a time | ✅ Live co-editing | ✅ Multi-user |
| Mobile access | View only | ✅ Yes | ✅ Yes |
| Year-1 cost at 5 users | ✅ One purchase | Staff time | Subscription every month |
For owners who want a clear monthly KPI review without adding another subscription, this scorecard sits in the sweet spot.
Who Should Use This Template
Perfect for:
- Residential and commercial lawn care or landscaping owners who review results monthly
- Operations managers tracking crews, routes and callbacks
- Bookkeepers and consultants preparing monthly KPI packs for trade clients
Not a fit if:
- You need scheduling, routing, quoting or invoicing
- You want a live feed from other software instead of typed or pasted figures
- You only use Excel for the web or a phone
Real-World Use Cases
A four-crew residential lawn care owner fills in last month’s figures on the first Monday. New Contracts Signed (48 against 56) and Chemical Cost per 1000 Acre both show red, so the crew-lead meeting starts with sales follow-up and supply spend.
An operations manager at a commercial grounds company sets the Vs. dropdown to Prior Month to check whether Route Density and Crew Utilization Rate recovered, then uses KPI Trend to compare the year with last year.
A bookkeeper with several landscaping clients keeps a copy per client, renames the KPIs to what each client measures and sends the KPI Analysis page as the monthly summary.
Advantages of This Scorecard
- One page for the whole business: revenue, customers, growth, operations and quality side by side.
- Honest colours: lower-the-better KPIs are scored the right way round.
- No lock-in: a plain .xlsx that you own, with no macros to trust.
- Grows with you: ten spare KPI slots and a set picker to show them.
Opportunities for Improvement
- YTD figures are typed rather than calculated, because the right roll-up differs by KPI.
- One reporting year per file, monthly totals only, no per-crew breakdown.
- Chemical Cost per 1000 Acre is only a cost figure; the workbook keeps no application, rate or regulatory records.
- A zero comparison value reads n/a, so a zero target cannot be scored.
- The header controls need desktop Excel, as Microsoft’s form controls overview explains.
- Cosmetic: Read Me says the month list reads “Sep-25”, while it actually shows “Aug-2025”.
Best Practices
- Enter targets for the whole year in January so every month has a comparison value.
- Record the YTD rule for each KPI in the YTD Basis column and stick to it.
- Keep KPI names unique; the Check column warns you if two match.
- Review the bands on Color Settings once a season. Microsoft’s guide to conditional formatting explains how the colours are applied.
Explore Relevant Templates
Want more than a monthly scorecard? Read our guides to the Landscaping Dashboard in Excel, the Landscaping Dashboard in Power BI and the Garden Center Dashboard in Excel. For other trades using the same scorecard layout, see the CCTV Installation KPI Scorecard in Excel and the Elevator Maintenance KPI Scorecard in Excel.
On the store, the Swimming Pool Service KPI Scorecard in Excel covers another field service trade.
Frequently Asked Questions
What does the Lawn Care Business KPI Scorecard in Excel include?
One .xlsx workbook with Home, Scorecard, KPI Analysis, KPI Trend, Input Data, KPI Definition, Color Settings, Read Me and Get More Templates sheets, plus a PDF user manual. It ships with 10 sample KPIs and twelve months of fictional figures.
Is this the same product as the Lawn Care Business KPI Dashboard?
No. The scorecard is a 10-tile monthly wall with analysis, trend and settings sheets. The KPI Dashboard edition is a separate template with its own layout and KPI list, and it is still in preparation.
Does it need macros?
No. The workbook uses formulas, conditional formatting, camera pictures and sparklines only. Open it in desktop Microsoft Excel; the month dropdown and MTD / YTD buttons are form controls that Excel for the web cannot operate.
How long does setup take?
Usually under an hour. Set the year and title, rename the KPIs, and type twelve months of actual, target and PY figures. Every page updates as soon as the numbers are in.
How does it compare with Jobber or LMN?
Those apps run scheduling, routing and invoicing on a subscription. This scorecard does none of that; it is a one-time purchase for a monthly KPI review that you fill from the reports your other systems already produce.
Can I add my own KPIs?
Yes. Type a new KPI on the next free row of KPI Definition and fill its numbered block on Input Data. The workbook holds 20 KPIs, and the set picker switches the Scorecard between KPI 1-10 and KPI 11-20.
About the Author
Built by PK and the NextGenTemplates team, who publish Excel, Google Sheets and Power BI tutorials on YouTube. Every template is built and checked before release.
Conclusion
If you run a lawn care business and want one honest monthly view of revenue, customers, crews and quality, this scorecard gives you that page in minutes, using the numbers you already have.
👉 Click here to Purchase the Lawn Care Business KPI Scorecard in Excel
✅ Instant download · One-time payment · No subscription
🎥 Video tutorials: Youtube.com/@PKAnExcelExpert
Last updated: September 2026