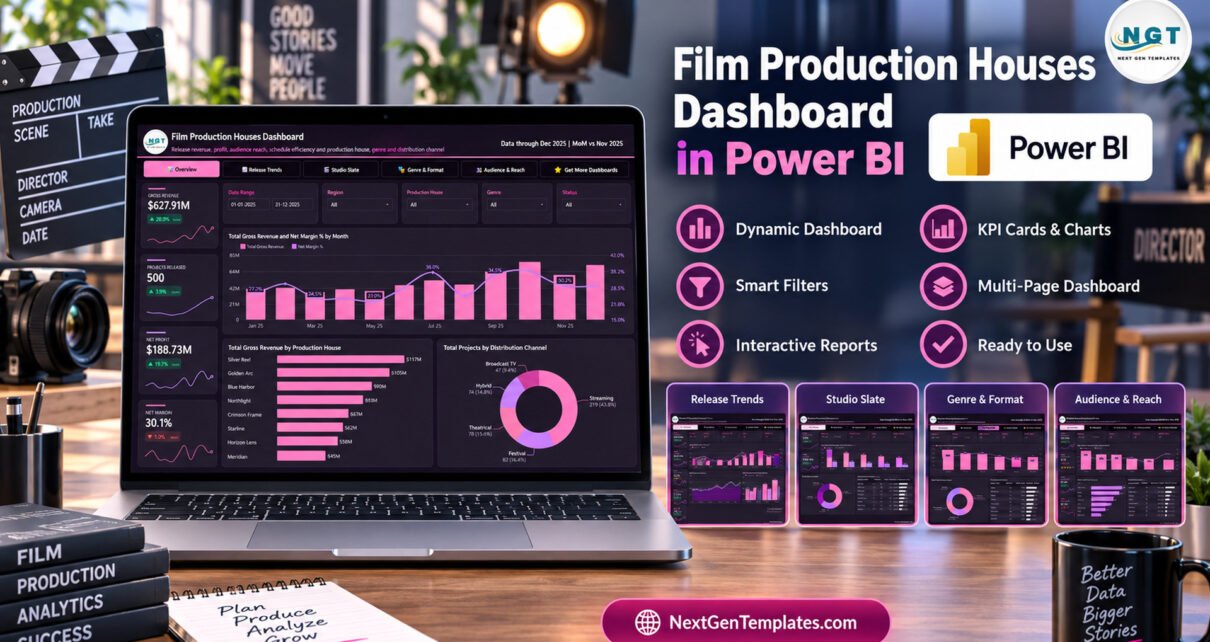
Film Production Houses Dashboard in Power BI provides a five-page reporting structure for teams that need to review release activity, revenue, profit, studio performance, genres, formats and audience reach in one place. The demonstration report contains 500 sample projects, giving viewers enough volume to see how filters and comparisons behave without presenting those values as real company results. This article explains exactly what the template shows, where it helps and where a dedicated production platform is still the better choice.
The template can support film production analytics for studios, independent producers, media consultants and finance teams that already maintain structured project data. It is a descriptive film production dashboard, not a predictive model or an operational production-management application.
Key Features of Film Production Houses Dashboard in Power BI
- Five interactive report pages with consistent navigation.
- Date, region, production house, genre, status, format and distribution-channel filters where relevant.
- Revenue, spend, net profit, net margin, ROI and revenue-per-project views.
- Project status, schedule efficiency, average crew size, blockbuster rate and flop rate analysis.
- Audience reach, rating, reach per project and revenue per viewer.
- Downloadable PBIX with an accompanying Excel data source.
Because it is an editable power bi dashboard template, analysts can connect a compatible replacement dataset and adapt labels or styling. Any model changes should be tested carefully after refresh.
Dashboard Pages Explanation
1. Overview
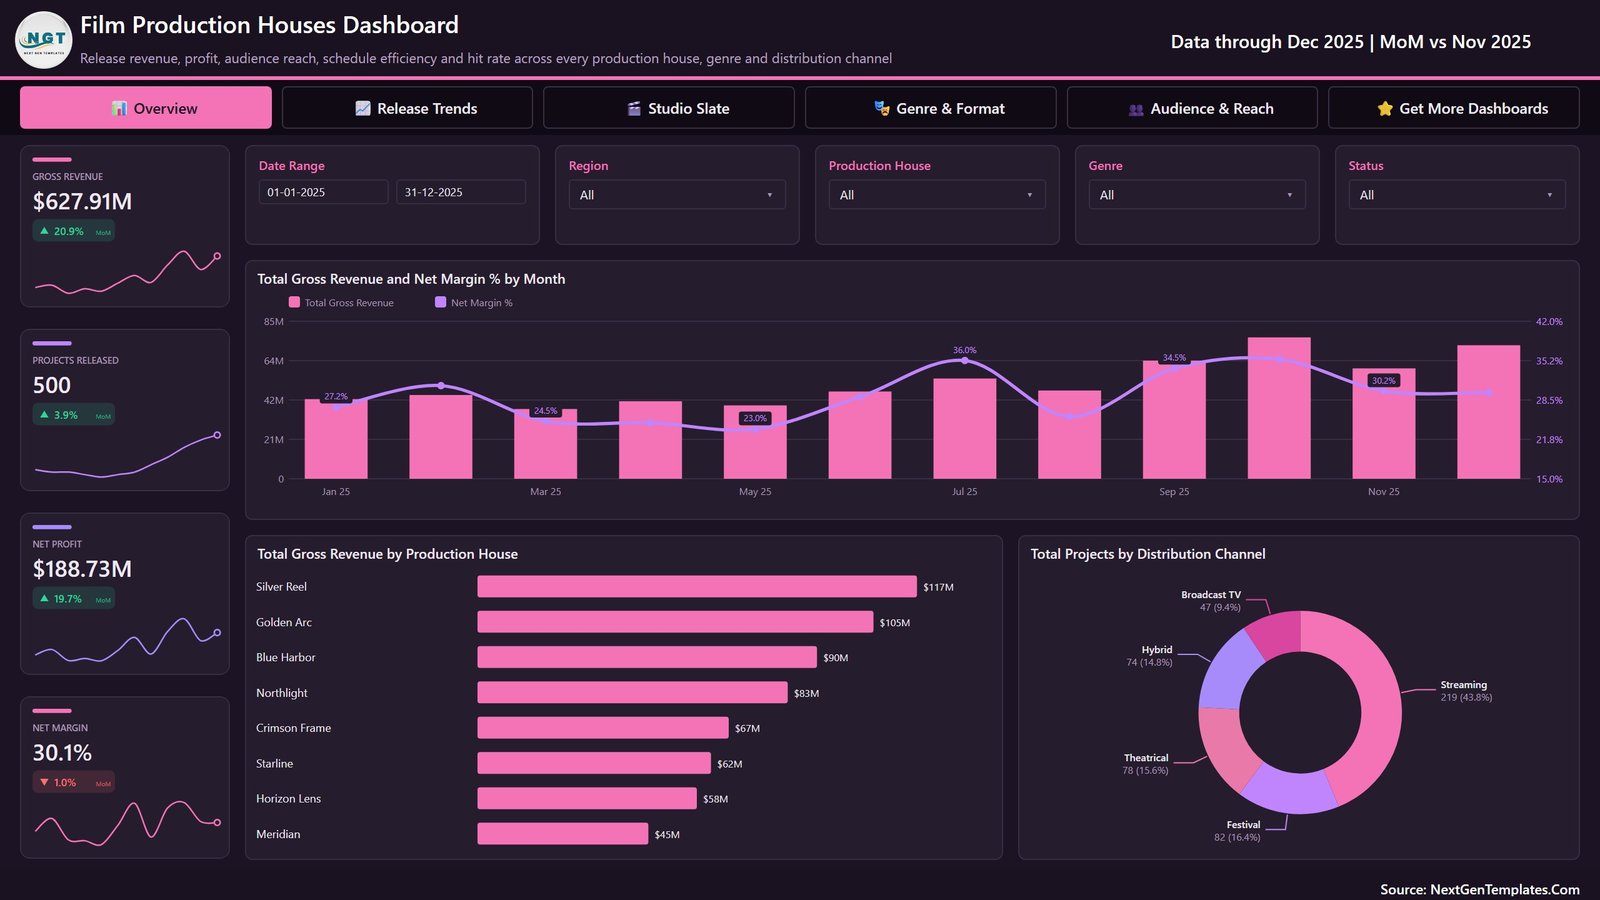
The Overview page combines four headline measures with a monthly revenue and margin chart, a production-house revenue ranking and distribution-channel mix. It is the quickest page for an executive scan of overall performance.
2. Release Trends
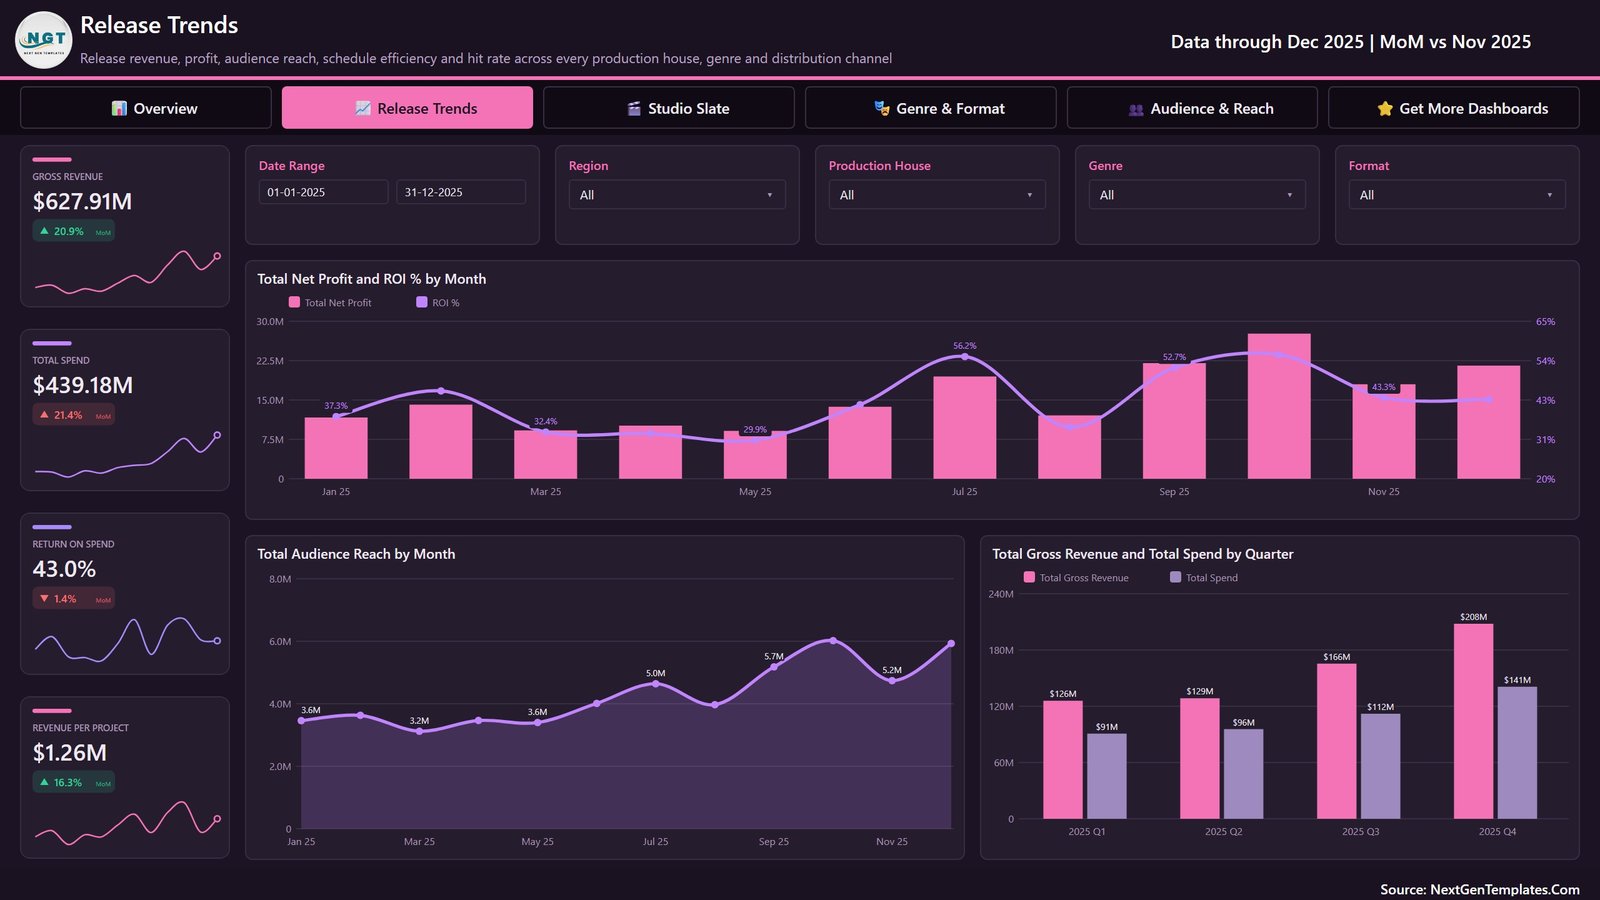
Release Trends changes the emphasis to spend, return on spend, revenue per project, monthly net profit and ROI, audience reach, and quarterly revenue versus total spend. The available slicers support comparisons across time, regions, studios, genres and formats.
3. Studio Slate
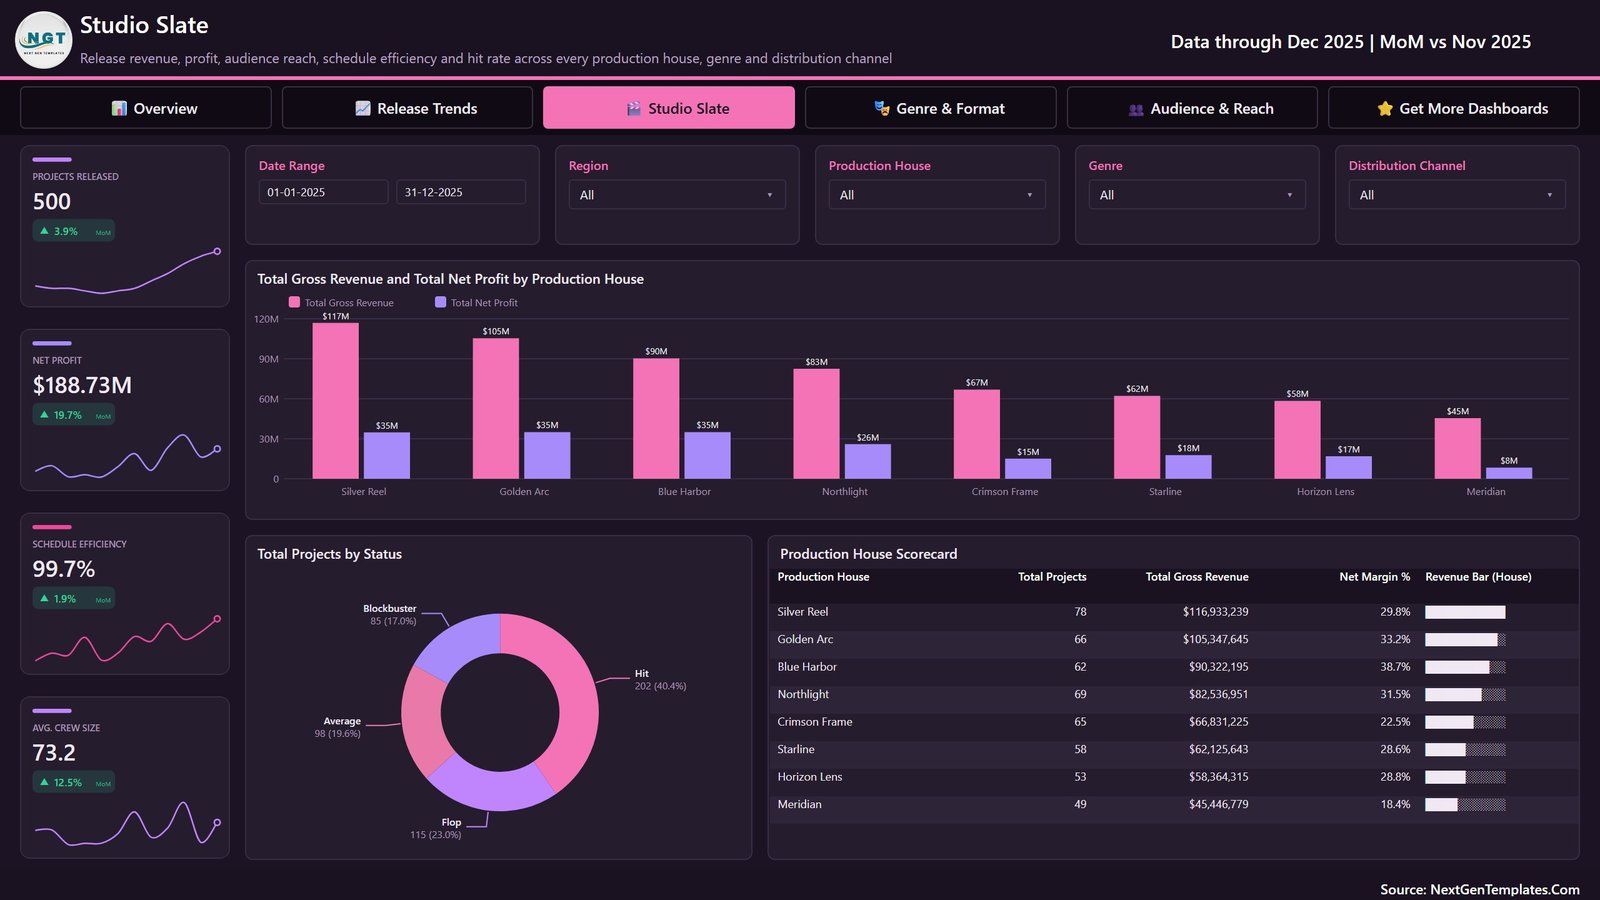
Studio Slate acts as a production house performance dashboard. It shows released projects, net profit, schedule efficiency and average crew size, then compares production houses using revenue, profit, status and a scorecard table.
4. Genre & Format
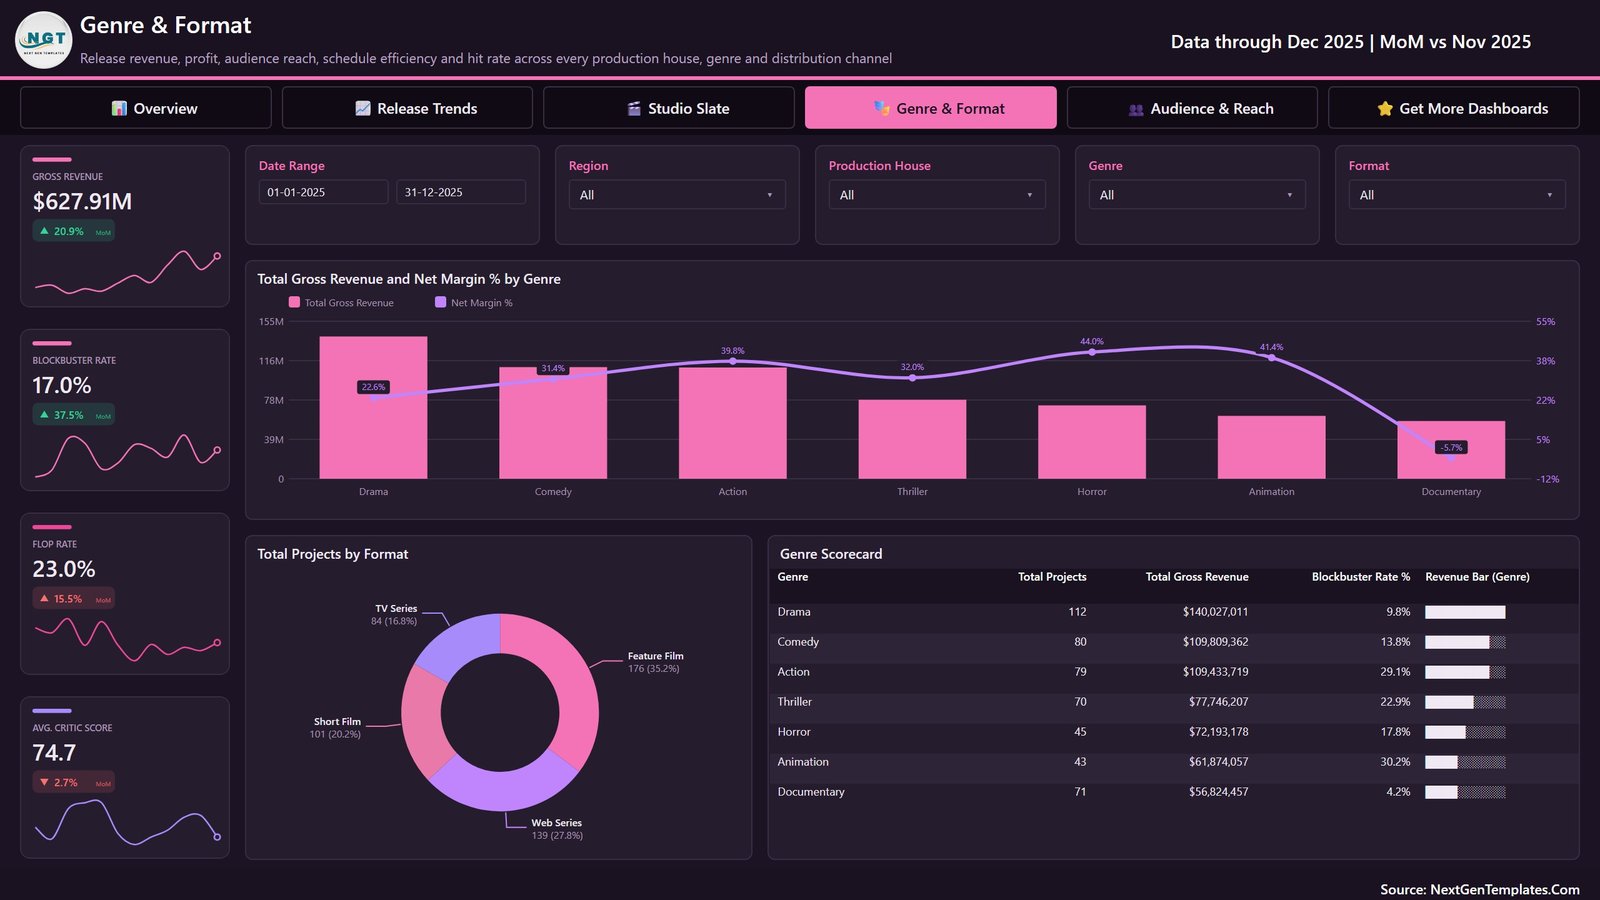
This page compares gross revenue and net margin by genre, examines format mix, and shows a genre scorecard. Cards for blockbuster rate, flop rate and average critic score add useful context, but they should be interpreted against your own definitions and data quality.
5. Audience & Reach
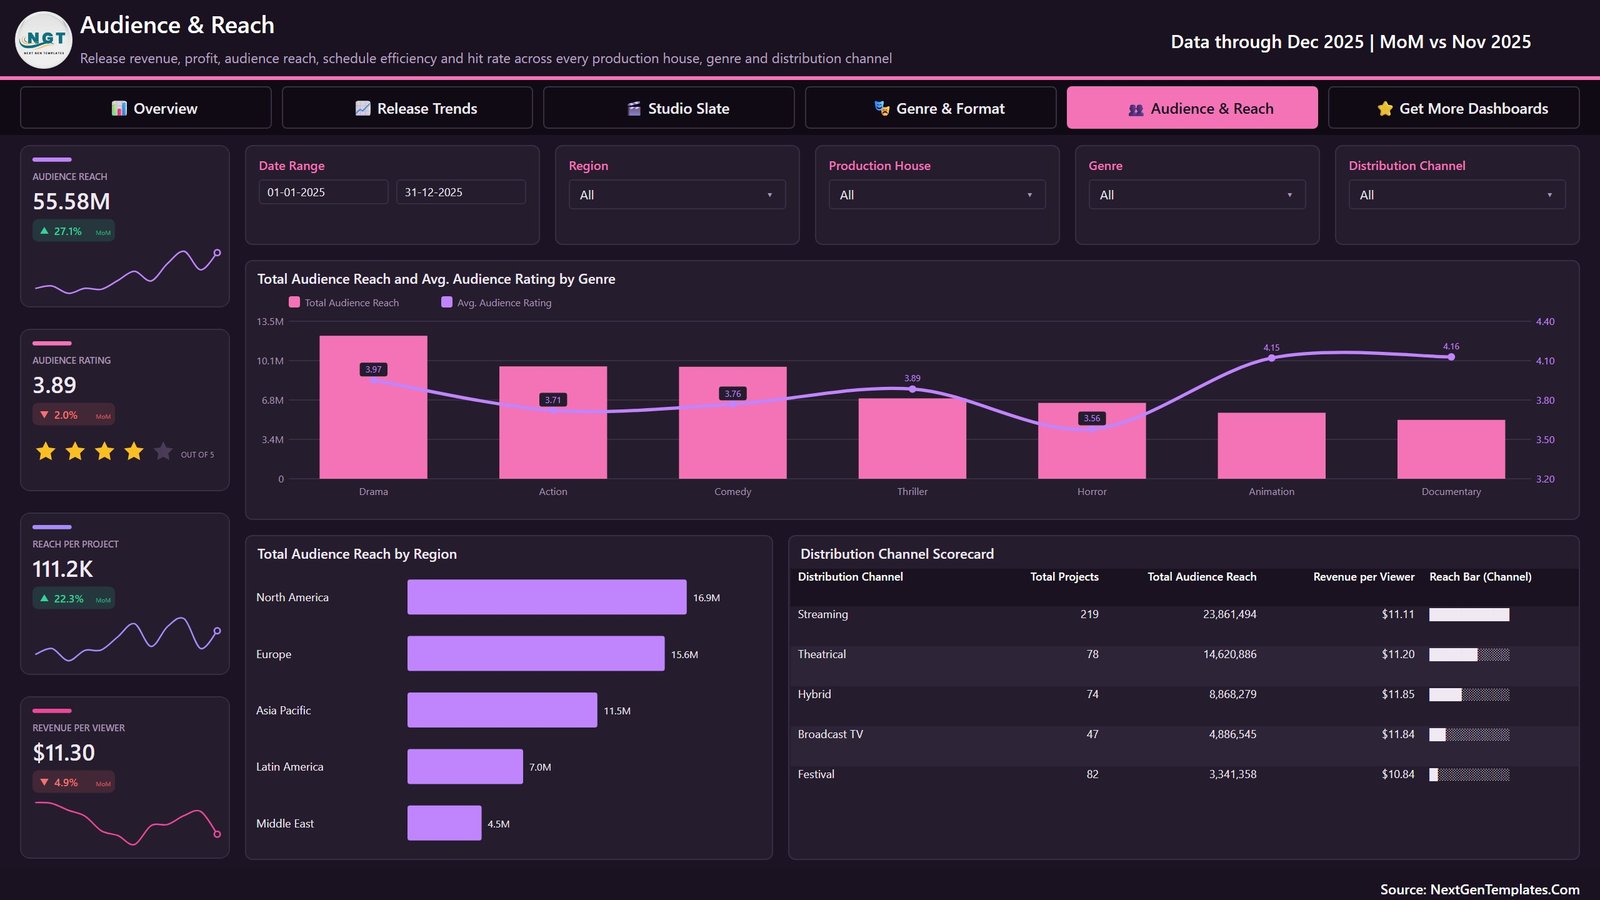
Audience & Reach covers total reach, average rating, reach per project and revenue per viewer. Visuals compare genres, regions and distribution channels, which can support post-release reviews and portfolio conversations.
Film Production Houses Dashboard in Power BI vs. Excel vs. Paid SaaS – Feature Comparison
| Area | This Power BI template | Excel alternative | Paid production SaaS |
|---|---|---|---|
| Primary purpose | Interactive analytical reporting | Spreadsheet analysis | Operational workflow and collaboration |
| Cost model | One-time template purchase | One-time template purchase | Usually recurring subscription |
| Report structure | Five film-focused pages | Depends on workbook design | Depends on vendor modules |
| Filtering | Power BI slicers and visual interactions | Filters and slicers vary | Usually application filters |
| Source replacement | Requires a compatible model | Direct worksheet editing | Import or integration setup |
| Scheduling and crew booking | Not included | Not included unless specifically built | Often available |
| Cloud collaboration | May require Microsoft services | File-based unless hosted | Usually built in |
Who Should Use This Template
Studio analysts can use the report for monthly portfolio reviews. Independent producers can organise historical project results into consistent pages. Finance and strategy partners can compare revenue, profit, spend and ROI alongside studio, genre and audience dimensions.
The template is less suitable for teams that need live rights feeds, call sheets, production calendars, budgeting workflows, approvals or crew management. Those requirements call for operational tools and properly governed integrations.
Real-World Use Cases
Monthly executive reporting
Refresh a validated source and use the Overview and Release Trends pages to prepare a concise management discussion.
Slate review
Use the Studio Slate page to compare houses and project statuses, then investigate the underlying source records before making decisions.
Genre and channel review
Compare historical genre margins, format mix and distribution channels to identify questions for the content and commercial teams.
Audience analysis
Review reach and rating patterns across genres, regions and channels. Treat these as descriptive outcomes rather than forecasts.
Advantages of Film Production Houses Dashboard in Power BI
The strongest advantage is focus. Instead of starting with a blank report, buyers receive a coherent multi-page layout, tested navigation, reusable visuals and a sample model. Power BI also supports interactive slicing more naturally than a static presentation. The PBIX remains editable, so experienced users can extend the model after protecting the original copy.
Opportunities for Improvement
The template intentionally does not include production schedules, rights and royalties, marketing attribution, cash-flow forecasting or automatic API connections. A team could extend it with governed sources, additional measures, row-level security or service publishing, but those are implementation projects rather than included features.
Best Practices
- Keep an untouched backup of the original PBIX and source file.
- Map your columns and data types before replacing the sample data.
- Refresh and reconcile headline totals against the source.
- Define terms such as hit, flop, schedule efficiency and audience reach consistently.
- Document any new measures and test filters on every page.
- Use current Microsoft guidance for Power BI data refresh when configuring refresh workflows.
Prepare the source before refresh
Start by comparing your source columns with the included Excel structure. Check that project identifiers are unique, date fields contain valid dates, monetary columns use one documented currency basis, and categorical fields use consistent spelling. A production house entered under two names will split its totals; the same problem applies to genres, formats, statuses and channels. Cleaning those values before refresh produces a more reliable report than fixing labels page by page.
Reconcile measures after replacement
After connecting your data, compare record counts and headline totals with a trusted source. Then test a small number of houses, genres and months manually. Revenue, profit, margin and ROI should be reviewed together because a correct revenue total does not prove that cost or margin logic is correct. If your organisation defines schedule efficiency, blockbuster status or audience reach differently, revise the underlying logic and document the definition.
Use filters as questions, not conclusions
A filtered visual can reveal a pattern, but it does not explain the cause. A genre with a higher historical margin may reflect project mix, territory, release timing or data coverage. Use the report to identify follow-up questions, then return to the source records and business context. This distinction is especially important when demonstration values have been replaced with operational data from multiple systems.
Explore Relevant Templates
For a production-oriented companion, see the Film Production KPI Dashboard in Power BI. The Independent Filmmaking Dashboard in Power BI provides another film-sector perspective, while the Media and Entertainment Dashboard in Power BI broadens the analysis beyond production houses.
Frequently Asked Questions
What files are included?
The customer ZIP contains the Power BI PBIX and an Excel data source.
Is the report ready to use?
It opens with sample data and finished pages. Using it with business data requires a compatible source and validation.
Are the sample companies and figures real?
No. They are demonstration records and should not be treated as market benchmarks.
Does the dashboard predict box-office success?
No. It summarises the supplied data; it does not forecast hits or recommend investments.
Can I publish it to Power BI Service?
The PBIX can be prepared for Microsoft services, subject to your account, licensing, data governance and refresh configuration.
Does it replace production software?
No. Scheduling, crew, rights, approvals and accounting workflows are outside its scope.
About the Author
Built by PK – Microsoft Certified Professional with 15+ years of Excel, Google Sheets, and Power BI experience. Founder of NextGenTemplates, reaching 300K+ subscribers across YouTube channels. Every template is hand-built and tested before release.
Conclusion
The Film Production Houses Dashboard in Power BI gives film and media teams a clear starting point for reviewing releases, commercial performance, studio slates, genres, formats and audience reach. Its value is the finished analytical structure: five connected pages that can be adapted to a compatible source without pretending to be a full production platform.
Download the Film Production Houses Dashboard in Power BI and build a repeatable film-performance review in Power BI Desktop. For more tutorials, visit PK: An Excel Expert on YouTube.