In today’s competitive market, delivering timely and effective customer support is crucial for business success. One of the most overlooked aspects of customer service and support (CS and Support) is inventory management. Without the right tools, tracking essential performance indicators becomes difficult. That’s where the Customer Service and Support Inventory Management KPI Dashboard in Excel comes into play.
This comprehensive dashboard is a ready-to-use Excel template designed to help you track, evaluate, and optimize your inventory-related performance KPIs in customer service and support functions.
Let’s explore this powerful Excel dashboard, its features, benefits, best practices, and how it can transform your CS operations.
Click to Purchases CS and Support Inventory Management KPI Dashboard in Excel
What Is the Customer Service and Support Inventory Management KPI Dashboard?
The CS and Support Inventory Management KPI Dashboard in Excel is a smart reporting tool created to monitor key performance indicators (KPIs) related to inventory in support and service departments. It brings visibility and insights to stock levels, product availability, service request fulfillment, and overall efficiency of the support inventory system.
Whether you’re handling spare parts for a technical support team or managing returned products in customer service, this dashboard offers a detailed and interactive view of your monthly and yearly performance.
Key Features of the Dashboard
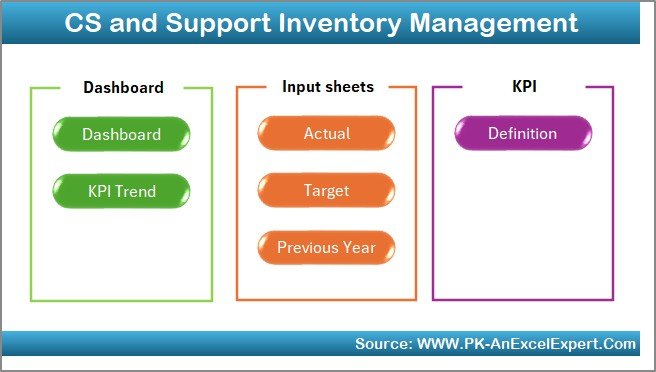
This Excel dashboard consists of seven well-structured worksheets, each playing a specific role in ensuring smooth performance tracking and reporting.
Home Sheet
-
Functions as the index page for the dashboard.
-
Includes 6 clickable buttons that take you directly to other sheets.
-
Offers quick navigation for better user experience.
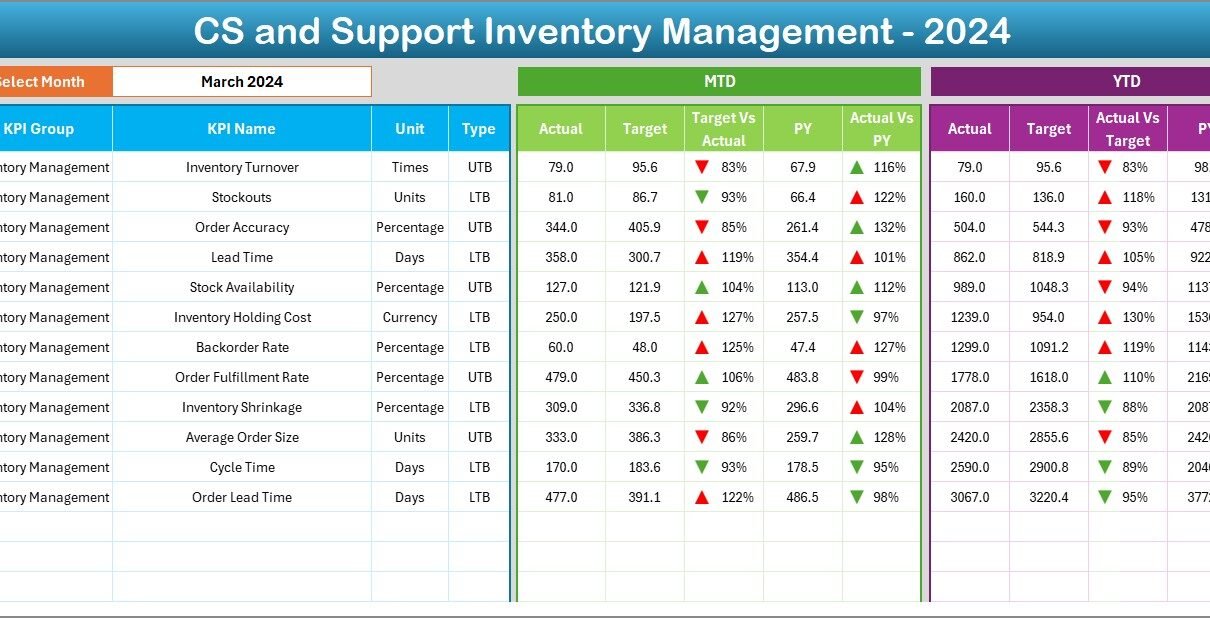
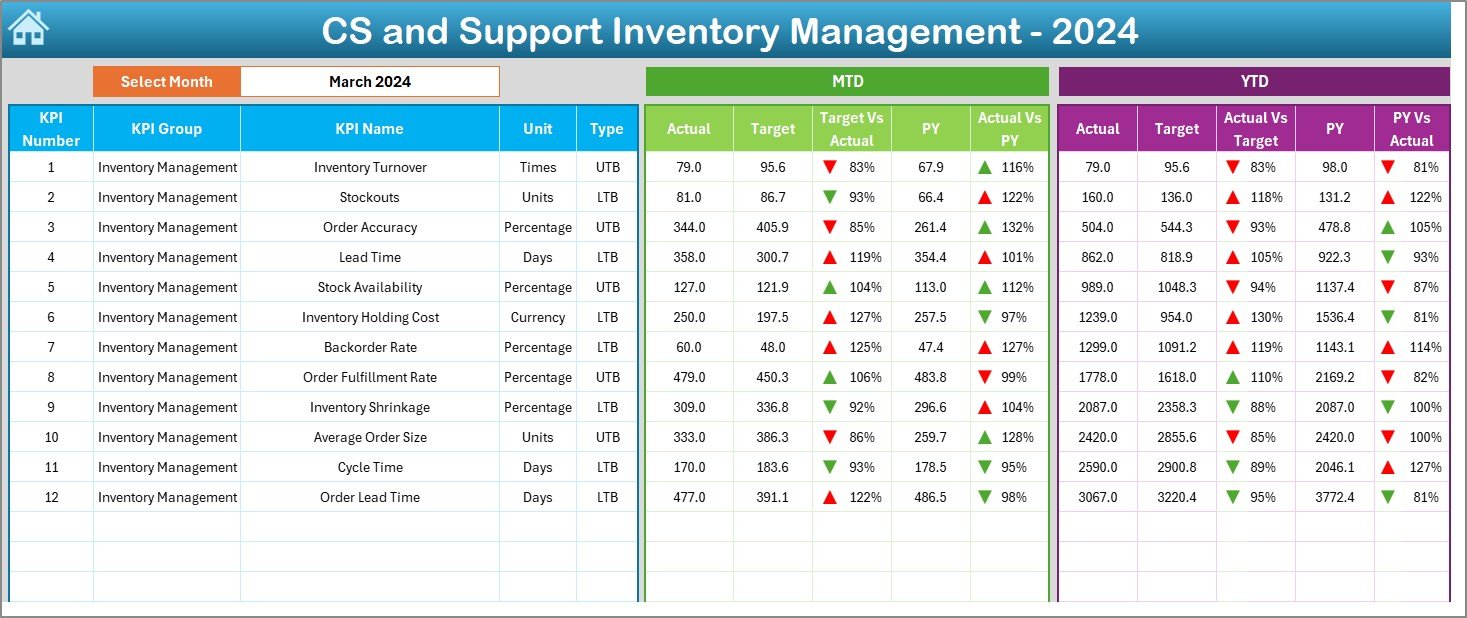
Dashboard Sheet
-
This is the main visualization sheet.
-
Allows you to select the month from a dropdown in cell
D3.
Displays Month-to-Date (MTD) and Year-to-Date (YTD) data for:
- Actual values
- Targets
- Previous Year (PY) values
-
Includes conditional formatting with up and down arrows to instantly show performance trends (Actual vs. Target, Actual vs. PY).
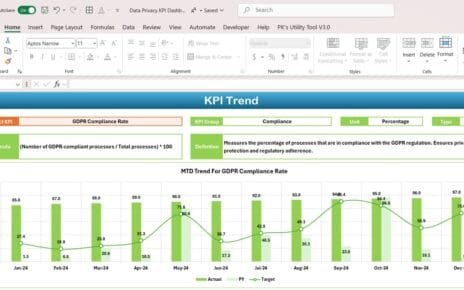
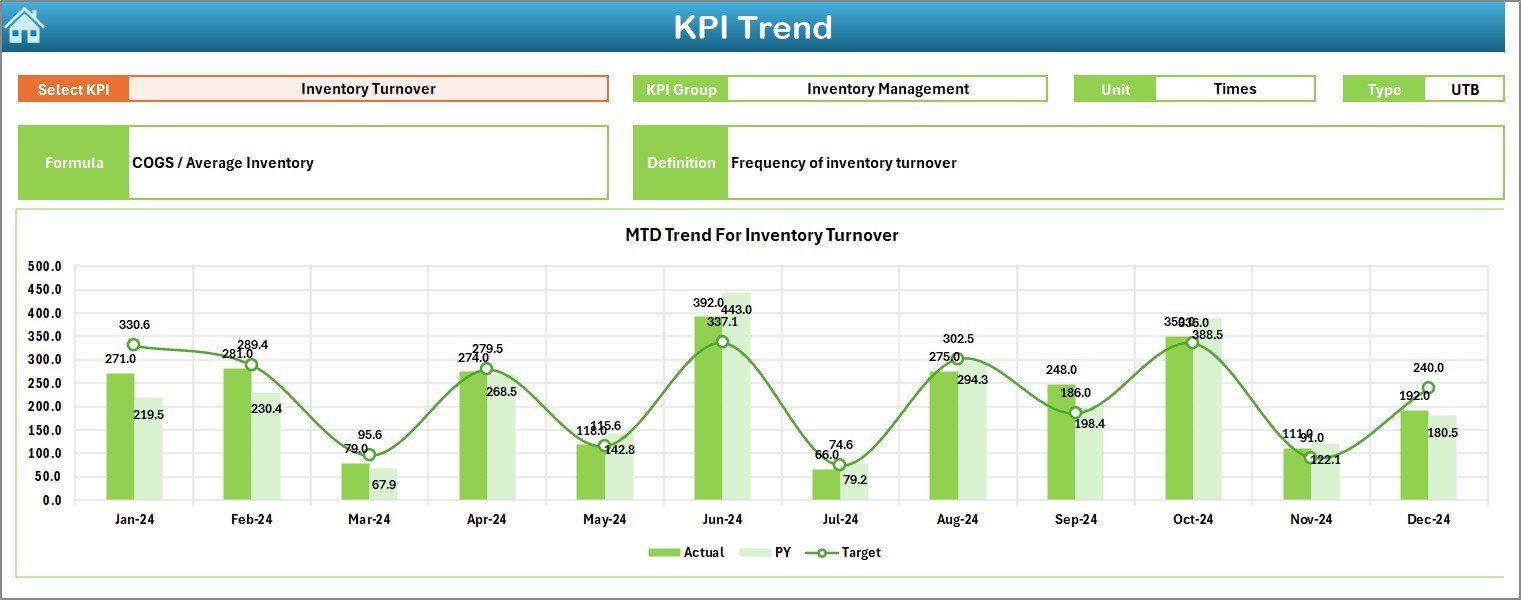
KPI Trend Sheet
-
Lets you select any KPI from the dropdown in cell
C3.
Displays:
- KPI Group
- KPI Unit
- Type (LTB – Lower the Better or UTB – Upper the Better)
- Formula
- Definition
-
Shows trend charts for MTD and YTD for Actual, Target, and PY values.
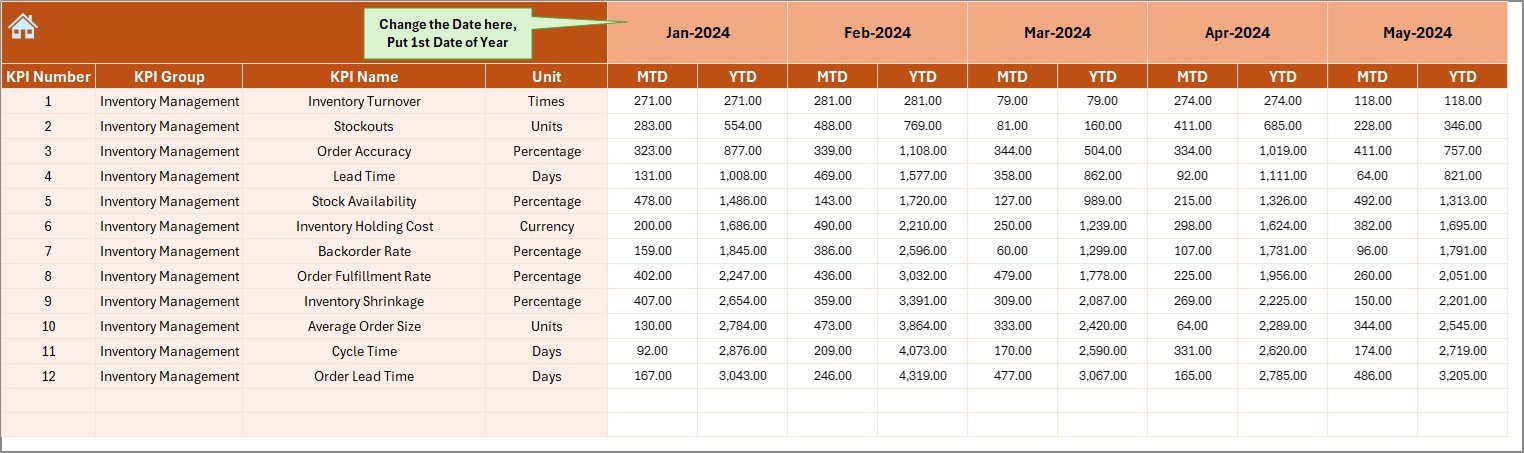
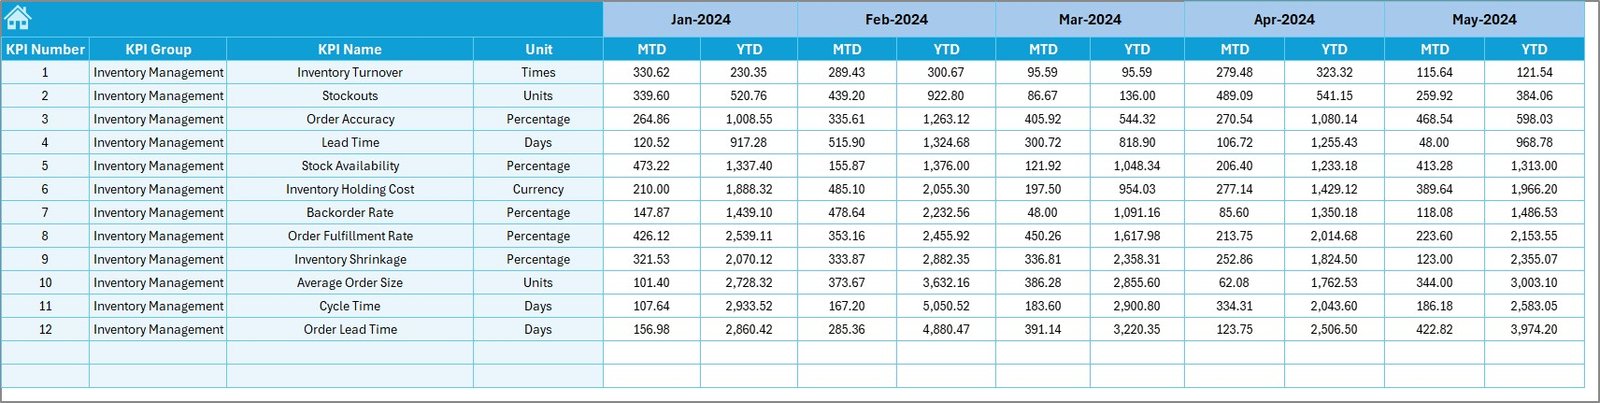
Actual Numbers Input Sheet
-
Enter your actual monthly data here.
-
Cell
E1lets you set the starting month of the year. -
Automatically maps the data into the Dashboard and Trend sheets.
Target Sheet
-
Input your MTD and YTD target values for each KPI.
-
Enables a clear comparison between performance and expectations.
Previous Year Number Sheet

-
Records MTD and YTD numbers from the same period last year.
-
Helps you measure yearly improvements or declines.
Click to Purchases CS and Support Inventory Management KPI Dashboard in Excel
KPI Definition Sheet

-
Maintain a detailed list of KPIs including:
- Name
- Group
- Unit
- Formula
- Definition
-
Acts as a reference sheet to standardize KPI understanding.
Why Do You Need This Dashboard?
Inventory management in customer support has a direct impact on response time, cost efficiency, and customer satisfaction. This dashboard helps you:
-
Visualize monthly trends and spot bottlenecks
-
Stay aligned with organizational targets
-
Make informed decisions backed by data
-
Streamline inventory forecasting and planning
Advantages of Customer Service and Support Inventory Management KPI Dashboard
✔ Centralized Reporting
All your important KPI data sits in one place — easy to update, access, and analyze.
✔ Real-Time Tracking
With the dropdown selections and input sheets, you can quickly switch between months and view updated charts instantly.
✔ Improved Decision-Making
Visual trend charts and performance indicators help identify areas that need attention or improvement.
✔ Year-over-Year Comparison
Track how well you’ve improved by comparing current values with previous year performance.
✔ KPI Customization
Add, remove, or update KPIs to fit your unique business process — the tool is entirely customizable.
Best Practices for the Customer Service and Support Inventory Management KPI Dashboard
To make the most of this dashboard, follow these tried-and-tested tips:
✅ Keep KPI Definitions Clear
Ensure every stakeholder understands each KPI — refer to the KPI Definition sheet regularly.
✅ Update Monthly Without Fail
Maintain a schedule to enter actual, target, and previous year data for accurate reporting.
✅ Use Conditional Formatting Wisely
The arrows and color codes help you understand performance at a glance — do not disable them.
✅ Focus on Trends, Not Just Numbers
Use the KPI Trend sheet to view long-term patterns, not just single-month spikes or dips.
✅ Align Targets with Business Goals
Set realistic but challenging targets in the Target sheet to motivate and measure performance properly.
✅ Protect Formula Cells
Avoid overwriting formulas by locking calculated cells and giving edit access only where necessary.
How to Set Up and Use the Dashboard
Here’s a step-by-step guide to start using the template effectively:
Step 1: Setup Your KPI Definitions
Go to the KPI Definition Sheet, list all KPIs with formulas, unit types, and whether they are LTB or UTB.
Step 2: Input Previous Year Data
On the Previous Year Number Sheet, input your MTD and YTD values from last year.
Step 3: Define Targets
Enter your monthly and yearly targets on the Target Sheet.
Step 4: Input Actual Values
Switch to the Actual Numbers Input Sheet and add current performance data. Don’t forget to select the first month of the fiscal year in E1.
Step 5: Navigate to Dashboard
Head to the Dashboard Sheet, select the desired month from the dropdown, and see the results populate with visuals and performance indicators.
Step 6: Explore KPI Trends
Analyze individual KPIs in detail using the KPI Trend Sheet.
Common KPIs to Track in Customer Service Inventory Management
To give you a head start, here are some of the most useful KPIs that this dashboard can track:
-
Inventory Turnover Rate
-
Stockout Rate
-
Order Fulfillment Time
-
Average Handling Time
-
Spare Parts Availability
-
Inventory Accuracy
-
Cost per Order
-
Damaged Goods Percentage
-
Backorder Rate
-
Return Processing Time
-
Average Inventory Value
-
Customer Satisfaction Score (linked to inventory issues)
Each of these can be marked as either LTB or UTB based on your process goals.
Opportunities for Improvement
Even though the dashboard is highly effective, you can always improve how you use it:
-
Integrate with Power BI or Tableau for advanced visuals
-
Link with inventory management systems to automate data collection
-
Train your team to read and interpret KPIs regularly
-
Use VBA Macros to create alerts when KPIs fall below threshold
-
Implement version control to maintain data integrity
Real-World Use Case
Imagine a tech company with 10 support centers across the country. Their biggest challenge? Ensuring quick replacement of defective hardware. Using this KPI dashboard, they track:
-
Time taken to dispatch replacement units
-
Spare stock levels per region
-
Return rates
-
Trends in missing inventory
Within three months, they reduce customer waiting time by 40% and improve SLA adherence by 30% — just by using Excel.
Click to Purchases CS and Support Inventory Management KPI Dashboard in Excel
Conclusion
The Customer Service and Support Inventory Management KPI Dashboard in Excel is more than a spreadsheet. It’s a practical tool that empowers service leaders to control their inventory operations with confidence. With customizable fields, real-time tracking, and rich visuals, this dashboard bridges the gap between operational insight and action.
Whether you’re part of a large enterprise or a small support team, this tool gives you the clarity and direction you need to elevate your inventory performance and improve customer satisfaction.
Frequently Asked Questions (FAQs)
❓What is the purpose of this KPI dashboard?
It helps customer service teams monitor and improve inventory-related performance using structured, visual, and comparative data in Excel.
❓Can I customize the KPIs in this dashboard?
Yes, you can add or remove KPIs in the KPI Definition sheet, and all relevant charts will adjust accordingly.
❓Is this template suitable for non-technical users?
Absolutely! It’s designed in Excel with dropdowns and buttons, making it easy for anyone with basic Excel knowledge to use it.
❓How do I update the data each month?
Just go to the Actual Numbers Input, Target, and Previous Year sheets, enter the new month’s values, and select the month in the Dashboard dropdown.
❓Can I add more sheets or visualizations?
Yes, you can expand it further by adding custom charts, pivot tables, or even link it to a Power BI file if needed.
❓Is the tool mobile or cloud-compatible?
While it’s built in Excel and best viewed on desktop, you can store and access it through cloud platforms like OneDrive or Google Drive for remote use.
Visit our YouTube channel to learn step-by-step video tutorials