Managing marine and port operations has never been more important than it is today. Marine & Ports KPI Dashboard in Excel With the rise of global trade, shipping companies and port authorities need efficient ways to monitor performance, track operations, and ensure safety. An Excel-based Marine & Ports KPI Dashboard offers exactly that—a clear, data-driven solution for tracking key performance indicators (KPIs) and making informed decisions.
In this article, we will explore what the Marine & Ports KPI Dashboard is, how it works, its benefits, and best practices for using it effectively. We will also walk through the different worksheets included in the template and explain how organizations can apply them in real operations.
Click to Purchases Marine & Ports KPI Dashboard in Excel
What Is a Marine & Ports KPI Dashboard in Excel?
A Marine & Ports KPI Dashboard is a structured Excel template designed to monitor operational, financial, and safety KPIs across marine and port environments. Instead of relying on manual reports or scattered files, the dashboard centralizes all information in one place.
It allows you to:
-
Track Monthly-to-Date (MTD) and Year-to-Date (YTD) performance.
-
Compare current performance against targets and previous year results.
-
Visualize data using charts, slicers, and conditional formatting.
-
Standardize KPI definitions for consistent reporting.
This makes it easier for managers, port operators, and marine authorities to make quick and reliable decisions.
Key Features of the Marine & Ports KPI Dashboard
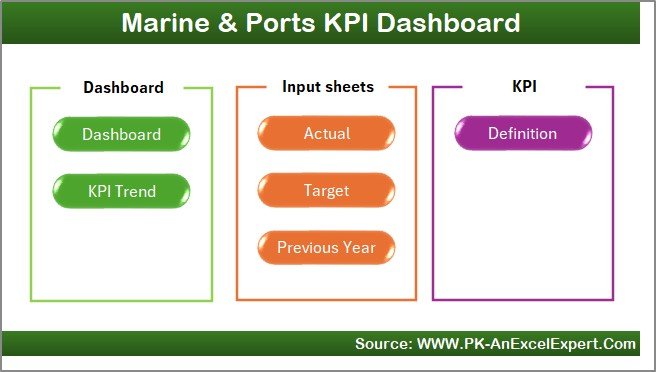
The dashboard has seven structured worksheets, each serving a unique purpose:
1. Home Sheet
-
Works as the index page.
-
Includes buttons that link directly to other sheets.
-
Provides an easy way to navigate the dashboard without scrolling through multiple tabs.
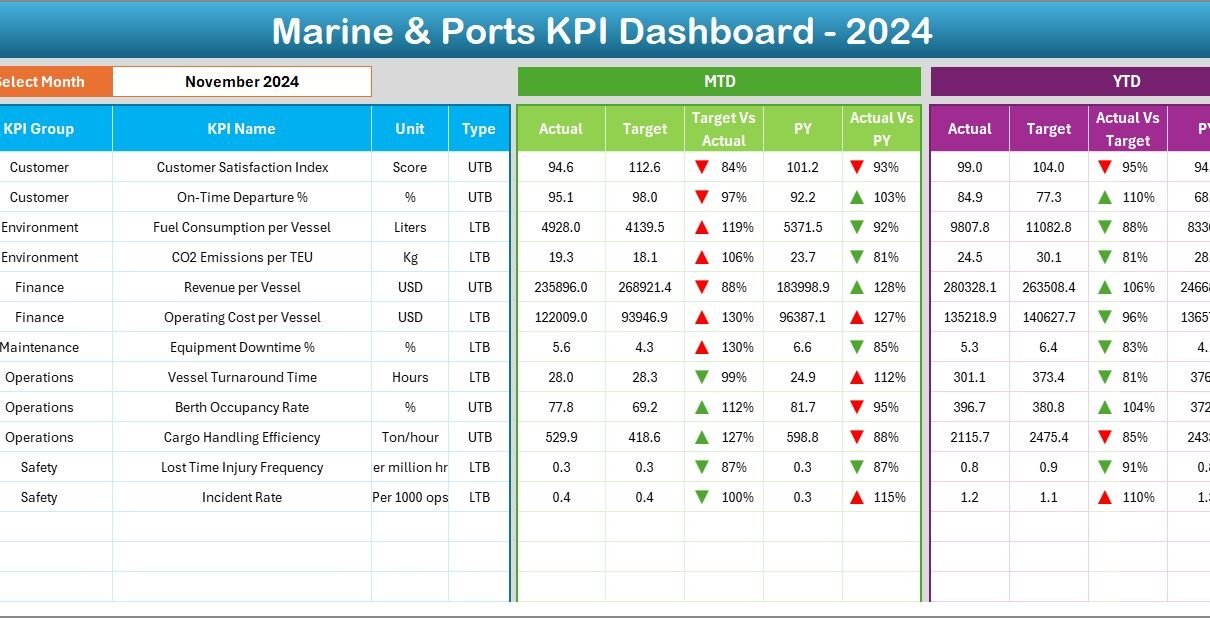
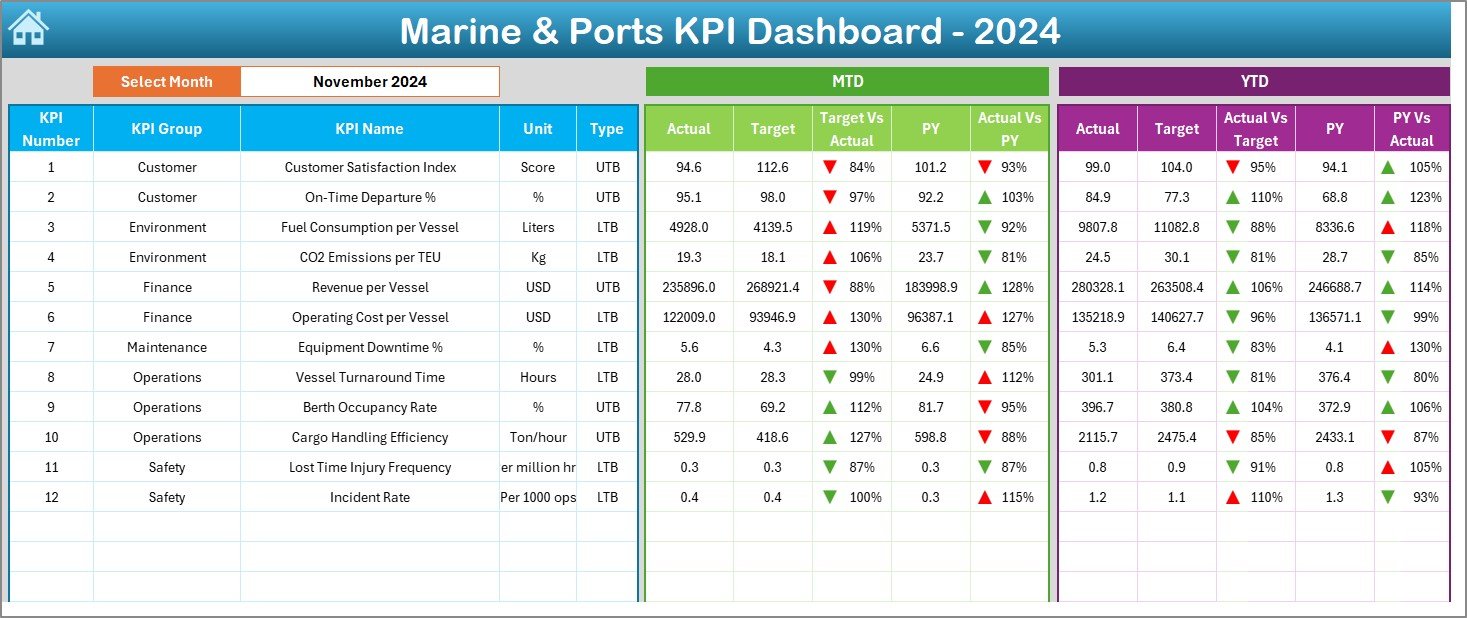
2. Dashboard Sheet
-
The main visual reporting sheet.
-
Displays cards and charts for KPIs.
-
Shows MTD and YTD actuals, targets, and previous year data.
-
Includes conditional formatting with arrows to highlight performance (up for improvement, down for decline).
-
Month selector in cell D3 allows users to switch reporting months instantly.
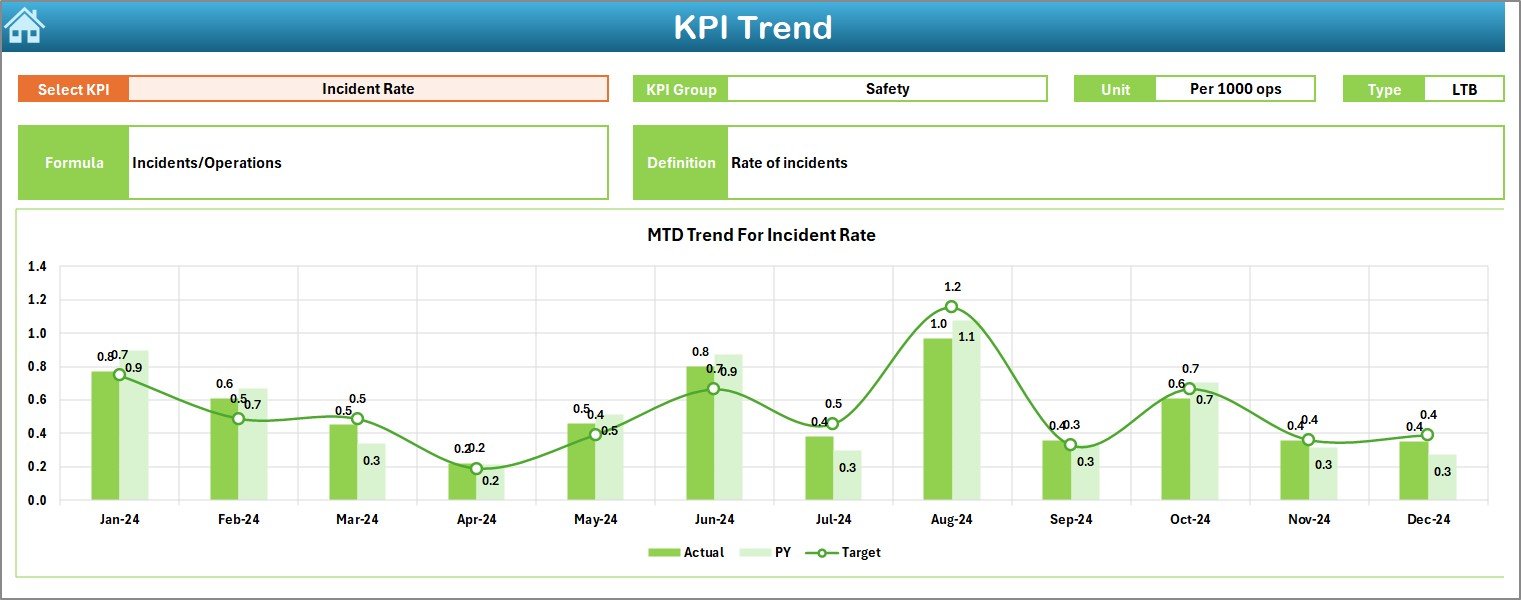
3. KPI Trend Sheet
-
Focused on historical trends of KPIs.
-
Dropdown in cell C3 lets users select a KPI for analysis.
-
Shows KPI details: group, unit, type (LTB or UTB), formula, and definition.
-
Trend charts compare Actual vs Target vs Previous Year over time.
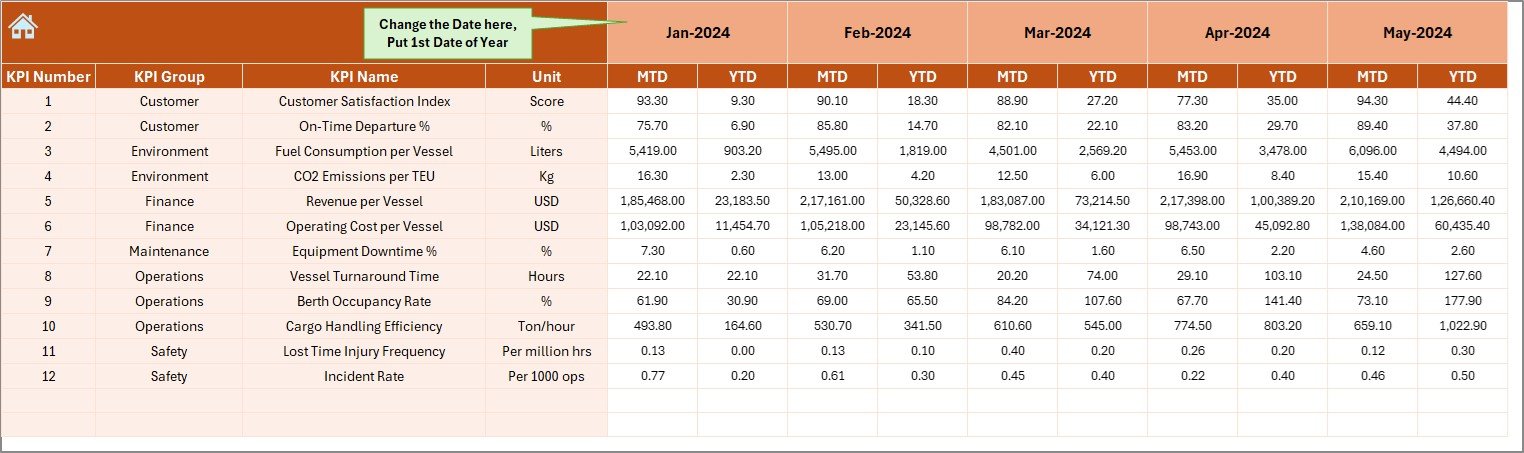
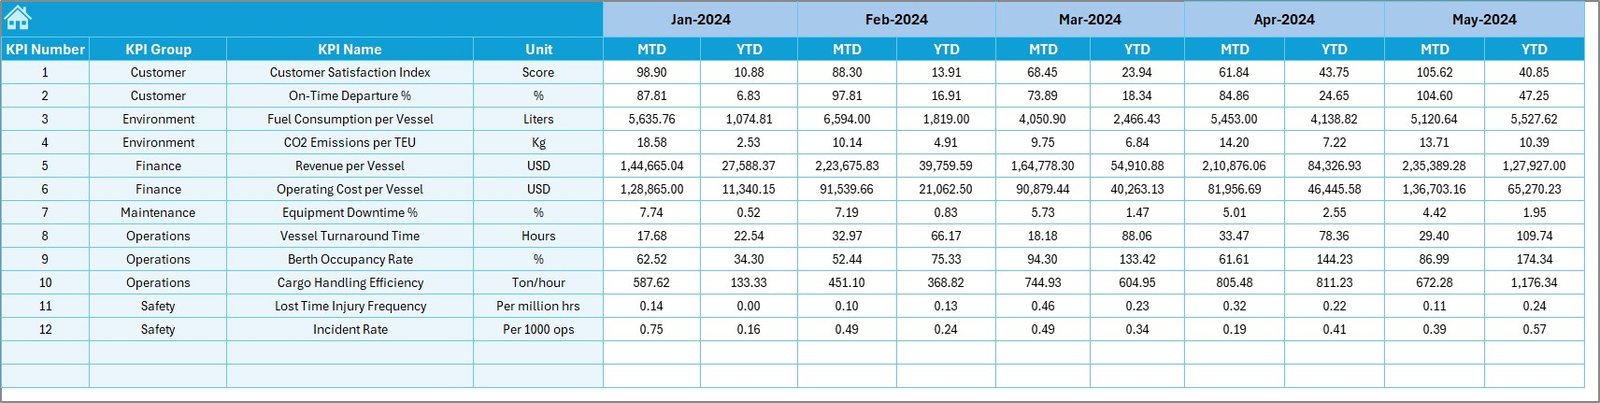
4. Actual Numbers Input Sheet
-
The data entry section for actual results.
-
MTD and YTD values are entered here.
-
Month selector in cell E1 helps align reporting periods.
-
Critical for feeding accurate data into all other sheets.
5. Target Sheet
-
Dedicated sheet for entering target values for each KPI.
-
Includes both MTD and YTD targets.
-
Ensures performance is always compared against planned expectations.
6. Previous Year Numbers Sheet
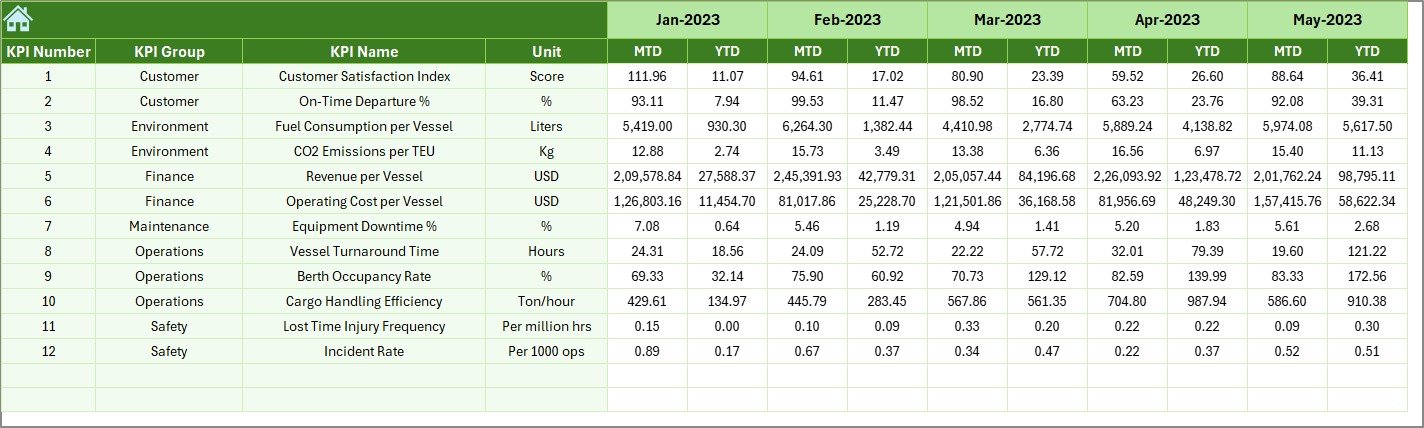
-
Stores last year’s data for benchmarking.
-
Structured in the same way as the current year’s sheet.
-
Helps identify year-on-year improvements or declines.
7. KPI Definition Sheet
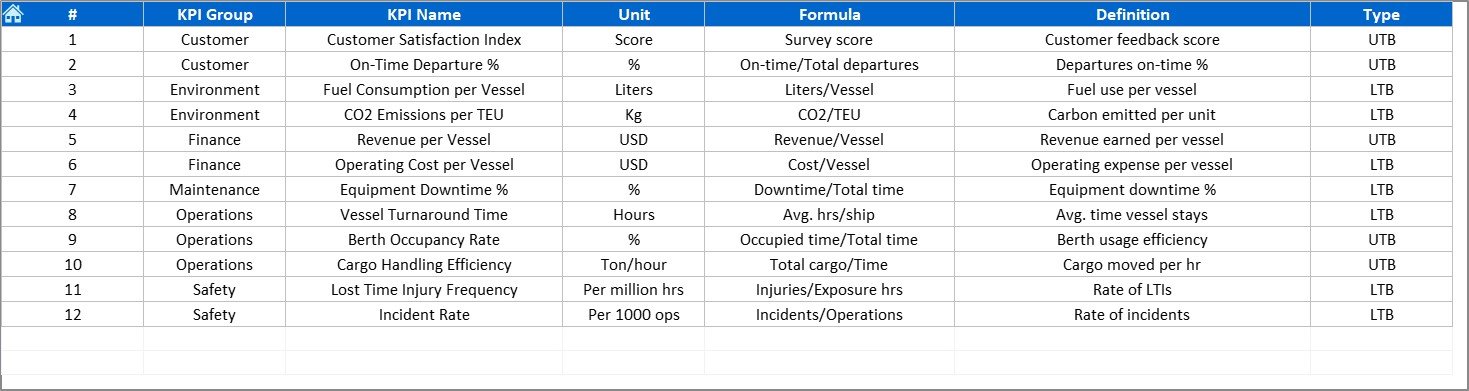
-
Contains the master list of KPIs.
-
Columns include KPI Name, KPI Group, Unit, Formula, and Definition.
-
Ensures everyone uses consistent KPI definitions across the organization.
Why Do Marine and Port Operations Need a KPI Dashboard?
Marine and port operations involve multiple moving parts: cargo handling, fleet operations, safety checks, fuel consumption, berth occupancy, and more. Tracking all of these manually is inefficient and prone to errors.
Click to Purchases Marine & Ports KPI Dashboard in Excel
A KPI dashboard helps by:
-
Centralizing performance data in one place.
-
Improving accountability through clear metrics.
-
Enhancing decision-making with real-time insights.
-
Identifying bottlenecks early.
-
Tracking sustainability goals such as fuel efficiency and carbon emissions.
Advantages of the Marine & Ports KPI Dashboard
Using this Excel-based dashboard provides several advantages:
✅ Easy to Use – No complex software installation required; anyone familiar with Excel can use it.
✅ Customizable – You can add, edit, or remove KPIs to suit specific port operations.
✅ Cost-Effective – Unlike expensive BI software, Excel is widely available and low-cost.
✅ Real-Time Insights – See updates as soon as new data is entered.
✅ Improved Collaboration – Multiple teams can use the same structured dashboard.
✅ Benchmarking Capability – Compare current performance against previous year data.
Best Practices for Using the Marine & Ports KPI Dashboard
To get the most out of the dashboard, follow these best practices:
-
Define clear KPIs – Ensure every KPI has a clear formula and definition.
-
Maintain data accuracy – Regularly update the actual numbers sheet.
-
Set realistic targets – Use industry benchmarks and past data when setting targets.
-
Review trends frequently – Use the KPI Trend sheet to track performance over time.
-
Use conditional formatting wisely – Visual cues should be easy to understand.
-
Train team members – Provide short training so that everyone can use the dashboard effectively.
-
Keep backup copies – Always save historical versions to avoid accidental data loss.
How to Implement the Dashboard in Real Operations
-
Identify your KPIs – Examples include:
-
Cargo handling time
-
Ship turnaround time
-
Berth occupancy rate
-
Fuel efficiency
-
Port revenue per vessel
-
Safety incident frequency
-
-
Input baseline data – Enter last year’s numbers in the Previous Year sheet.
-
Set realistic targets – Fill in monthly and yearly targets in the Target sheet.
-
Collect current data – Record actual numbers each month in the Actual Numbers sheet.
-
Review the dashboard – Use the Dashboard and KPI Trend sheets to visualize performance.
-
Take action – Use insights to improve operations, reduce costs, or enhance safety.
Opportunities for Improvement
While Excel dashboards are powerful, there are always opportunities to improve:
🔹 Automation – Link the dashboard with real-time databases for automatic updates.
🔹 Scalability – Expand the number of KPIs as port operations grow.
🔹 Integration – Combine with other tools like Power BI or Tableau for advanced analytics.
🔹 Visualization – Add more dynamic charts, heat maps, or pivot dashboards.
🔹 Mobile Access – Create web-enabled versions for managers on the go.
Conclusion
The Marine & Ports KPI Dashboard in Excel provides a practical, cost-effective, and user-friendly solution for tracking port performance. With its structured worksheets, managers can monitor everything from cargo handling efficiency to financial targets. By following best practices, organizations can use this dashboard not only to track progress but also to identify growth opportunities and improve sustainability.
Ultimately, this dashboard turns raw numbers into actionable insights, making marine and port operations more efficient and competitive.
Click to Purchases Marine & Ports KPI Dashboard in Excel
Frequently Asked Questions (FAQs)
1. What KPIs should a port authority track?
Ports should track KPIs such as berth occupancy rate, vessel turnaround time, cargo handling time, fuel consumption, safety incident rate, and revenue per vessel.
2. Can this dashboard handle large amounts of data?
Yes, Excel can handle a considerable volume of data. However, for extremely large datasets, integrating with Power BI or SQL databases is recommended.
3. How often should I update the dashboard?
You should update the actual numbers monthly. For critical KPIs, weekly updates may be more effective.
4. Is this dashboard suitable for small ports?
Yes, it is highly flexible and can be scaled up or down depending on the size of the port operation.
5. Can I customize the KPIs in the dashboard?
Absolutely. You can edit the KPI Definition sheet to add or modify KPIs according to your specific operational needs.
6. How does this dashboard improve decision-making?
By comparing actual vs target vs previous year data, the dashboard highlights strengths and weaknesses, helping managers take timely corrective action.
Visit our YouTube channel to learn step-by-step video tutorials
Click to Purchases Marine & Ports KPI Dashboard in Excel
Watch the step-by-step video tutorial: