In today’s unpredictable business environment, risk management has become more than just a compliance activity—it’s a strategic necessity. Organizations face multiple risks ranging from financial uncertainty and cybersecurity threats to operational inefficiencies and market disruptions. To stay competitive, companies must monitor these risks continuously and take proactive actions.
That’s where a Risk Management KPI Scorecard in Excel plays a crucial role. This powerful tool helps you measure, analyze, and visualize risk-related metrics in one centralized dashboard. Whether you’re a risk manager, compliance officer, or department head, this Excel-based scorecard allows you to evaluate how effectively your organization identifies, mitigates, and controls risks over time.
In this article, we’ll explore everything you need to know about the Risk Management KPI Scorecard in Excel—its structure, features, benefits, best practices, and practical applications.
Click to Purchases Risk Management KPI Scorecard in Excel
📊 What Is a Risk Management KPI Scorecard?
A Risk Management KPI Scorecard is a data-driven reporting framework that tracks key performance indicators (KPIs) related to organizational risk. It enables teams to assess how well they manage various types of risks—financial, operational, strategic, and compliance-related—by comparing actual performance against defined targets.
Using Excel as the platform offers flexibility, accessibility, and cost-effectiveness. It allows teams to create customized dashboards that display risk exposure levels, mitigation effectiveness, and overall performance health in real time.
🧩 Structure of the Risk Management KPI Scorecard in Excel
This ready-to-use template comes with four structured worksheets, each serving a unique purpose for tracking, analysis, and visualization.
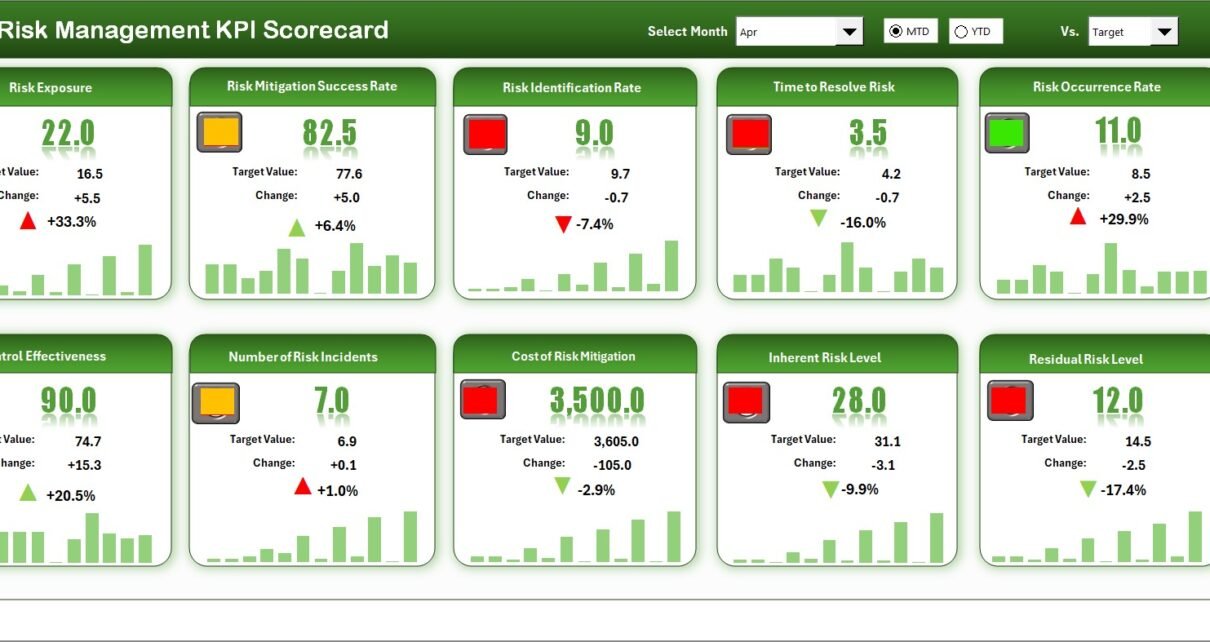
1️⃣ Scorecard Sheet – The Central Dashboard
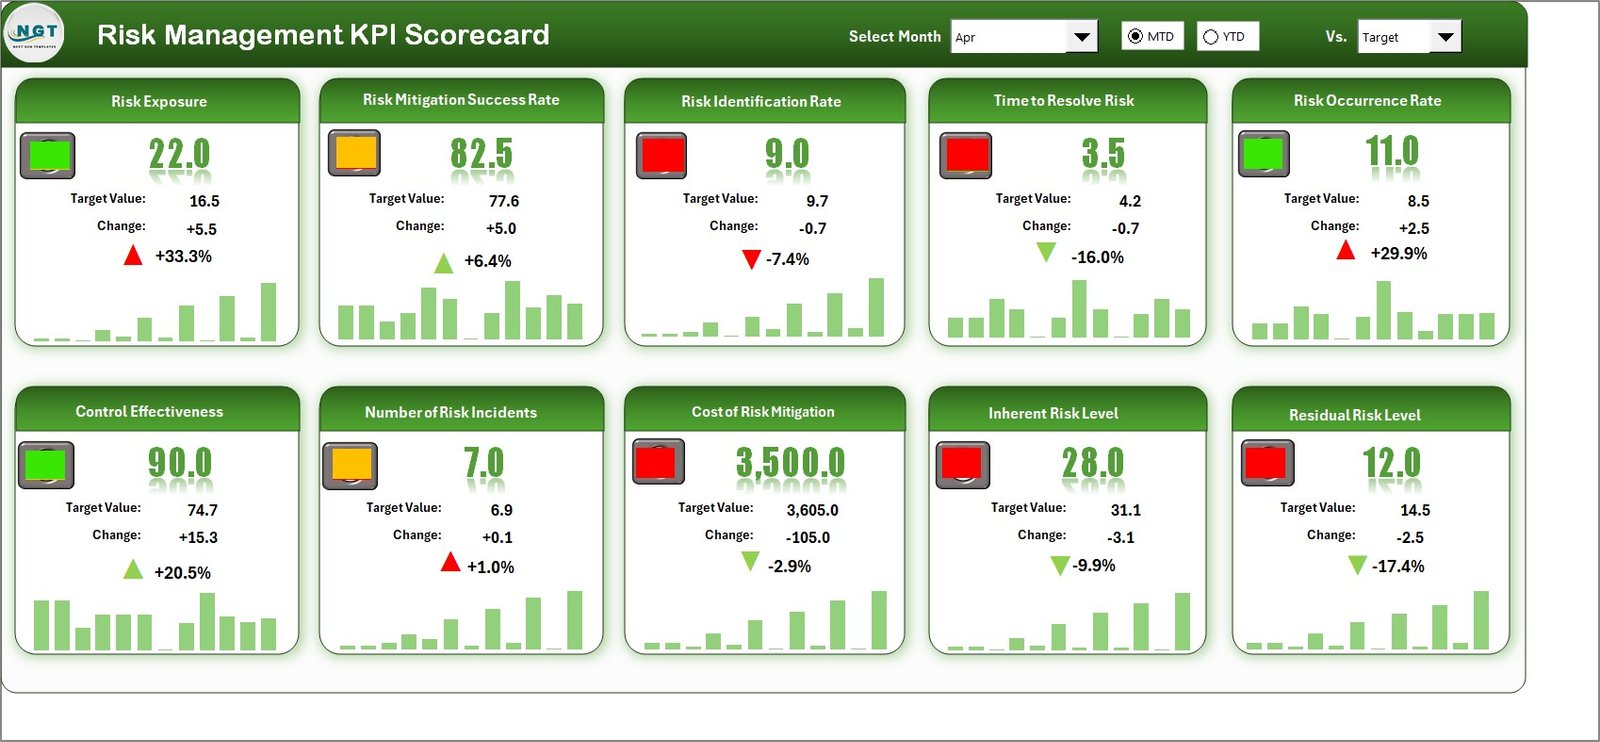
The Scorecard Sheet acts as the main interface where you can monitor risk KPIs visually.
Key Features:
-
🎯 Dropdown Menus: Select the Month, MTD (Month-to-Date), or YTD (Year-to-Date) performance periods for analysis.
-
📈 Actual vs Target Comparison: Instantly compare actual results against set targets for every KPI.
-
🚦 Visual Indicators: Color-coded symbols and conditional formatting make it easy to identify areas performing above or below expectations.
-
📋 Comprehensive KPI Overview: Each KPI’s performance is summarized, showing trends and overall progress at a glance.
This sheet gives management a holistic view of the organization’s risk status—helping them make data-backed decisions quickly.
2️⃣ KPI Trend Sheet – Deep Dive into Performance
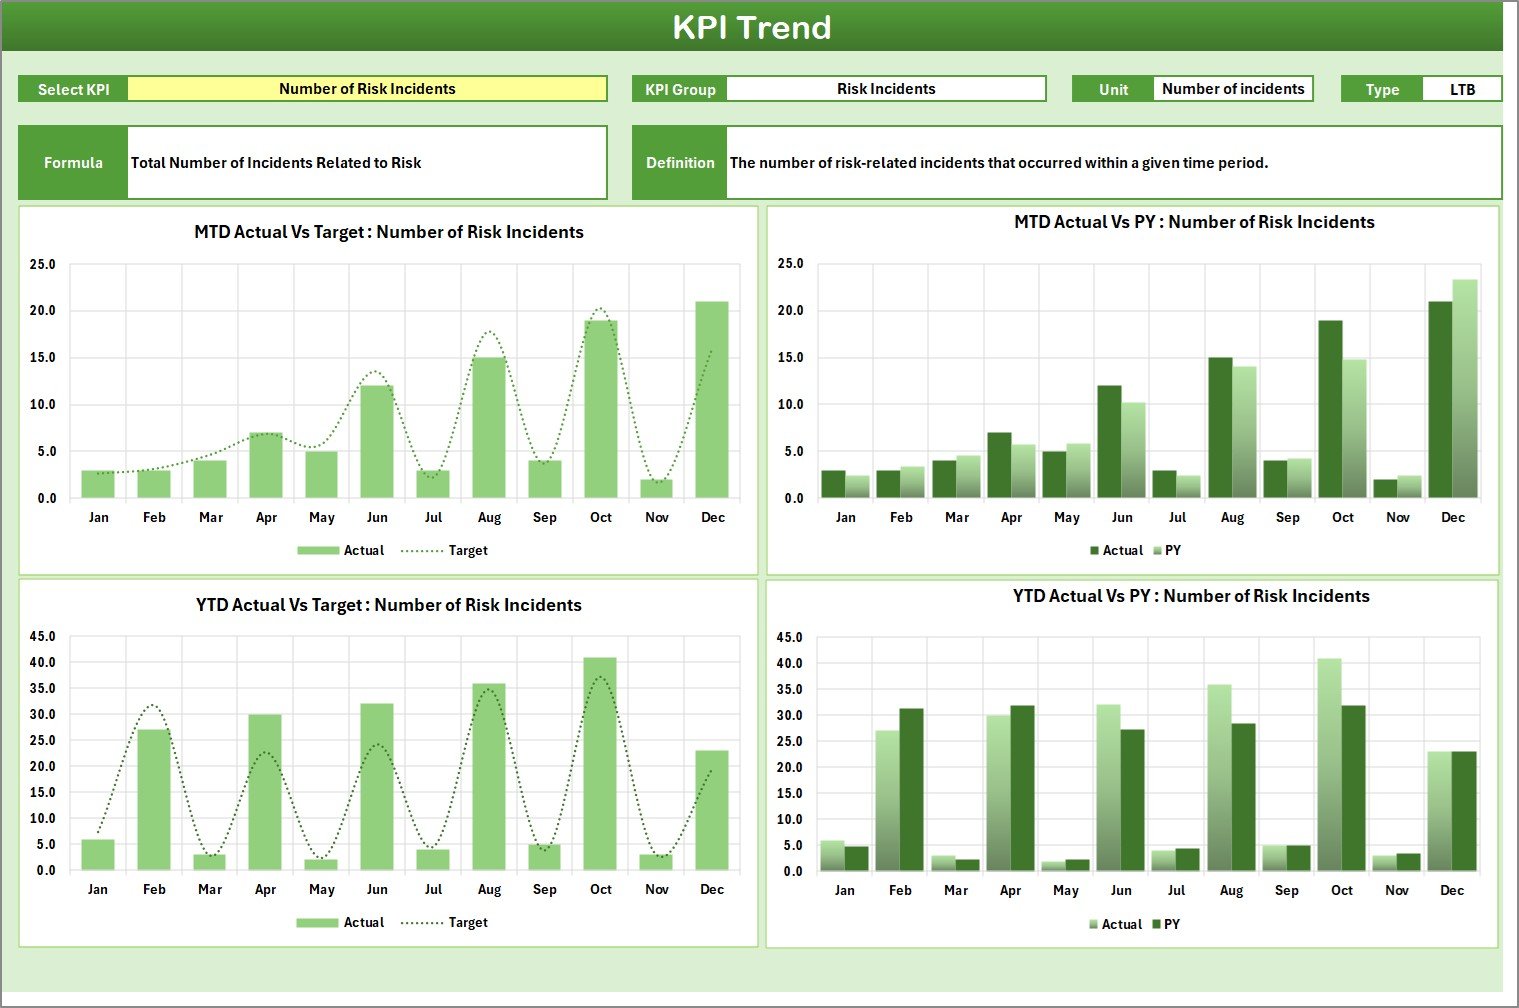
The KPI Trend Sheet provides a detailed look at how each KPI performs over time.
Key Components:
-
📊 KPI Selection: Choose a KPI from the dropdown in cell
C3to filter related details dynamically. -
🧮 KPI Attributes: View details like KPI Group, Unit of Measurement, Type (Lower the Better or Upper the Better), Formula, and Definition.
-
📉 Performance Chart: Visualize MTD and YTD trends for Actual, Target, and Previous Year (PY) numbers.
This sheet helps you identify long-term trends, performance fluctuations, and potential risk escalation patterns.
3️⃣ Input Data Sheet – Core Data Management
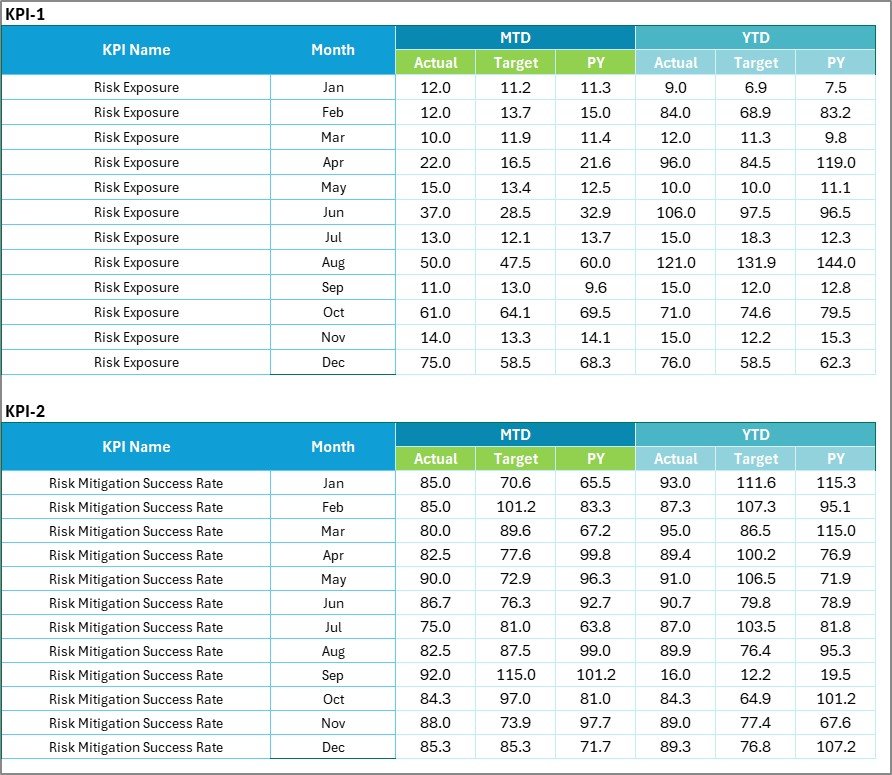
The Input Data Sheet is where all the backend data entry happens.
Highlights:
-
✍️ Data Entry Made Simple: Record actual values, targets, and previous year data in structured columns.
-
🔄 Dynamic Updates: When you add new data, all linked visuals and charts update automatically.
-
🔐 Data Validation: Ensures consistency and accuracy in recorded values.
This sheet makes maintaining and updating your KPIs easy—ensuring that your scorecard always reflects the latest performance data.
4️⃣ KPI Definition Sheet – Setting the Standards
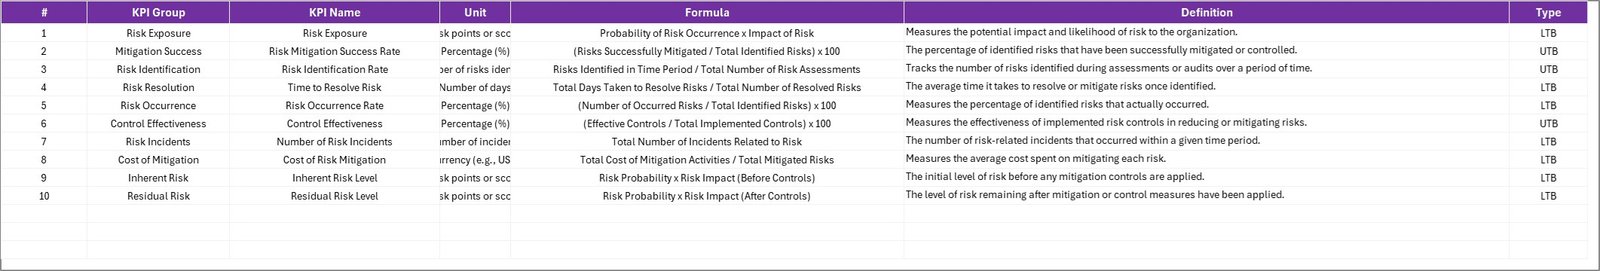
The KPI Definition Sheet contains the foundational data for all your risk KPIs.
Details You Can Define:
-
KPI Name
-
KPI Group
-
Unit of Measurement
-
Formula Used
-
KPI Definition
Having all KPI definitions in one place improves consistency and clarity across departments, ensuring everyone evaluates risk performance using the same criteria.
Click to Purchases Risk Management KPI Scorecard in Excel
🧠 Key Features of the Risk Management KPI Scorecard in Excel
Here’s why this tool stands out for professionals across industries:
✅ User-Friendly Layout: Designed for easy navigation with dropdowns, slicers, and conditional formatting.
📆 MTD and YTD Analysis: Enables month-to-date and year-to-date tracking of KPIs.
📈 Dynamic Visuals: Charts and color-coded indicators provide instant insights.
🔍 Customizable KPIs: Add, edit, or remove KPIs based on your organization’s needs.
🔄 Automatic Calculations: Predefined formulas ensure consistent and accurate computations.
📊 Data-Driven Decision-Making: Helps you identify risk hotspots and improvement opportunities faster.
How to Use the Risk Management KPI Scorecard
Follow these simple steps to get started:
-
Open the Template in Excel.
Go to the Home or Scorecard sheet for a quick overview. -
Enter KPI Definitions.
In the KPI Definition Sheet, specify the KPI name, formula, and unit. -
Update Input Data.
Record monthly data for Actual, Target, and PY values. -
Review Performance.
Go to the Scorecard or KPI Trend sheets to analyze visuals. -
Generate Insights.
Use conditional formatting and charts to highlight underperforming areas. -
Take Action.
Identify root causes and implement corrective measures to minimize risk.
💡 Advantages of the Risk Management KPI Scorecard in Excel
Implementing this tool provides multiple strategic and operational benefits.
🎯 1. Enhanced Risk Visibility
You can easily track all key risk indicators in one place, improving oversight and control.
⏱️ 2. Time Savings
Automated calculations and visuals save hours of manual report preparation.
📈 3. Data-Driven Decisions
Access real-time metrics that help you prioritize mitigation actions effectively.
🧩 4. Customization Flexibility
Modify KPIs, targets, and formulas to fit your organization’s unique risk framework.
💬 5. Improved Communication
Standardized visual reporting simplifies discussions between teams, departments, and stakeholders.
💵 6. Cost-Effective Solution
Unlike complex BI tools, Excel offers a low-cost yet powerful way to manage performance.
📊 7. Continuous Monitoring
With MTD and YTD comparisons, you can monitor how risks evolve across time and business cycles.
🔍 Opportunities for Improvement
Even the best tools have room to grow. Here are some potential areas for enhancing your Risk Management KPI Scorecard:
🔄 Integrate with Power BI: Combine Excel data with Power BI visuals for advanced reporting.
🌐 Automate Data Entry: Use Power Query or macros to pull data from external systems.
🧾 Expand KPI Definitions: Add qualitative metrics like risk culture or training effectiveness.
🔐 Add Access Control: Implement Excel protection layers to restrict editing.
📬 Create Automated Alerts: Add formulas or scripts that flag KPIs exceeding thresholds.
☁️ Cloud Collaboration: Use SharePoint or OneDrive for real-time multi-user updates.
Click to Purchases Risk Management KPI Scorecard in Excel
🧭 Best Practices for the Risk Management KPI Scorecard in Excel
Follow these practices to ensure maximum effectiveness and data reliability:
1️⃣ Define SMART KPIs
Make sure every KPI is Specific, Measurable, Achievable, Relevant, and Time-bound.
2️⃣ Standardize Data Entry
Use consistent formats for dates, units, and KPI names to avoid confusion.
3️⃣ Regularly Review Trends
Analyze the KPI Trend Sheet monthly to spot potential issues early.
4️⃣ Link KPIs to Business Objectives
Ensure each KPI aligns with organizational goals and risk mitigation strategies.
5️⃣ Use Visual Indicators Wisely
Apply conditional formatting logically to highlight critical metrics without cluttering visuals.
6️⃣ Update Data Frequently
Refresh your scorecard regularly to maintain accuracy and relevance.
7️⃣ Encourage Collaboration
Share the dashboard with department heads to foster collective responsibility in risk management.
8️⃣ Backup Data Periodically
Keep multiple backup copies to prevent data loss or accidental overwriting.
📘 Real-World Use Cases
The Risk Management KPI Scorecard in Excel is versatile and adaptable across multiple industries:
-
Finance and Banking: To track credit risks, liquidity, and market fluctuations.
-
Manufacturing: For monitoring equipment failure, supplier risks, and safety compliance.
-
Healthcare: To evaluate patient safety risks, compliance issues, and operational reliability.
-
IT and Cybersecurity: To measure incident frequency, data breaches, and recovery times.
-
Construction: To manage project overrun risks, safety incidents, and contract compliance.
-
Retail: To assess supply chain disruptions and inventory-related risks.
This tool ensures that every department maintains transparency and accountability in managing risks.
🧩 Why Excel Is Ideal for Risk Management Dashboards
Many professionals ask: “Why use Excel instead of Power BI or specialized tools?”
The answer is simple — Excel provides flexibility, accessibility, and control without requiring expensive software or advanced training.
Key Reasons:
-
No additional license cost.
-
Works offline and across all systems.
-
Supports formulas, pivot tables, and conditional formatting.
-
Easily integrated with Power BI for enhanced analytics.
-
Perfect for both small and medium enterprises.
📈 How This Template Improves Business Decision-Making
A well-designed Risk Management KPI Scorecard enhances your ability to make quick and effective decisions.
-
Identify early warning signs of risk escalation.
-
Compare risk performance across departments.
-
Track compliance and operational improvements.
-
Justify resource allocation based on quantitative data.
-
Support internal audits and board reporting with accurate insights.
🧾 Conclusion
In conclusion, the Risk Management KPI Scorecard in Excel is an indispensable tool for any organization seeking to monitor, control, and optimize its risk processes. It bridges the gap between complex data and actionable insights—allowing leaders to make informed decisions swiftly.
With dynamic dashboards, visual cues, and customizable metrics, this Excel-based solution empowers organizations to stay ahead of potential threats. Whether you’re improving compliance, assessing operational risks, or tracking strategic initiatives, this scorecard brings structure and clarity to your risk management strategy.
Click to Purchases Risk Management KPI Scorecard in Excel
Frequently Asked Questions (FAQs)
1. What is a Risk Management KPI?
A Risk Management KPI is a measurable indicator that helps track an organization’s risk exposure and mitigation performance.
2. Can I add or modify KPIs in the Excel Scorecard?
Yes, the template is fully editable. You can add new KPIs, change formulas, or update target thresholds.
3. Does the scorecard support automatic updates?
Absolutely. Once you update the Input Data Sheet, all linked visuals and charts refresh automatically.
4. Is this template suitable for small businesses?
Yes. It’s designed for scalability—perfect for startups, SMEs, and large corporations alike.
5. How often should I update the data?
It’s best to update KPI data monthly or quarterly, depending on your organization’s reporting cycle.
6. Can this scorecard integrate with Power BI or other tools?
Yes. You can easily export data from Excel to Power BI or link using Power Query for advanced analysis.
7. What kind of charts are included?
The scorecard includes line charts for trends, bar charts for performance, and color-coded KPI status indicators.
8. How does conditional formatting help?
Conditional formatting instantly highlights KPIs performing above or below target, helping you focus on critical risks first.
9. Is it possible to track YTD and MTD performance separately?
Yes, dropdown options allow you to switch between Month-to-Date (MTD) and Year-to-Date (YTD) analysis views.
10. Who can benefit from this scorecard?
Risk managers, compliance officers, auditors, and senior executives can all leverage this tool for better decision-making.
Click to Purchases Risk Management KPI Scorecard in Excel
Visit our YouTube channel to learn step-by-step video tutorials