In today’s competitive world, every organization needs to plan strategically. Without a structured plan, even the most innovative ideas fail to deliver consistent results. That’s where a Strategic Planning Report in Excel comes in — it transforms your business goals into measurable insights and provides a data-driven path for success.
This article will help you understand what a Strategic Planning Report is, how to use it effectively, what insights you can generate from it, and why Excel remains one of the best tools for strategic performance management.
Click to Purchases Strategic Planning Report in Excel
What Is a Strategic Planning Report in Excel?
A Strategic Planning Report in Excel is a structured template that tracks, measures, and visualizes your organization’s progress toward key goals. It helps you link strategy with action by combining financial metrics, project completion data, and departmental performance into one easy-to-read report.
Instead of manually updating lengthy presentations, this Excel report allows managers to monitor KPIs (Key Performance Indicators), analyze budget vs. spend, and review goal completion percentages in real time.
Structure of the Strategic Planning Report in Excel
Our ready-to-use Strategic Planning Report in Excel contains three main pages — each designed to simplify performance monitoring and data analysis.
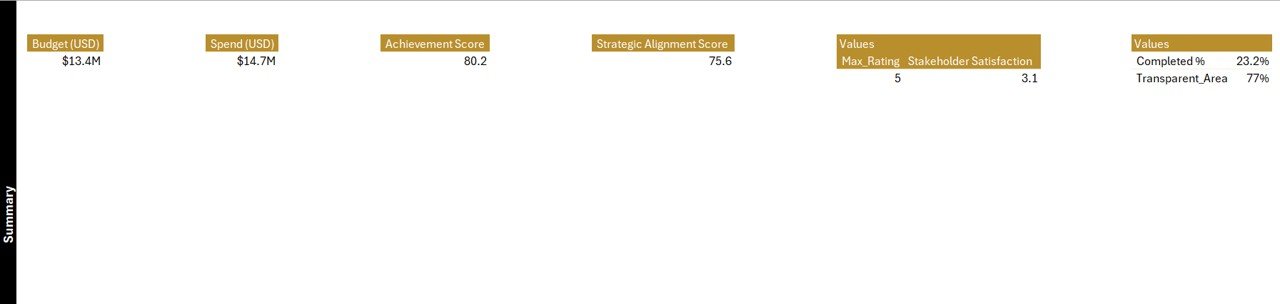
1️⃣ Summary Page
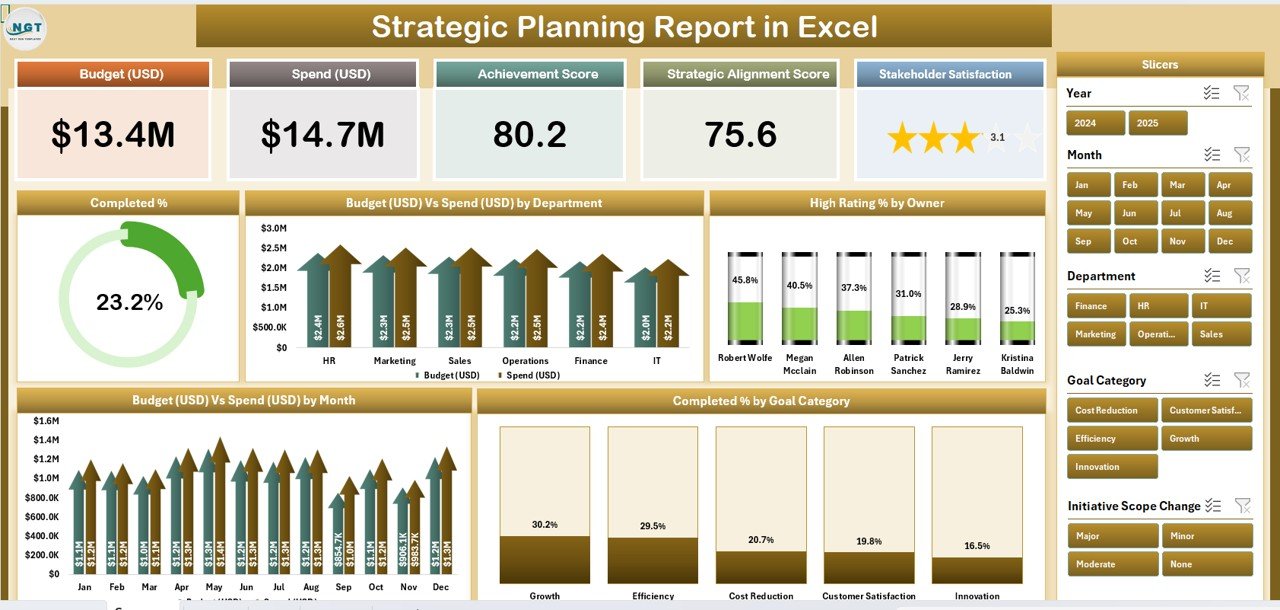
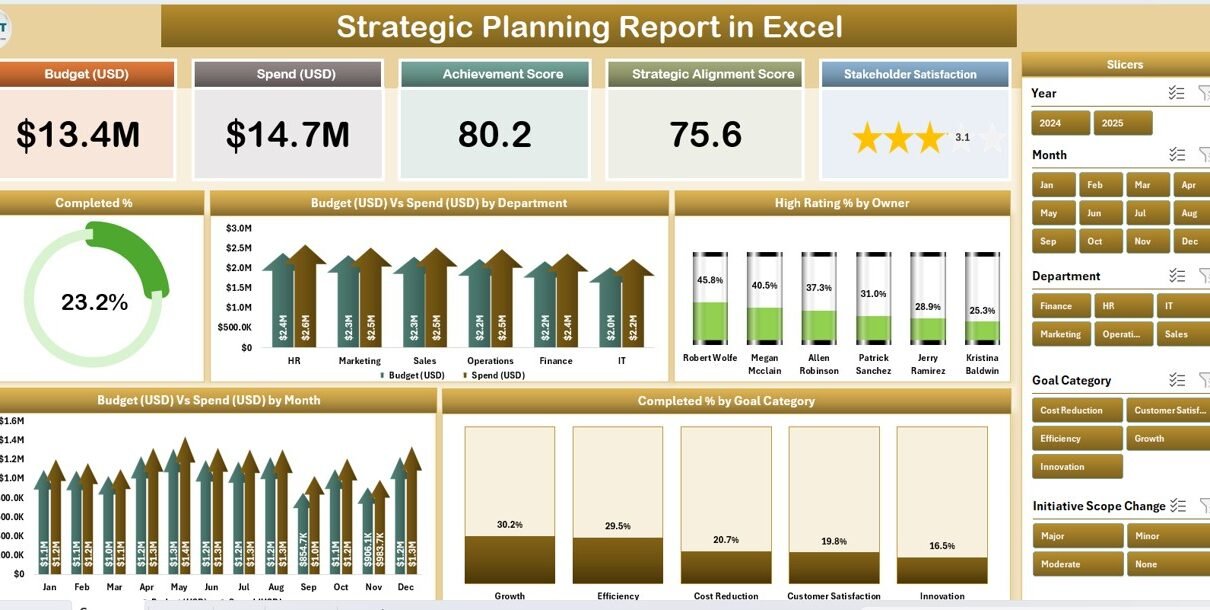
The Summary Page acts as the control center of your strategic planning process. It includes:
-
Top 5 KPI Cards: These display high-level metrics such as Total Goals, Completed %, Budget Utilized, High Ratings %, and Ongoing Projects.
-
Right-Side Slicer Panel: This allows users to filter results by department, goal category, or time period.
-
Five Insightful Charts:
✅ Completed % by Goal Category — Tracks progress across strategic goals.
✅ Budget (USD) vs. Spend (USD) by Department — Evaluates departmental efficiency.
✅ High Rating % by Owner — Highlights individual or team performance.
✅ Budget (USD) vs. Spend (USD) by Month — Shows spending trends over time.
✅ Overall Completion Trend — Provides a quick overview of goal achievement.
Together, these visuals make the Summary Page a perfect dashboard for top management to monitor strategy execution at a glance.
2️⃣ Report Page
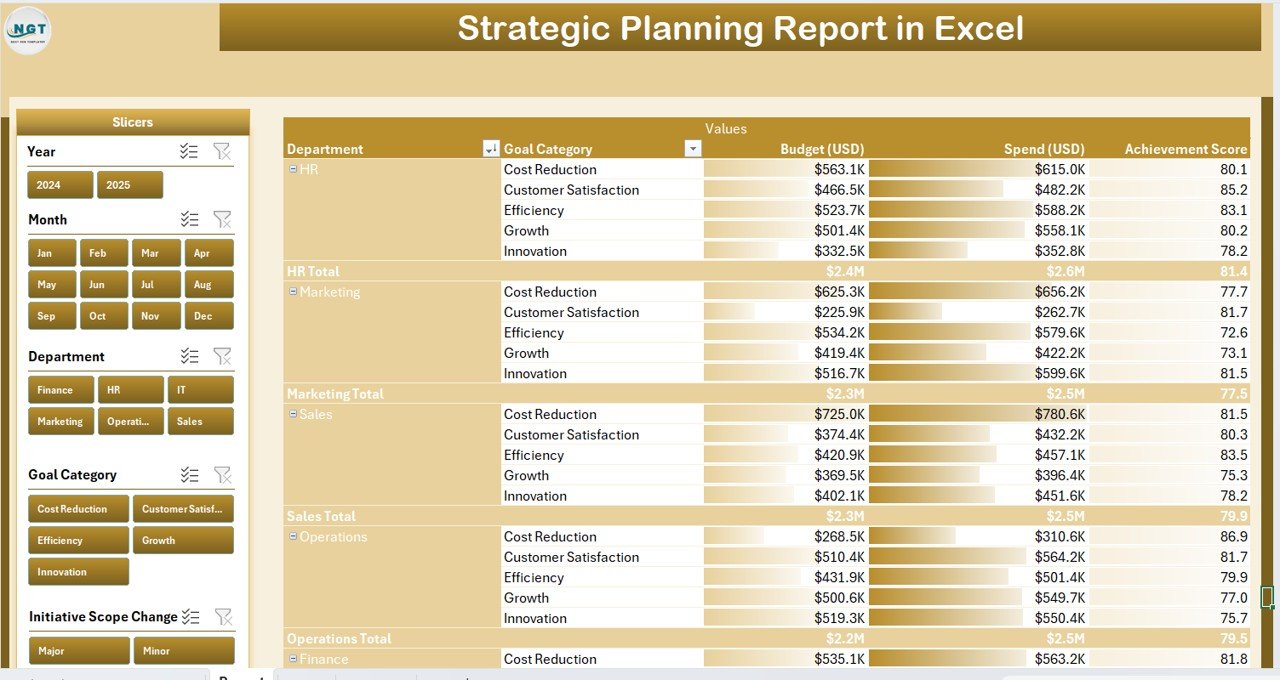
The Report Page contains a detailed table supported by filters and slicers.
You can explore specific areas such as departments, project owners, goal categories, or timelines.
Key features include:
-
Left-side slicers for interactive filtering
-
A data table displaying Goal Name, Department, Owner, Status, Completion %, Rating, Budget, and Spend
-
Conditional formatting to highlight underperforming or overspending areas
This page bridges the gap between high-level insights and granular operational details. It’s ideal for departmental heads and analysts who need actionable insights.
3️⃣ Data Sheet
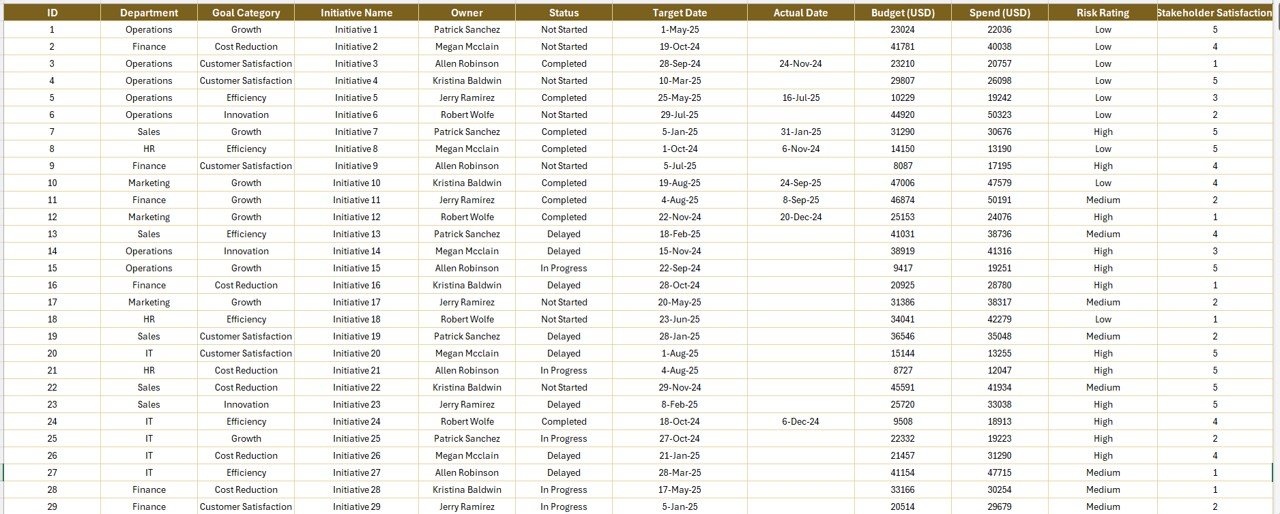
The Data Sheet is the backbone of the entire report. It stores all raw data used to populate charts and summaries.
Here you can find:
-
Records of all goals and targets
-
Departmental budgets and monthly spending
-
Ratings, completion percentages, and deadlines
Since this sheet drives the calculations, it’s important to keep it clean and consistently formatted.
4️⃣ Support Sheet
The Support Sheet contains reference tables such as:
-
Drop-down list values (e.g., departments, goal categories, owners)
-
Lookup tables for calculations
-
Color codes or KPI thresholds used in conditional formatting
This ensures consistency and helps maintain automation in the report.
Why Use Excel for Strategic Planning?
Excel remains one of the most flexible and accessible tools for strategic planning and analysis. Here’s why it stands out:
🧮 Customizable Structure: You can adapt templates for any business function or industry.
📈 Built-in Analytics: Pivot tables, slicers, and charts make it easy to visualize progress.
🔄 Seamless Integration: You can import data from ERP systems, CRMs, or project trackers.
🧰 No Extra Software Required: Everything runs in Microsoft Excel, which most organizations already use.
By using Excel, organizations can manage strategic data efficiently and make faster, evidence-based decisions.
Click to Purchases Strategic Planning Report in Excel
How to Use the Strategic Planning Report in Excel
Follow these simple steps to get started:
Step 1: Input or Import Data
Open the Data Sheet and fill in essential fields such as Goal Name, Department, Owner, Start Date, Budget, and Completion %.
Step 2: Review Calculations
Ensure that formulas for Budget vs. Spend, Completion %, and High Rating % are working correctly.
You can add or remove columns depending on your reporting needs.
Step 3: Analyze the Summary Page
Use the slicers to filter the dashboard by department, goal category, or timeline.
Watch the KPI cards and charts update instantly.
Step 4: Dive into Details
Visit the Report Page for an in-depth review of each goal’s progress.
Apply filters to view specific departments or owners and identify areas that need attention.
Step 5: Present the Insights
Use the dashboard visuals directly in meetings or export charts to PowerPoint and PDF.
The report layout ensures professional and board-ready presentations.
Real-World Applications of the Strategic Planning Report
You can use this Excel report across a variety of business functions, such as:
-
Corporate Strategy Teams: To align long-term goals with departmental performance.
-
Finance Departments: To monitor budgets and optimize resource allocation.
-
Human Resources: To evaluate performance ratings and employee development goals.
-
Operations Managers: To track the completion status of key operational initiatives.
-
Project Management Offices: To measure success across projects and report progress to leadership.
The flexibility of Excel makes it suitable for small businesses as well as enterprise-level strategic reviews.
How to Customize the Strategic Planning Report
Customization is one of the strongest advantages of Excel. Here’s how you can tailor this report to your organization’s needs:
-
Add KPI Columns: Include additional metrics such as ROI, variance %, or milestone count.
-
Modify Slicers: Add filters for regions, project types, or teams.
-
Change Visual Styles: Update color themes or chart types for a consistent corporate look.
-
Automate Updates: Use simple VBA macros or Power Query to refresh data automatically.
-
Protect Data: Lock specific cells and use password protection for data integrity.
These small tweaks help you convert a generic report into a customized strategic performance tool.
Advantages of the Strategic Planning Report in Excel
Here are the top benefits organizations gain from using this report:
1️⃣ Better Decision-Making
The dashboard provides instant visibility into budgets, completion rates, and performance scores. Leaders can make informed decisions quickly.
2️⃣ Improved Accountability
By assigning goals and ownership to departments or individuals, everyone stays accountable for outcomes.
3️⃣ Centralized Data
All performance information is stored in one Excel file, reducing duplication and confusion.
4️⃣ Real-Time Insights
Slicers and formulas update instantly when new data is added, giving management real-time visibility.
5️⃣ Enhanced Collaboration
The report promotes transparency between departments and helps teams work toward common goals.
6️⃣ Easy Presentation
Professionally designed charts and KPI cards make it easy to communicate progress to stakeholders.
7️⃣ Cost-Effective Tool
No expensive software or training required — Excel provides everything you need for strategic analysis.
Opportunities for Improvement
Even the best reports can evolve. Consider the following enhancements:
🔄 Automate monthly updates using Power Query.
📅 Integrate with Outlook for automated goal review reminders.
💻 Add interactive dashboards using Power BI for deeper analytics.
📢 Include comments or notes sections for qualitative feedback.
🧩 Link the report with HR or financial databases for real-time data sync.
These improvements ensure your report remains scalable and relevant as your organization grows.
Best Practices for Creating a Strategic Planning Report in Excel
To get the most value from your report, follow these best practices:
-
Keep Data Structured: Maintain uniform headers and formats across sheets.
-
Use Meaningful KPIs: Focus on metrics that truly measure strategic impact.
-
Maintain Version Control: Save monthly or quarterly versions for historical analysis.
-
Apply Conditional Formatting: Use icons and color scales to highlight key trends.
-
Ensure Data Validation: Add drop-down lists to minimize input errors.
-
Link Data Dynamically: Use formulas such as
=SUMIFSor=AVERAGEIFSfor accurate summaries. -
Create Interactive Visuals: Add slicers, timelines, and pivot charts for dynamic reporting.
-
Back Up Regularly: Keep a backup copy to prevent accidental data loss.
-
Document Calculations: Add a short note explaining key formulas and logic.
-
Review Monthly: Conduct periodic reviews to refine KPIs and align them with changing goals.
Example Use Case: A Strategic Planning Report for a Marketing Department
Click to Purchases Strategic Planning Report in Excel
Let’s imagine a Marketing Department using this Excel report:
-
Goals include Increase Brand Awareness, Boost Lead Conversion, and Launch New Campaigns.
-
Each goal has assigned owners, budgets, and timelines.
-
The department updates completion status monthly.
-
The dashboard automatically recalculates completion % and budget utilization.
In team meetings, management can instantly see:
-
Which campaigns are on track
-
Which areas need additional funding
-
How overall marketing efficiency is improving quarter by quarter
This simple yet powerful example shows how Excel reporting drives strategic clarity.
Conclusion
A Strategic Planning Report in Excel helps organizations translate strategy into measurable results. It connects goals, budgets, and performance in one centralized system, empowering decision-makers to act fast and stay focused.
By combining structured data, dynamic charts, and easy navigation, this Excel-based report simplifies performance management and enhances visibility across all business levels.
Whether you manage a startup or a large enterprise, this tool ensures every department contributes to the organization’s long-term success.
❓ Frequently Asked Questions (FAQs)
1. What is the purpose of a Strategic Planning Report in Excel?
It provides a clear view of organizational goals, budgets, and completion progress in one place, helping leaders make better decisions.
2. Can I customize the report for different departments?
Yes. You can easily modify slicers, charts, and data columns to suit the specific needs of each department.
3. How often should I update the report?
Ideally, update it monthly or quarterly depending on your organization’s reporting frequency.
4. Is Excel suitable for large organizations?
Absolutely. Excel can handle large datasets and be integrated with Power BI or Power Query for advanced analytics.
5. What makes this report better than a manual presentation?
It provides dynamic, auto-updating visuals and eliminates the need to recreate reports every month.
6. Can I use this for project tracking as well?
Yes, the structure works perfectly for tracking project completion, resource allocation, and budget adherence.
7. How can I make the report more interactive?
Add slicers, conditional formatting, and hyperlinks to jump between sheets for a seamless navigation experience.
Visit our YouTube channel to learn step-by-step video tutorials