The electronics industry operates in a highly competitive and innovation-driven environment. From manufacturing and supply chain efficiency to customer satisfaction and after-sales service, every metric matters. To maintain a competitive edge, businesses need a simple yet powerful way to track performance.
That’s where the Electronics KPI Scorecard in Excel becomes a game changer. This ready-to-use Excel template helps organizations analyze performance across multiple areas — production, sales, quality, and customer service — all in one dashboard.
In this article, you’ll explore everything about this scorecard — its features, structure, advantages, and best practices — to help you make smarter, faster, and more confident business decisions.
Click to Purchases Electronics KPI Scorecard in Excel
💡 What Is an Electronics KPI Scorecard in Excel?
An Electronics KPI Scorecard is a performance measurement tool that tracks key performance indicators (KPIs) across your business processes. Built in Microsoft Excel, it brings together data from various sources to show how your company is performing compared to set goals.
It helps management teams analyze real-time performance, identify bottlenecks, and take data-backed decisions to boost efficiency, profitability, and customer satisfaction.
Instead of manually maintaining multiple reports, this Excel-based scorecard gives you a single, centralized view of all metrics — including production output, defect rate, order fulfillment, and warranty claims.
🧩 Key Features of the Electronics KPI Scorecard in Excel
The Electronics KPI Scorecard is built with user-friendly navigation, automated calculations, and visually appealing charts. It includes four major worksheet tabs, each playing an essential role in the KPI management process.
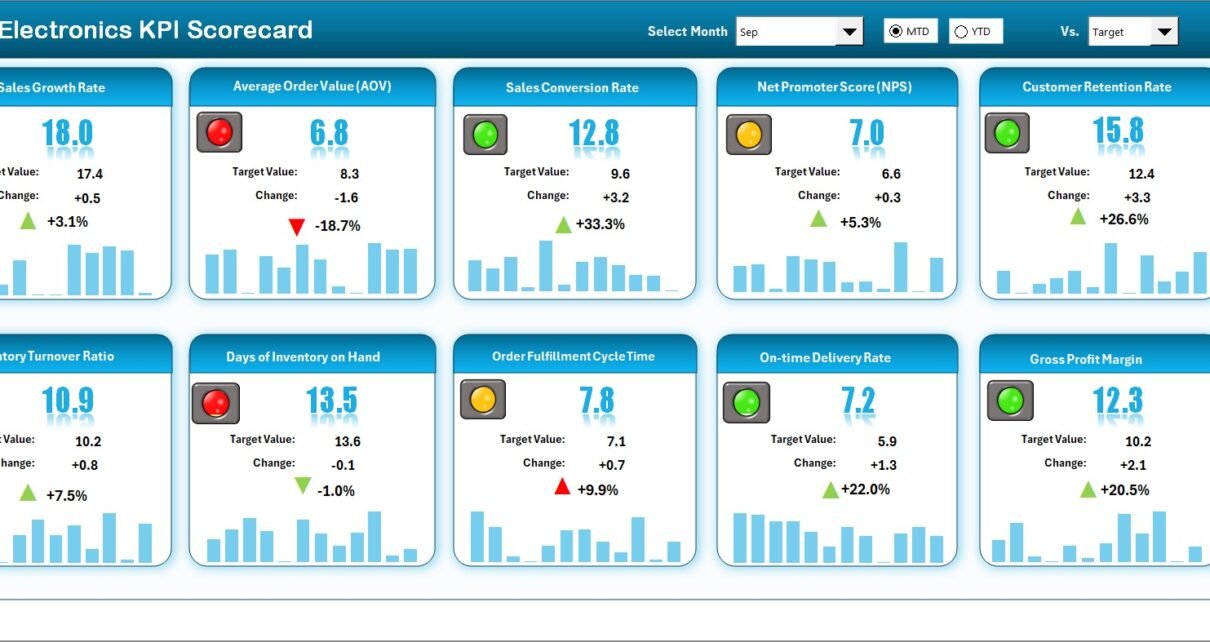
1️⃣ Scorecard Sheet — The Central Dashboard
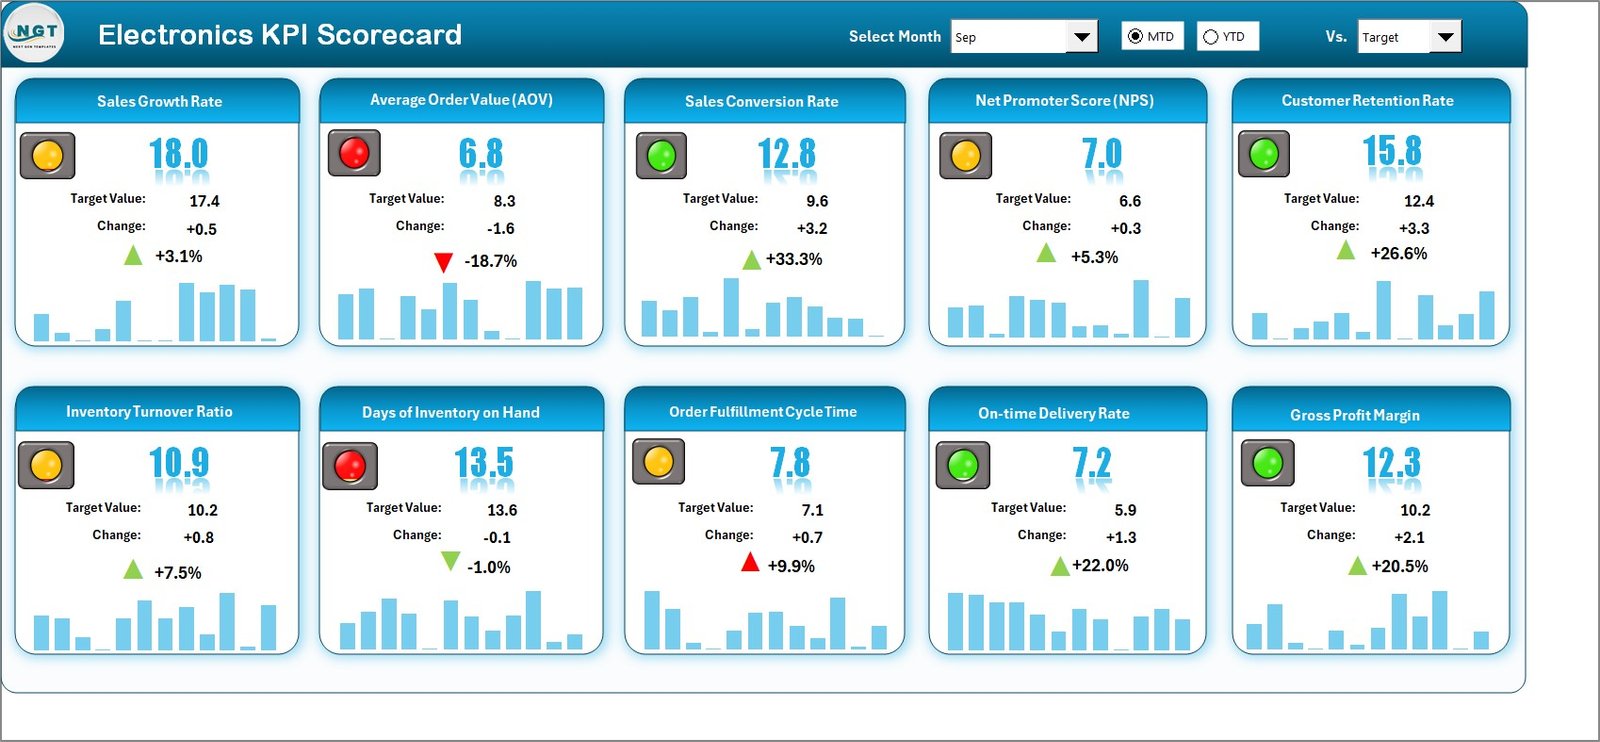
The Scorecard Sheet is the main dashboard of your KPI Scorecard. It presents your organization’s performance in an interactive and visual format.
Key Features:
-
🎛 Dropdown Menus: Select the desired month and choose between MTD (Month-to-Date) and YTD (Year-to-Date) analysis.
-
📊 Actual vs Target Comparison: View how your actual results stack up against your target values.
-
🟢 Color Indicators: Instantly identify performance trends using conditional formatting with up/down arrows and color codes.
-
📋 Comprehensive Overview: Display KPI Group, KPI Name, Unit, Actuals, Targets, Variance, and Performance Status in one glance.
This sheet acts as the control center for performance management, helping managers monitor both operational and strategic KPIs.
2️⃣ KPI Trend Sheet — Visualize Progress Over Time
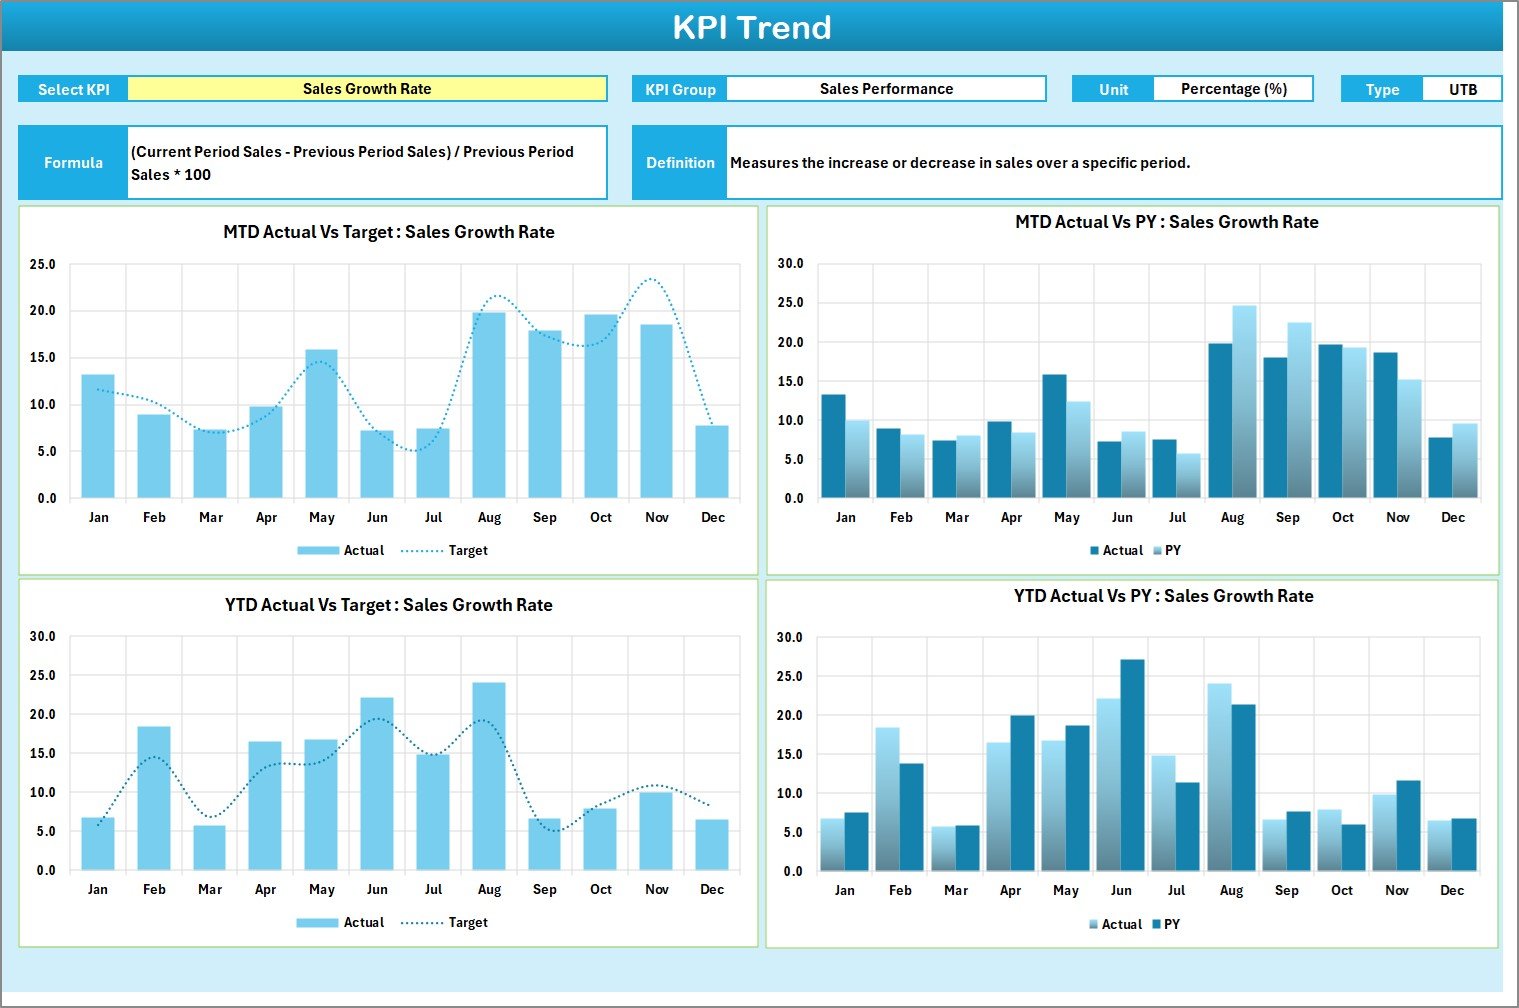
The KPI Trend Sheet provides a detailed analysis of each KPI’s historical performance. By selecting a KPI name from the dropdown (cell C3), you can instantly view:
-
KPI Group and Category
-
Unit of Measurement
-
Type of KPI (LTB – Lower the Better, or UTB – Upper the Better)
-
Formula and KPI Definition
The sheet also includes dynamic line charts that show MTD and YTD trends for Actual, Target, and Previous Year (PY) values.
This visual trend analysis allows leaders to track long-term improvements, detect deviations early, and make informed adjustments in real time.
3️⃣ Input Data Sheet — The Backbone of Your Scorecard
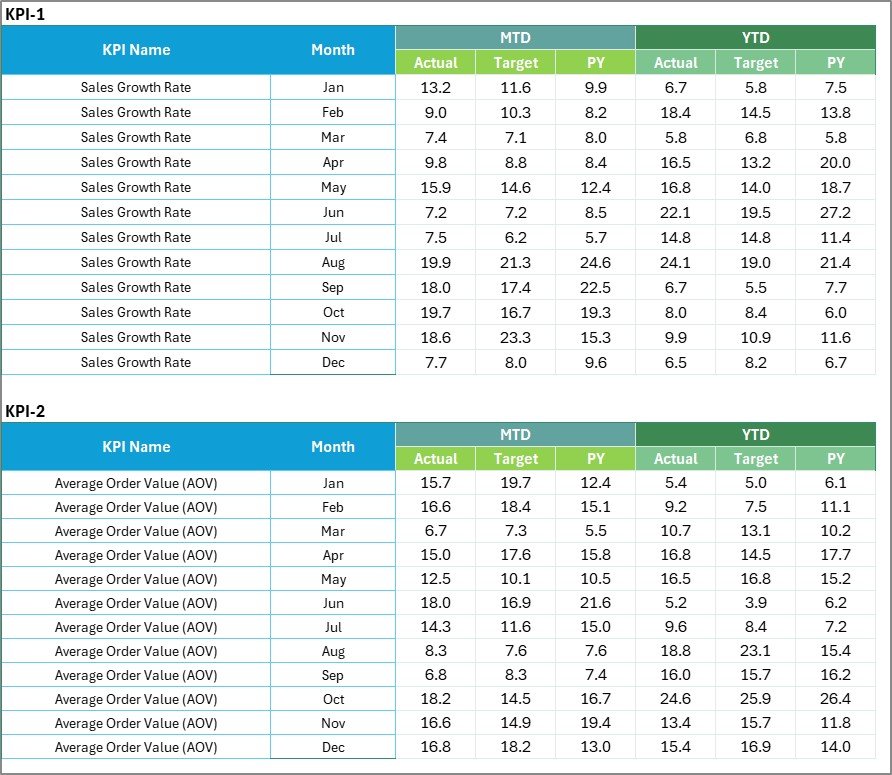
All KPI data originates from the Input Data Sheet. It serves as your organization’s performance database.
Functions:
-
✍️ Data Entry: Record all monthly KPI figures such as actual results, targets, and PY numbers.
-
🔄 Auto-Update: Whenever new data is entered, the Scorecard and Trend sheets update automatically.
-
🔐 Accuracy and Flexibility: Maintain data integrity while allowing easy customization of metrics and values.
With this setup, you can effortlessly add new months or KPIs as your organization grows.
4️⃣ KPI Definition Sheet — The Reference Dictionary
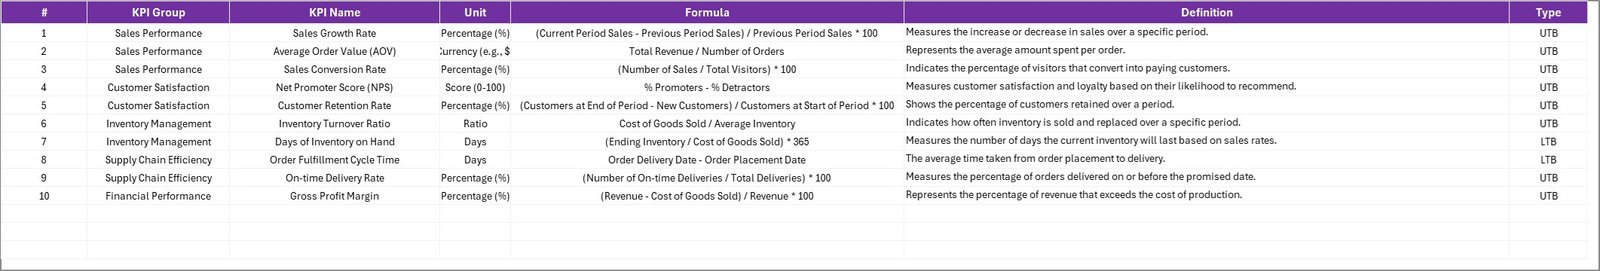
The KPI Definition Sheet serves as a quick reference guide for all KPIs used in the scorecard.
It contains:
-
KPI Name
-
KPI Group (Production, Sales, Quality, etc.)
-
Unit of Measurement
-
Formula
-
Definition
This ensures every team member understands how each KPI is calculated and interpreted. It also helps in maintaining consistency across departments.
Click to Purchases Electronics KPI Scorecard in Excel
⚙️ How Does the Electronics KPI Scorecard Work?
The scorecard functions through interconnected sheets that automate calculations and visualizations.
Here’s how it works step by step:
-
Enter Data: Record actual and target values for all KPIs in the Input Data Sheet.
-
Auto Calculation: Excel automatically computes MTD and YTD performance figures.
-
Visualization: The Scorecard and Trend sheets display data through charts and color-coded visuals.
-
Analysis: Managers and teams review insights and plan corrective actions.
This seamless structure ensures real-time performance visibility and eliminates manual errors.
🔋 Common KPIs in an Electronics KPI Scorecard
Depending on your company’s goals, you can track a variety of KPIs across production, sales, quality, and customer satisfaction.
🏭 Manufacturing KPIs
-
Production Yield (%)
-
Machine Downtime (Hours)
-
Defect Rate (%)
-
Equipment Utilization (%)
-
Manufacturing Lead Time
💼 Sales & Distribution KPIs
-
Total Sales Revenue
-
On-Time Delivery (%)
-
Order Fulfillment Rate
-
Average Selling Price
-
Return Rate (%)
🔧 Quality Control KPIs
-
First Pass Yield (FPY)
-
Customer Complaints per 1000 Units
-
Warranty Claim Rate
-
Product Recall Rate
📦 Inventory & Supply Chain KPIs
-
Inventory Turnover Ratio
-
Supplier Lead Time
-
Material Cost Variance
-
Stock-Out Frequency
💰 Financial KPIs
-
Gross Profit Margin (%)
-
Operating Cost Ratio
-
Revenue per Employee
-
Budget Utilization (%)
These KPIs can be customized according to your organization’s structure and priorities.
🚀 Advantages of the Electronics KPI Scorecard in Excel
Using an Excel-based KPI scorecard brings numerous benefits to electronics businesses. Let’s explore the key advantages below.
1. 📊 Centralized Performance Management
All business metrics are consolidated in one file, making performance tracking seamless and time-efficient.
2. ⚡ Real-Time Data Insights
As soon as data updates in the Input Sheet, the Scorecard and Trend visuals refresh automatically.
3. 🎯 Improved Decision-Making
Leaders can easily identify performance gaps, analyze reasons behind them, and plan effective strategies.
4. 💪 Increased Accountability
Assigning each KPI to a department or team fosters ownership and performance accountability.
5. 🧩 Full Customization
Users can modify KPIs, adjust formulas, or add new sheets without coding or specialized software.
6. 💵 Cost-Effective Solution
Unlike expensive BI tools, Excel provides a budget-friendly yet powerful performance tracking solution.
7. 📈 Historical Trend Analysis
The Trend sheet provides long-term performance visualization, enabling accurate forecasting and benchmarking.
8. 💼 Business Scalability
The template supports expansion — new KPIs, departments, or products can be easily integrated.
🔧 How to Use the Electronics KPI Scorecard Effectively
To get maximum benefit from this Excel template, follow these simple yet impactful steps:
-
Define Clear Objectives: Decide what success looks like for your business.
-
Select Relevant KPIs: Focus on metrics that align with your goals.
-
Collect Accurate Data: Maintain reliable data entry sources.
-
Visualize Trends: Use charts and conditional formatting to interpret data faster.
-
Review Regularly: Conduct monthly or quarterly performance meetings.
-
Collaborate Across Teams: Encourage cross-functional discussion on KPI performance.
-
Take Action: Implement decisions based on actual insights, not assumptions.
🧠 Example: Applying the KPI Scorecard in an Electronics Company
Let’s imagine a Consumer Electronics Manufacturer using this KPI Scorecard.
-
The Input Data Sheet records monthly data for production yield, machine downtime, and defect rates.
-
The Scorecard Sheet shows Actual vs Target performance, with color-coded indicators.
-
The Trend Sheet highlights year-over-year improvement in output efficiency.
-
The KPI Definition Sheet explains how “Defect Rate (%)” and “On-Time Delivery (%)” are calculated.
With these insights, the company can quickly identify production bottlenecks, optimize resources, and reduce quality issues — leading to higher profitability.
Click to Purchases Electronics KPI Scorecard in Excel
🧩 Opportunities for Improvement
Even though the Excel-based KPI Scorecard is powerful, it can always evolve. Here are ways to enhance its functionality:
-
🔄 Add Power Query for automated data imports.
-
📊 Integrate Power BI visuals for advanced analytics.
-
📈 Include pivot tables for department-level breakdowns.
-
🧮 Create macros for one-click monthly updates.
-
💾 Connect with Google Sheets for real-time collaboration.
-
🧱 Build comparison dashboards for year-on-year analysis.
These additions can elevate your scorecard from a basic reporting tool to a full-fledged performance intelligence system.
🌟 Best Practices for the Electronics KPI Scorecard in Excel
To ensure your scorecard stays accurate, efficient, and easy to use, follow these best practices:
✅ 1. Keep It Simple
Track only essential KPIs that drive performance. Avoid clutter.
✅ 2. Use Visual Indicators
Apply arrows or icons to quickly show improvement or decline.
✅ 3. Automate Calculations
Use Excel formulas for MTD, YTD, and variance values to minimize manual errors.
✅ 4. Maintain Data Integrity
Protect formula cells and critical ranges from unwanted edits.
✅ 5. Update Regularly
Input data promptly after every production cycle or sales period.
✅ 6. Train Teams
Educate staff on how to enter and interpret KPI data correctly.
✅ 7. Review Quarterly
Compare trends quarterly to align performance with long-term strategic goals.
By following these best practices, your scorecard will remain a reliable decision-making tool throughout your organization.
🏁 Conclusion
The Electronics KPI Scorecard in Excel is an essential tool for any electronics manufacturer, retailer, or service provider aiming for performance excellence.
It simplifies complex data into a single, interactive interface — helping you track targets, visualize trends, and make informed business decisions.
Whether you want to monitor production efficiency, improve quality, or manage financial performance, this Excel-based scorecard is your key to a smarter, faster, and more transparent business process.
With structured data, actionable insights, and visual analytics, you can ensure your organization consistently performs at its peak.
Click to Purchases Electronics KPI Scorecard in Excel
❓ Frequently Asked Questions (FAQs)
1. What is the purpose of the Electronics KPI Scorecard?
It helps organizations track and evaluate business performance across production, sales, quality, and financial areas.
2. Can I modify the KPIs in this Excel scorecard?
Yes, it’s fully customizable — you can add, remove, or edit KPIs based on your specific business requirements.
3. Do I need Excel expertise to use it?
No, even beginners can use this template easily. It includes automated formulas and dropdowns for effortless navigation.
4. Is this scorecard suitable for small businesses?
Absolutely. Small, medium, and large enterprises can all benefit from this cost-effective Excel solution.
5. How often should I update the data?
You should update the scorecard monthly or after every production cycle to maintain accurate insights.
6. Can it track both operational and financial KPIs?
Yes. It can handle manufacturing, sales, quality, and finance-related KPIs in one unified view.
7. What makes it different from a Power BI dashboard?
While Power BI offers advanced visualization, Excel provides more control, flexibility, and offline access — making it ideal for most teams.
8. Can I link this Excel file with other data sources?
Yes. You can use Power Query to import data automatically from databases, CSV files, or online systems.
9. How can I share the scorecard with my team?
You can share the Excel file via email or upload it to cloud platforms like OneDrive or Google Drive for collaboration.
10. Is it cost-effective compared to software tools?
Definitely. It eliminates the need for expensive performance-tracking software while delivering similar analytical power.
Click to Purchases Electronics KPI Scorecard in Excel
Visit our YouTube channel to learn step-by-step video tutorials