In today’s data-driven education environment, school administrators must continuously track performance to make smart decisions. From student attendance to teacher efficiency, every number tells a story about institutional success. The Secondary Schools KPI Dashboard in Excel offers a powerful yet simple way to monitor academic, operational, and financial KPIs in one dynamic view.
This ready-to-use Excel template transforms raw school data into meaningful insights — helping principals, administrators, and teachers manage performance more effectively.
💡 What Is a Secondary Schools KPI Dashboard in Excel?
A Secondary Schools KPI Dashboard is an analytical tool built in Excel to track key performance indicators (KPIs) across all areas of school operations.
Instead of relying on scattered reports, this dashboard consolidates data from multiple sheets to present a unified snapshot of school performance. It helps education leaders measure progress, compare results with targets, and identify trends that impact students and staff alike.
This dashboard covers every essential area — academics, attendance, teacher performance, infrastructure, and finance — all in one place.
Click to Purchases Secondary Schools KPI Dashboard in Excel
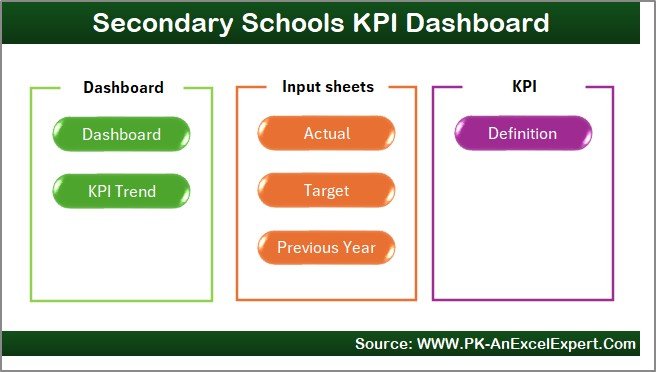
🧩 Structure of the Secondary Schools KPI Dashboard in Excel
The Secondary Schools KPI Dashboard includes seven well-designed worksheets, each serving a specific function to streamline school performance monitoring.
1️⃣ Home Sheet — The Starting Point
The Home Sheet acts as the main navigation page.
It includes six interactive buttons that help users quickly jump to other sheets — Dashboard, KPI Trend, Input Data, Target, Previous Year, and KPI Definition.
This structure ensures the file is easy to navigate even for users with limited Excel experience.
2️⃣ Dashboard Sheet — The Central Performance View
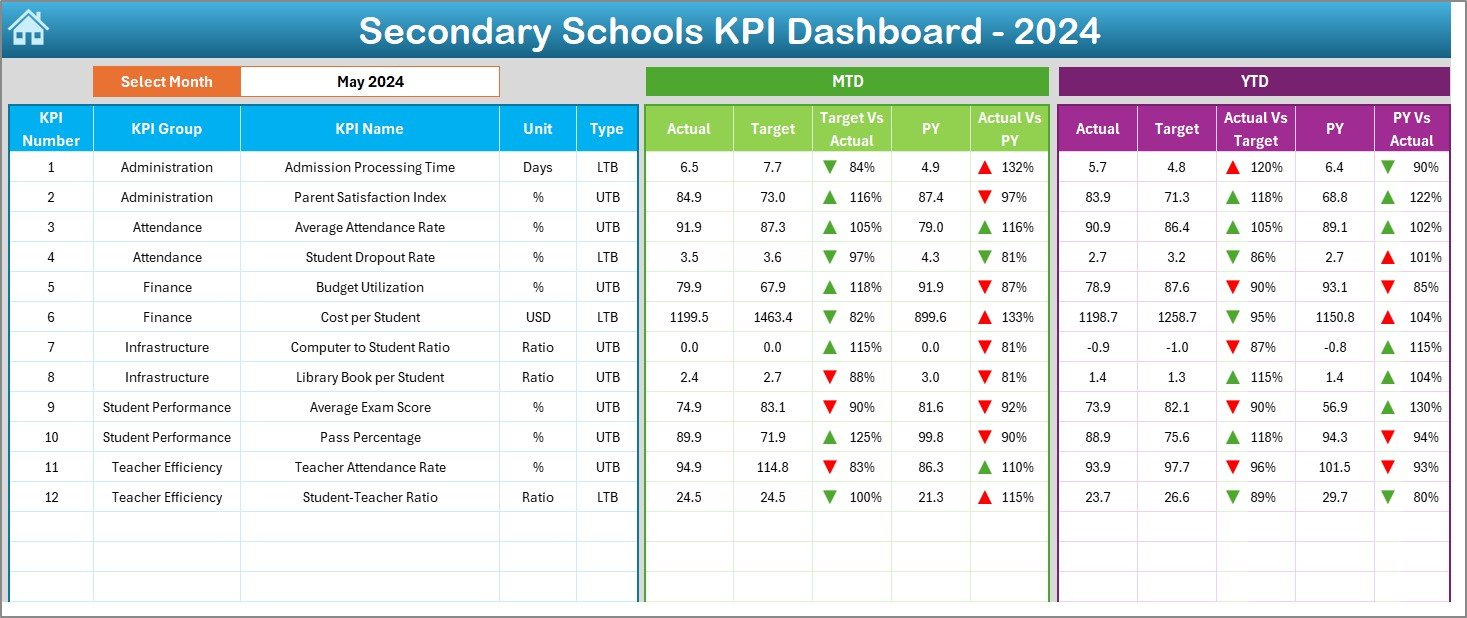
The Dashboard Sheet is the heart of this KPI system.
At the top (cell D3), you can select any month from the drop-down menu. Once selected, the entire dashboard automatically updates to show Month-to-Date (MTD) and Year-to-Date (YTD) figures.
What’s Displayed:
-
📈 MTD Actual, Target, and Previous Year (PY): Displays performance for the current month.
-
📊 YTD Actual, Target, and PY: Shows progress throughout the year.
-
🎯 Performance Comparison: Uses color-coded arrows to show whether results are above or below the target.
-
🟢 Conditional Formatting: Highlights KPIs that meet or miss goals.
This sheet gives administrators an instant visual understanding of school performance.
3️⃣ KPI Trend Sheet — Visualizing Progress Over Time
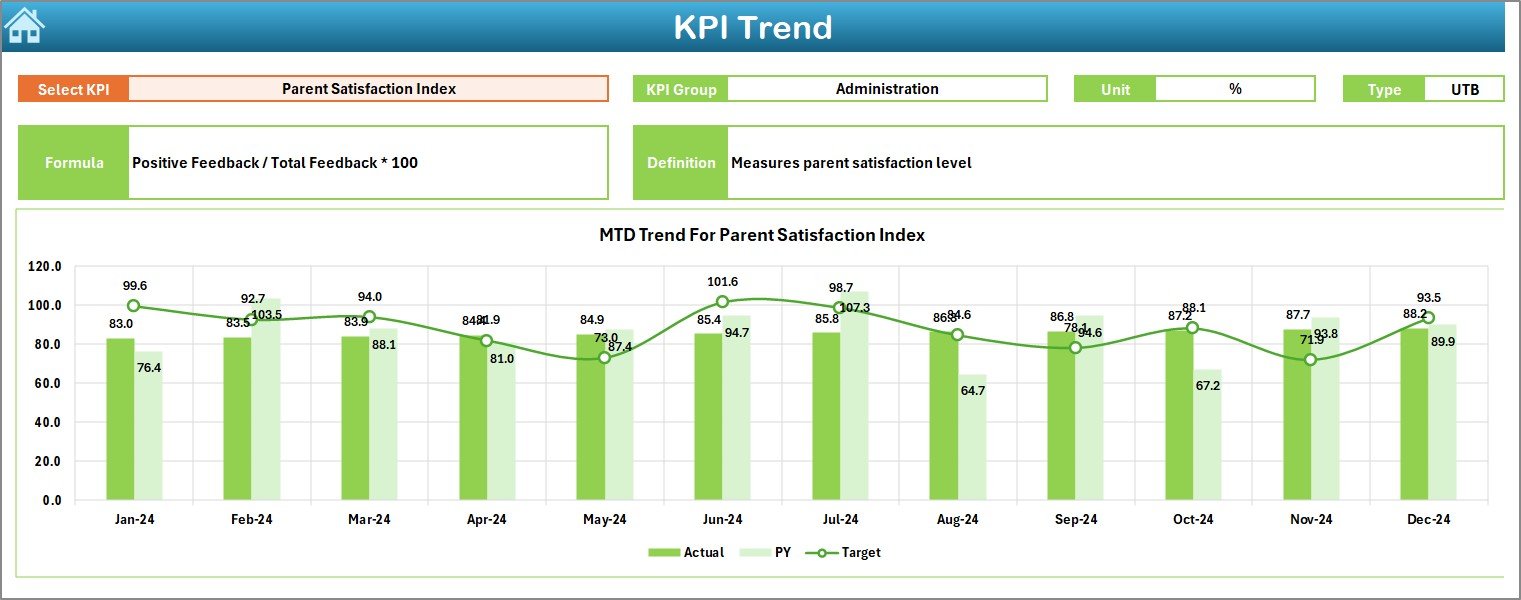
The KPI Trend Sheet helps schools analyze long-term trends for each metric.
By selecting a KPI name from the dropdown (cell C3), the sheet dynamically displays:
-
KPI Group (Academic, HR, Financial, etc.)
-
Unit of Measurement
-
Type of KPI (UTB or LTB)
-
Formula
-
KPI Definition
Below this, line charts show MTD and YTD trends for Actual, Target, and PY data.
This visual approach helps administrators quickly identify improvement or decline over months.
4️⃣ Actual Numbers Input Sheet — Feeding the Data Engine
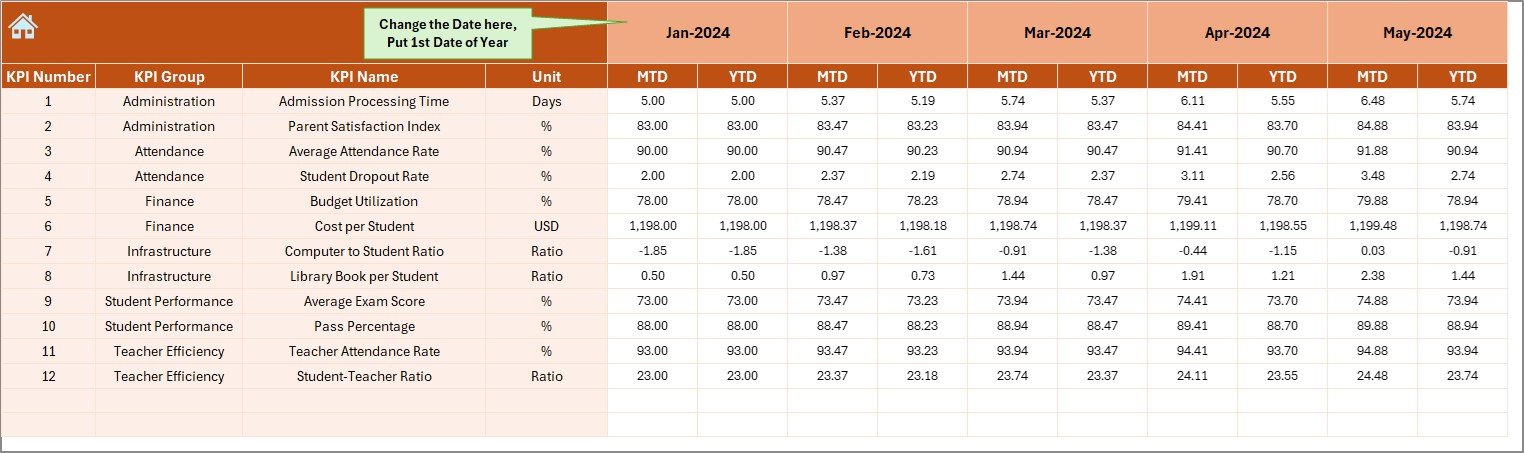
The Actual Numbers Input Sheet is where the real data entry happens.
Administrators can record actual performance figures for each KPI monthly.
At the top (cell E1), select the starting month of the academic year.
As you enter MTD and YTD data, the dashboard and charts update automatically.
This design ensures that the system stays flexible and adapts to each school’s reporting structure.
5️⃣ Target Sheet — Setting the Goals
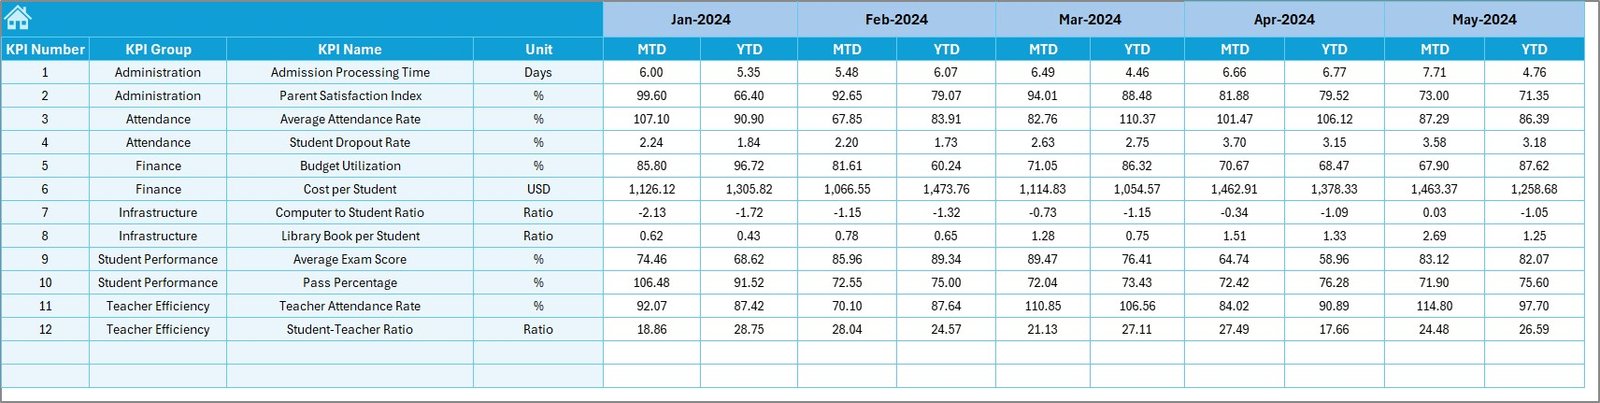
The Target Sheet is used to record planned performance targets for every KPI, both MTD and YTD.
Setting clear targets helps schools establish measurable goals for improvement — such as attendance rate, pass percentage, or staff training completion.
6️⃣ Previous Year Numbers Sheet — For Benchmark Comparison
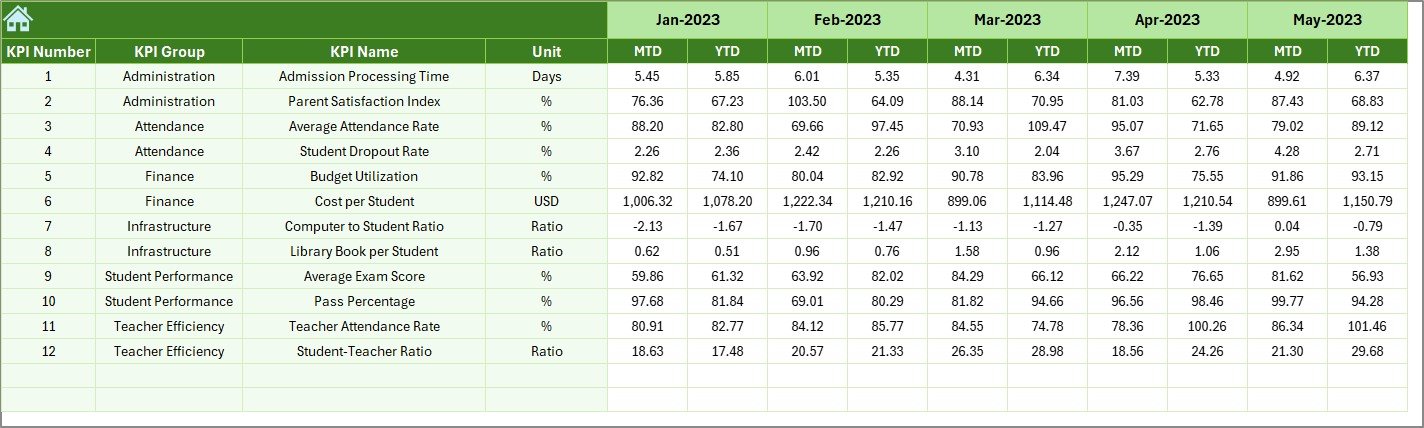
The Previous Year Numbers Sheet stores last year’s performance data in the same format as current year entries.
Comparing current data with historical performance helps identify growth, stagnation, or areas needing attention.
It’s an essential sheet for schools that aim to continuously improve academic outcomes.
7️⃣ KPI Definition Sheet — The Knowledge Base
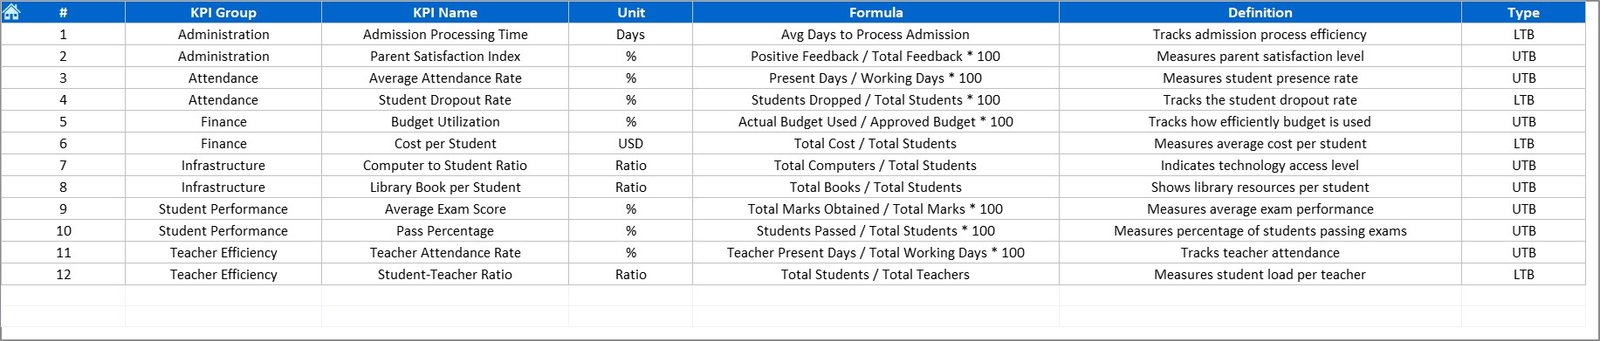
The KPI Definition Sheet explains every metric tracked in the system.
Each record includes:
-
KPI Name
-
KPI Group
-
Unit
-
Formula
-
Definition
This makes it easy for staff to understand exactly what each KPI measures and ensures standardization across departments.
🎯 Common KPIs in a Secondary Schools Dashboard
The Secondary Schools KPI Dashboard covers multiple performance areas. Below are examples of key metrics typically included.
Click to Purchases Secondary Schools KPI Dashboard in Excel
🧑🎓 Student KPIs
-
Student Attendance Rate (%)
-
Dropout Rate (%)
-
Pass Percentage (%)
-
Average Test Scores
-
Student-Teacher Ratio
-
Discipline Incidents
👩🏫 Teacher KPIs
-
Teacher Attendance (%)
-
Lesson Plan Completion Rate
-
Training Hours per Teacher
-
Student Feedback Score
-
Class Observation Score
🏫 Administrative KPIs
-
Classroom Utilization Rate (%)
-
Budget Utilization (%)
-
Maintenance Response Time
-
Resource Availability
💰 Financial KPIs
-
Fee Collection Rate (%)
-
Scholarship Allocation (%)
-
Operating Cost per Student
-
Annual Expenditure vs Budget
🌱 Community & Engagement KPIs
-
Parent Meeting Attendance (%)
-
Extracurricular Participation Rate
-
Student Satisfaction Score
These metrics can be customized based on your school’s priorities and objectives.
⚡ How the Secondary Schools KPI Dashboard Works
The dashboard works by connecting and automating calculations between its seven sheets.
Here’s the flow:
-
Enter actual data in the Input Sheet.
-
Record target values in the Target Sheet.
-
Add previous year data for comparison.
-
Excel formulas calculate MTD, YTD, and variances automatically.
-
The Dashboard and Trend sheets visualize everything using charts and icons.
This makes the system fully dynamic and interactive — no coding required!
🌟 Advantages of the Secondary Schools KPI Dashboard in Excel
Using this Excel-based dashboard brings many advantages to school administrators and educators.
1. 🎯 Centralized Performance Tracking
All KPIs across departments are displayed in one unified file, saving time and effort.
2. 📈 Data-Driven Decision Making
Instant access to visual trends helps identify what’s working and what needs improvement.
3. 🕒 Real-Time Updates
Automatic calculations update charts as soon as new data is entered.
4. 💡 Easy Customization
The Excel framework allows you to add new KPIs, change layouts, or modify color schemes easily.
5. 💵 Cost-Effective and Accessible
Since it’s built in Excel, there’s no need for expensive software or IT support.
6. 🧮 Historical Analysis
You can compare current performance with previous years for meaningful trend insights.
7. 🤝 Team Collaboration
Teachers and department heads can use shared files for collaborative performance management.
8. 🎓 Academic Excellence
Tracking measurable data helps improve student learning outcomes and institutional efficiency.
🧠 How to Use the Dashboard Effectively
Follow these steps to maximize your results with the Secondary Schools KPI Dashboard:
-
Set SMART Goals: Define clear, measurable, achievable, relevant, and time-bound objectives.
-
Input Accurate Data: Consistency in data entry ensures reliable results.
-
Monitor Monthly: Review KPIs at least once a month for timely action.
-
Use Conditional Formatting: Highlight key metrics for quick interpretation.
-
Engage Staff: Involve teachers in performance discussions for continuous improvement.
-
Benchmark Results: Compare progress year-over-year or between departments.
🧩 Opportunities for Improvement
While the Excel dashboard is highly effective, it can become even more powerful with these enhancements:
-
🔄 Integrate Power Query for automatic data imports.
-
📊 Add Power BI visuals for modern analytics.
-
📅 Include a calendar view for academic events.
-
🧮 Use macros for one-click monthly reports.
-
🧱 Introduce department-wise filters and slicers.
-
💾 Link to Google Drive for cloud collaboration.
These improvements can make performance tracking even faster and more interactive.
Click to Purchases Secondary Schools KPI Dashboard in Excel
🧭 Best Practices for the Secondary Schools KPI Dashboard in Excel
Follow these best practices to keep your dashboard efficient and reliable.
✅ 1. Focus on Relevant KPIs
Avoid tracking too many metrics. Choose only those aligned with school goals.
✅ 2. Automate Whenever Possible
Use formulas like SUMIFS, AVERAGEIFS, and IFERROR to automate calculations.
✅ 3. Use Visuals to Tell Stories
Replace numbers with charts, gauges, and color indicators for instant clarity.
✅ 4. Maintain Data Accuracy
Validate all entries before analysis to avoid misleading conclusions.
✅ 5. Protect the File
Lock critical sheets and formulas to prevent accidental changes.
✅ 6. Review Regularly
Conduct monthly or quarterly performance reviews to keep progress on track.
✅ 7. Document Everything
Keep a clear KPI Definition sheet so everyone understands the meaning of each metric.
Following these steps ensures your dashboard remains a powerful management tool throughout the academic year.
Click to Purchases Secondary Schools KPI Dashboard in Excel
🏫 Real-World Example
Let’s imagine a secondary school using this dashboard to evaluate its academic year.
-
The Input Sheet records student attendance, test scores, and teacher observations.
-
The Dashboard Sheet shows that student attendance improved from 86% to 92% this year.
-
The KPI Trend Sheet highlights continuous growth in the school’s pass rate.
-
The Previous Year Sheet confirms that both student satisfaction and parent engagement have increased.
As a result, the principal identifies areas for further improvement — such as extracurricular participation — and sets new targets for the next term.
🎓 Why Schools Should Adopt a KPI Dashboard
Implementing a KPI dashboard allows schools to move beyond guesswork and focus on measurable improvement.
It encourages data transparency, enhances accountability, and supports informed decision-making.
In the education sector, numbers tell powerful stories. They reflect student engagement, teacher impact, and institutional growth.
The Secondary Schools KPI Dashboard in Excel gives you those insights at your fingertips.
🧮 Conclusion
The Secondary Schools KPI Dashboard in Excel is more than just a spreadsheet — it’s a complete performance management system for educational institutions.
It combines simplicity with analytical power, allowing schools to measure, monitor, and improve results efficiently.
By embracing data analytics through Excel, schools can make better decisions, enhance teaching quality, and ensure students achieve their fullest potential.
Click to Purchases Secondary Schools KPI Dashboard in Excel
In short — data helps schools transform performance into progress.
❓ Frequently Asked Questions (FAQs)
1. What is a Secondary Schools KPI Dashboard used for?
It’s used to track academic, operational, and financial performance indicators in one centralized Excel file.
2. Is this dashboard suitable for all schools?
Yes, it works for government, private, and international secondary schools alike.
3. How do I update the dashboard?
Simply enter monthly data in the Input Sheet — all visuals and calculations update automatically.
4. Can I add my own KPIs?
Yes, you can easily modify or add KPIs in the Definition Sheet and link them to your data.
5. Do I need coding knowledge?
Not at all. The dashboard uses Excel formulas, so no VBA or coding is required.
6. Can multiple people use it at the same time?
Yes, when stored on cloud platforms like OneDrive or Google Drive, it supports collaboration.
7. Is it possible to compare with last year’s results?
Yes, the dashboard includes a dedicated Previous Year sheet for year-over-year comparison.
8. How many KPIs can I track?
You can track as many as you want, though 10–20 KPIs per department is ideal.
9. Is the dashboard compatible with Excel 2016 or later?
Yes, it works seamlessly on Excel 2016 and newer versions, both Windows and Mac.
10. How does this help improve student outcomes?
By analyzing attendance, performance, and satisfaction data, schools can identify problem areas and implement targeted strategies.
Click to Purchases Secondary Schools KPI Dashboard in Excel
Visit our YouTube channel to learn step-by-step video tutorials
Watch the step-by-step video tutorial: