In today’s competitive education sector, test preparation centres must track performance accurately to ensure students achieve their best results. From enrollment trends and faculty productivity to student satisfaction and revenue, every aspect affects success.
That’s why the Test Preparation Centres KPI Dashboard in Excel is an essential tool. This ready-to-use Excel dashboard allows education managers and coaching institutes to monitor performance metrics easily. It transforms data into visual insights — helping institutions make informed decisions, boost efficiency, and achieve academic excellence.
Click to Purchases Test Preparation Centres KPI Dashboard in Excel
What Is a Test Preparation Centres KPI Dashboard in Excel?
A Test Preparation Centres KPI Dashboard is an Excel-based system designed to monitor and analyze the performance of coaching and test prep centres. It tracks metrics such as student enrollment, course completion, teacher performance, marketing ROI, and profitability.
Built in Excel, it offers flexibility, automation, and powerful visualization without requiring complex software. It allows you to compare actual results with targets and previous year performance — all from a single interactive platform.
This dashboard empowers administrators, academic heads, and business owners to make data-driven decisions and improve both academic and operational efficiency.
Click to Purchases Test Preparation Centres KPI Dashboard in Excel
Why Test Preparation Centres Need a KPI Dashboard
Running a test prep centre means managing many moving parts: faculty, marketing, course materials, students, and finances. Without a structured performance tracking tool, it’s easy to lose visibility.
A KPI dashboard helps you:
-
Evaluate academic outcomes and operational performance.
-
Measure growth, profitability, and resource utilization.
-
Identify underperforming areas early.
-
Make quick, evidence-based improvements.
-
Enhance accountability across teams.
The Test Preparation Centres KPI Dashboard in Excel gives you a single source of truth — bringing clarity, consistency, and confidence to your management decisions.
Key Features of the Test Preparation Centres KPI Dashboard in Excel
This dashboard consists of seven well-organized worksheets, each designed for a specific purpose to make performance tracking seamless and efficient.
1️⃣ Home Sheet
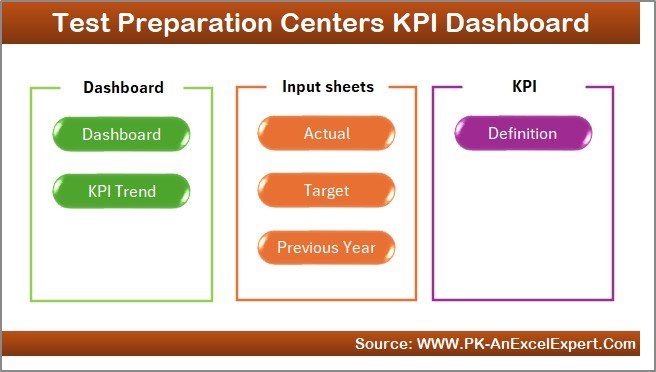
The Home sheet serves as the central navigation panel. It includes six clickable buttons that allow users to move instantly between key sections — Dashboard, KPI Trend, Input, Target, Previous Year, and KPI Definition sheets.
This simple navigation system enhances usability and makes the dashboard easy to operate even for non-technical users.
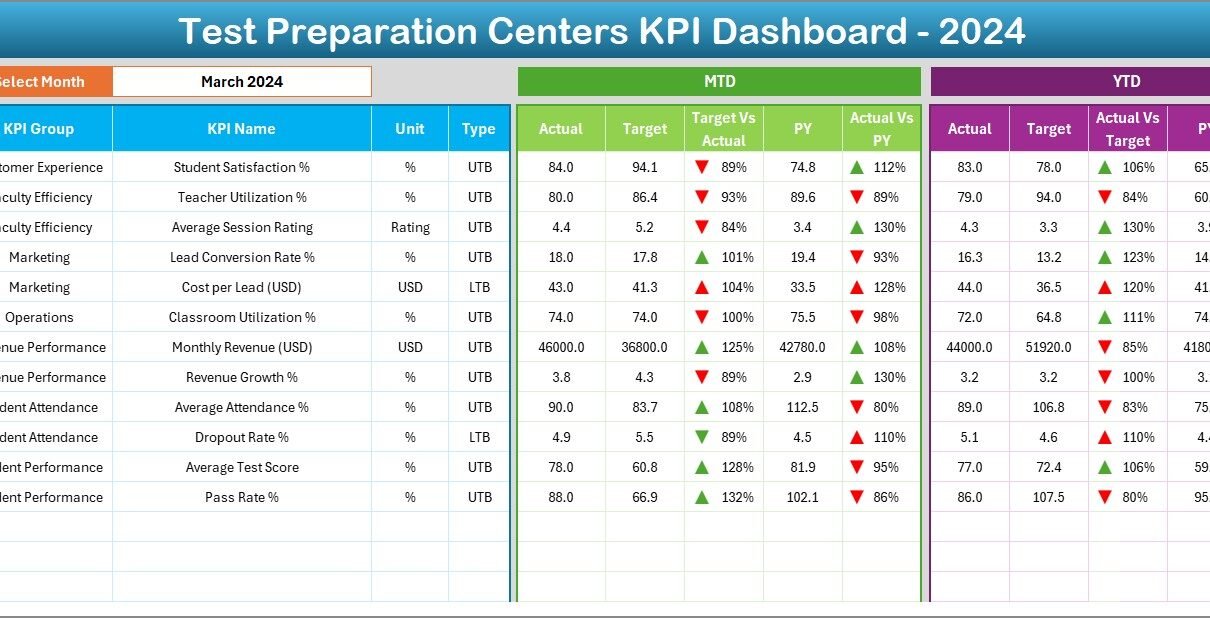
2️⃣ Dashboard Sheet
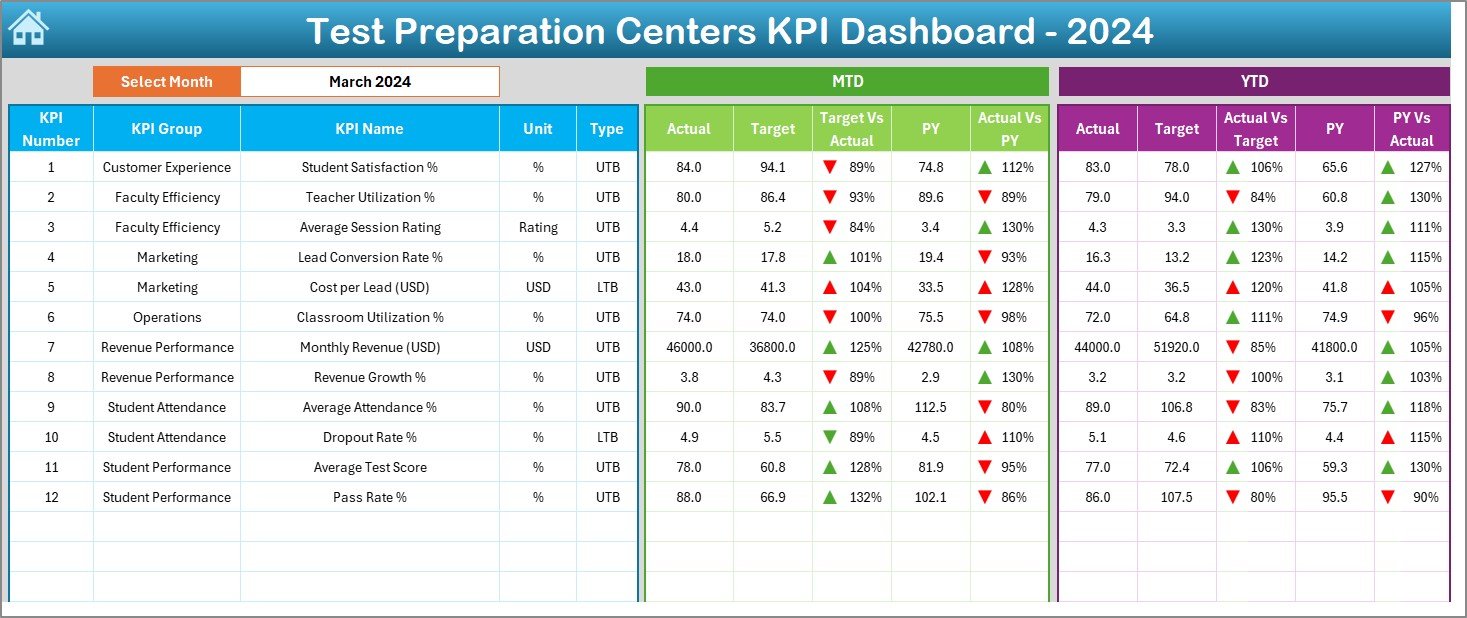
The Dashboard sheet is the main page where all KPIs come to life visually.
Key highlights include:
-
Month Selection (cell D3): Choose any month, and all metrics update automatically.
-
MTD and YTD Views: Compare Actual, Target, and Previous Year data side by side.
-
Conditional Formatting: Up and down arrows indicate improvement or decline instantly.
-
Visual Analysis: Quickly evaluate centre performance through clean, color-coded visuals.
This page is perfect for management reviews, enabling decision-makers to understand performance at a glance.
3️⃣ KPI Trend Sheet
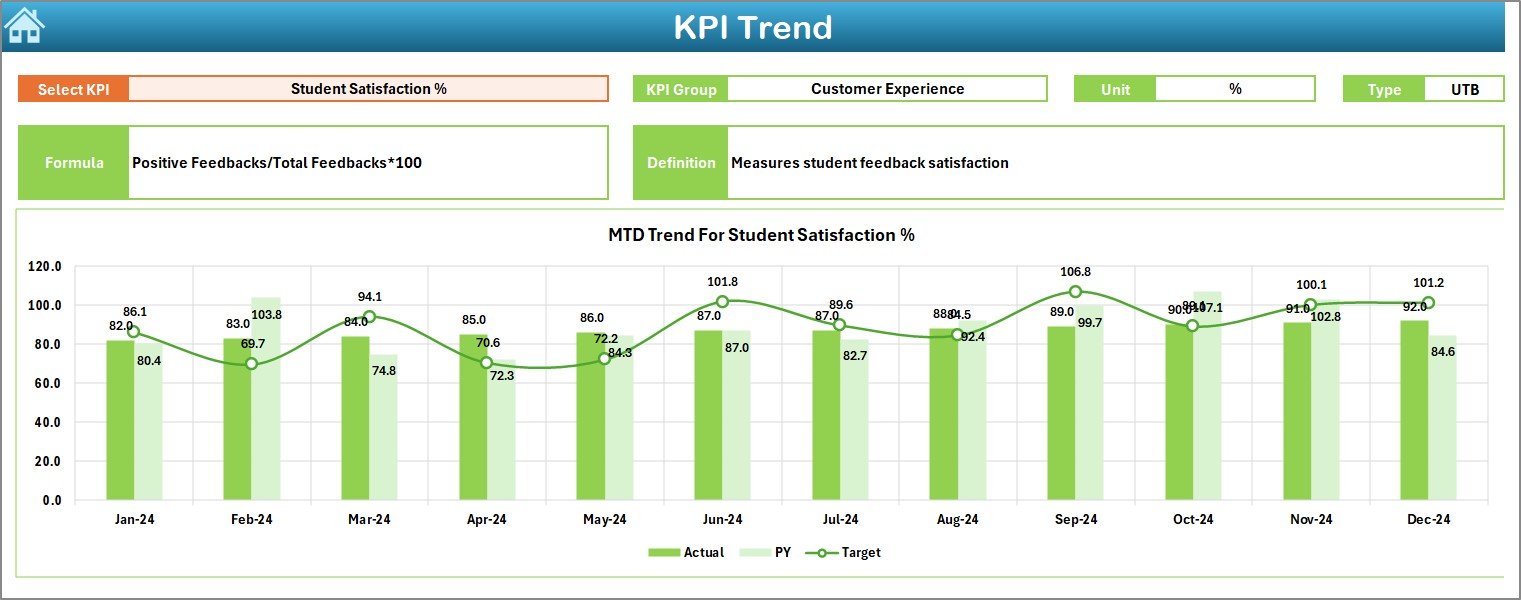
The KPI Trend sheet provides deeper insights into individual metrics.
Features:
-
Dropdown Selection (cell C3): Select any KPI to view its details.
-
Displayed Information: KPI Group, Unit, Type (UTB or LTB), Formula, and Definition.
-
Dynamic Charts: See MTD and YTD trends for Actual, Target, and Previous Year values.
This helps identify trends in student outcomes, resource efficiency, or financial growth over time.
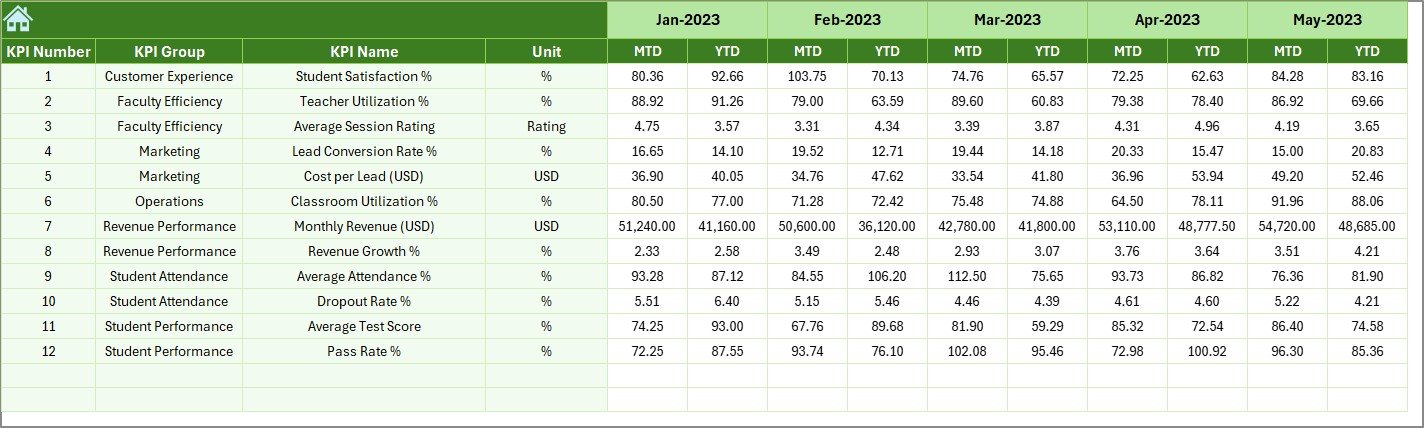
4️⃣ Actual Numbers Input Sheet
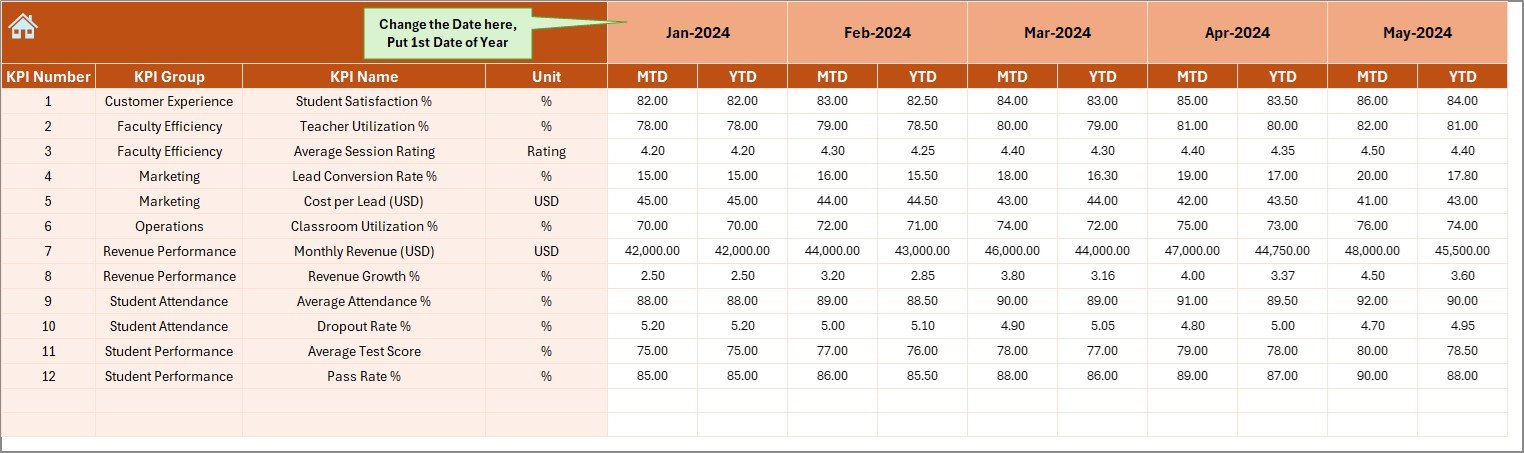
This is where you record real data for your centre.
Functions include:
-
Enter YTD and MTD values for each KPI.
-
Adjust starting month (cell E1) to set the fiscal or academic year.
-
Automatically refreshes all charts and metrics based on updated values.
By entering accurate monthly data, you ensure your dashboard stays current and insightful.
5️⃣ Target Sheet
The Target sheet allows you to define clear monthly and yearly goals for each KPI.
Set performance benchmarks for:
-
Enrollment numbers.
-
Average student score.
-
Course completion rate.
-
Marketing ROI.
-
Teacher performance index.
Targets act as your reference point for success, allowing you to assess if your institution is meeting expectations.
6️⃣ Previous Year Numbers Sheet
This sheet helps compare performance across years. Enter the previous year’s data in the same format as current year metrics.
The dashboard automatically calculates PY vs Actual variance to highlight improvement areas and long-term progress.
7️⃣ KPI Definition Sheet
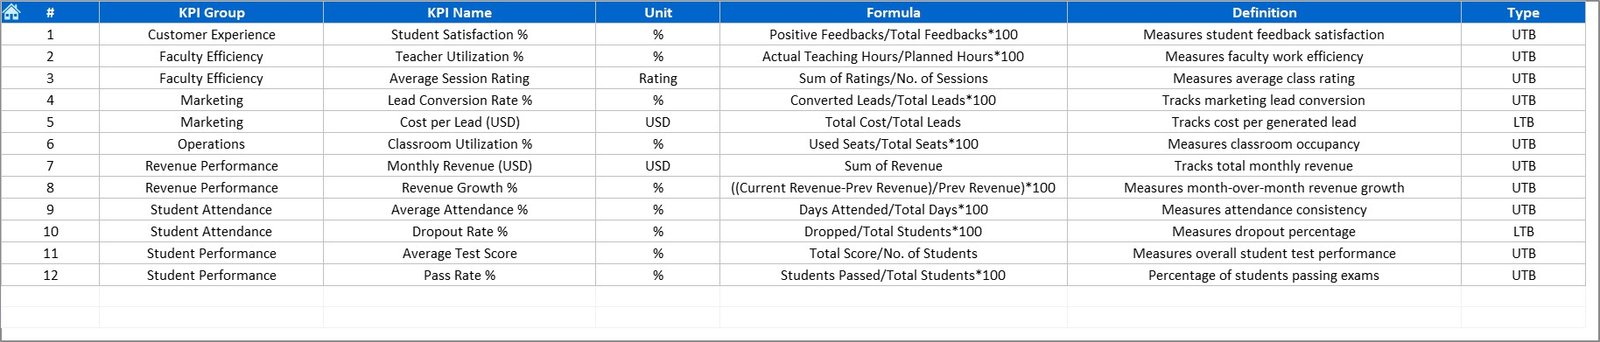
To maintain clarity and consistency, this sheet defines all KPIs tracked across the dashboard.
Include details like:
-
KPI Name
-
KPI Group (Academics, Operations, Marketing, Finance, etc.)
-
Unit of Measurement
-
Formula for calculation
-
Definition for clear understanding
This ensures all users interpret KPIs uniformly across departments.
Click to Purchases Test Preparation Centres KPI Dashboard in Excel
Example KPIs for Test Preparation Centres
Every coaching or test prep institution can customize KPIs based on its goals. Here are some examples:
🎓 Academic KPIs
-
Average Student Score (%)
-
Course Completion Rate (%)
-
Pass Percentage (%)
-
Faculty Effectiveness Rating
📈 Operational KPIs
-
Batch Utilization Rate (%)
-
Student-Teacher Ratio
-
Average Class Attendance (%)
-
On-Time Session Delivery (%)
💰 Financial KPIs
-
Revenue per Student
-
Cost per Batch
-
Net Profit Margin (%)
-
Budget Variance (%)
📢 Marketing & Admissions KPIs
-
Conversion Rate (Leads to Enrollments)
-
Social Media Engagement (%)
-
Campaign ROI (%)
-
New Student Enrollments
😊 Customer (Student) Experience KPIs
-
Student Satisfaction Score (1–10)
-
Feedback Response Rate (%)
-
Referral Enrollment Rate (%)
Together, these KPIs provide a holistic view of both academic and business performance.
How to Use the Test Preparation Centres KPI Dashboard in Excel
Follow these simple steps:
-
Set up your KPIs in the KPI Definition sheet.
-
Enter monthly data in the Actual Numbers Input sheet.
-
Set targets in the Target sheet for each KPI.
-
Record last year’s data in the Previous Year sheet for comparison.
-
Review performance on the Dashboard and KPI Trend sheets.
-
Adjust strategies based on insights from data visualization.
This workflow ensures you track, analyze, and improve your test centre performance continuously.
Advantages of Using a Test Preparation Centres KPI Dashboard in Excel
Implementing this Excel dashboard brings several measurable benefits:
✅ 1. Centralized Performance Management
Monitor academic, financial, and operational KPIs in one consolidated place.
✅ 2. Real-Time Decision-Making
Visual dashboards provide instant insights for faster and smarter decisions.
✅ 3. Enhanced Accountability
Departments can easily measure their results against targets.
✅ 4. Cost-Effective Solution
No need for complex software — Excel provides automation and analytics in a single platform.
✅ 5. Easy Customization
Add new KPIs or modify formulas anytime without coding knowledge.
✅ 6. Time-Saving Automation
Conditional formatting and pre-built formulas handle all calculations automatically.
Click to Purchases Test Preparation Centres KPI Dashboard in Excel
Best Practices for the Test Preparation Centres KPI Dashboard
To get maximum value from your dashboard, follow these best practices:
-
🎯 Align KPIs with Business Goals: Track what truly drives results.
-
📊 Review Data Monthly: Regular updates keep insights fresh.
-
🧩 Use Consistent Metrics: Define KPIs clearly to avoid confusion.
-
🔄 Compare Year-Over-Year Trends: Track growth over time, not just in isolation.
-
🎨 Leverage Visuals: Use charts, arrows, and color codes for easy interpretation.
-
👥 Involve Teams: Include faculty, marketing, and management in KPI reviews.
Following these principles will turn your dashboard into a performance powerhouse.
How Excel Simplifies KPI Tracking for Test Prep Centres
Excel is one of the most practical tools for managing educational performance data.
It offers:
-
Dynamic Dashboards: Easily refresh visuals as new data is entered.
-
Compatibility: Import data from Google Forms, CRMs, or ERP systems.
-
Automation: Reduce manual effort with formulas and data validation.
-
Security: Password-protect sensitive KPI information.
-
Scalability: Works for single-branch and multi-branch institutes alike.
This makes Excel the perfect platform for institutions aiming for efficiency and transparency.
Common Mistakes to Avoid
Avoid these pitfalls for accurate and meaningful analysis:
❌ Tracking too many KPIs without focus.
❌ Not updating data regularly.
❌ Ignoring visual indicators and trends.
❌ Using inconsistent formulas or units.
❌ Overcomplicating the dashboard with excess visuals.
Keeping your setup clean and consistent ensures better insights and usability.
Conclusion
The Test Preparation Centres KPI Dashboard in Excel is a smart, data-driven solution that empowers educational institutions to monitor their academic, operational, and financial performance effectively.
With seven structured sheets — Home, Dashboard, KPI Trend, Actual Numbers, Target, Previous Year, and KPI Definition — it offers a 360-degree view of centre performance.
Whether you manage a single coaching centre or a multi-branch test prep brand, this dashboard ensures you stay focused on measurable success. Use data to inspire improvement, drive results, and help students reach their goals — efficiently and confidently.
Click to Purchases Test Preparation Centres KPI Dashboard in Excel
Frequently Asked Questions (FAQs)
1. What is a Test Preparation Centres KPI Dashboard?
It’s an Excel-based tool used to track, analyze, and visualize KPIs related to academic and operational performance.
2. What kind of data does it track?
It tracks academic results, student engagement, financials, marketing, and resource efficiency metrics.
3. Can it be customized for my institute?
Yes, you can easily modify KPIs, visuals, and targets based on your unique goals.
4. How often should I update the data?
Monthly updates are recommended for the most accurate MTD and YTD insights.
5. Is Excel suitable for KPI dashboards?
Yes, Excel offers built-in tools for analytics, visualization, and automation without extra software costs.
6. Can this dashboard track multiple branches?
Yes, simply expand your data tables or create copies of the file for each branch.
Click to Purchases Test Preparation Centres KPI Dashboard in Excel
Visit our YouTube channel to learn step-by-step video tutorials