In today’s fast-paced automotive industry, data is the key to smarter decisions, cost efficiency, and improved performance. Whether you manage a vehicle fleet, a transport department, or an automotive service company, you need a simple yet powerful way to track performance metrics. That’s where the Automotive Report in Excel comes into play.
This ready-to-use Excel-based report helps you consolidate, analyze, and visualize vehicle-related data — all in one interactive dashboard. In this article, you’ll learn everything about this report: its structure, features, benefits, how to use it effectively, and best practices for getting the most from it.
🚘 What Is an Automotive Report in Excel?
Click to Purchases Automotive Report in Excel
An Automotive Report in Excel is a structured and data-driven reporting system that helps you monitor vehicle activity, costs, and performance metrics efficiently. It uses Excel’s advanced formulas, charts, and slicers to create an automated reporting environment — no need for expensive software or coding.
This tool is perfect for organizations that want to analyze data such as:
-
Vehicle utilization and active percentage
-
Fuel and maintenance costs
-
Trip performance and mileage tracking
-
Regional and departmental efficiency
By combining data visualization and tabular summaries, this Excel-based report gives you a clear overview of how well your automotive operations are performing.
Structure of the Automotive Report in Excel
The Automotive Report in Excel is built on a clean, intuitive layout divided into multiple sheets. Each sheet serves a specific purpose and makes the report easy to navigate.
Click to Purchases Automotive Report in Excel
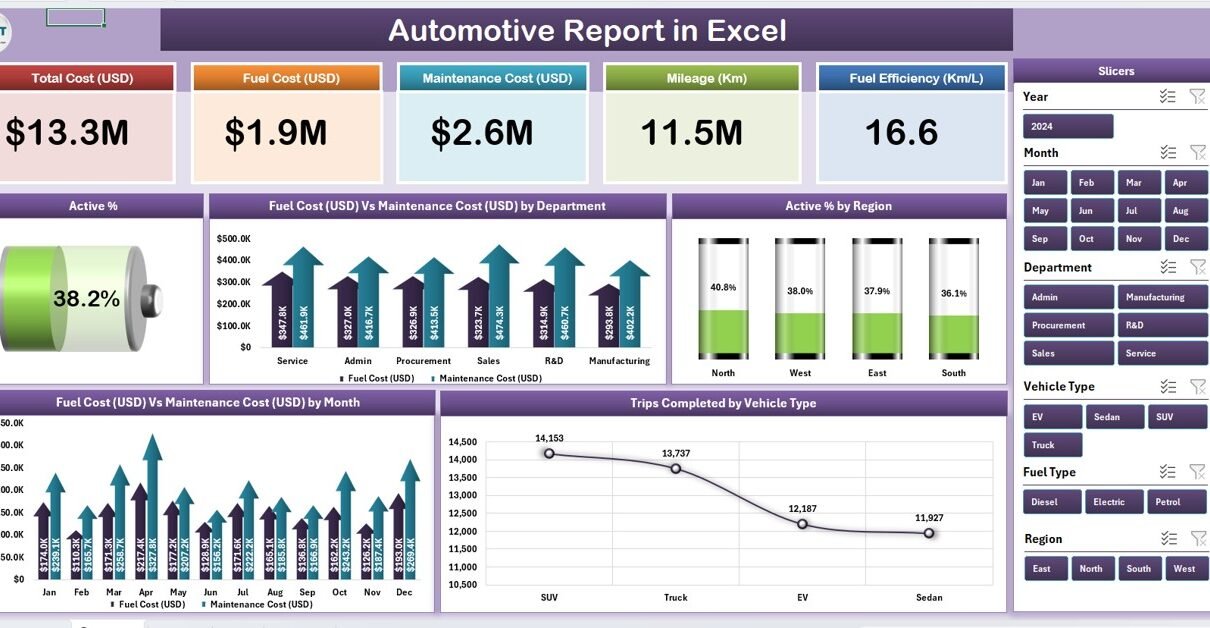
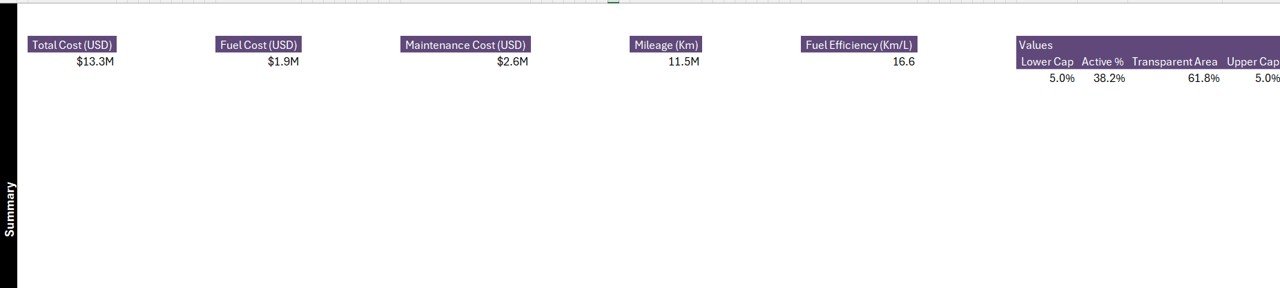
1. Summary Page
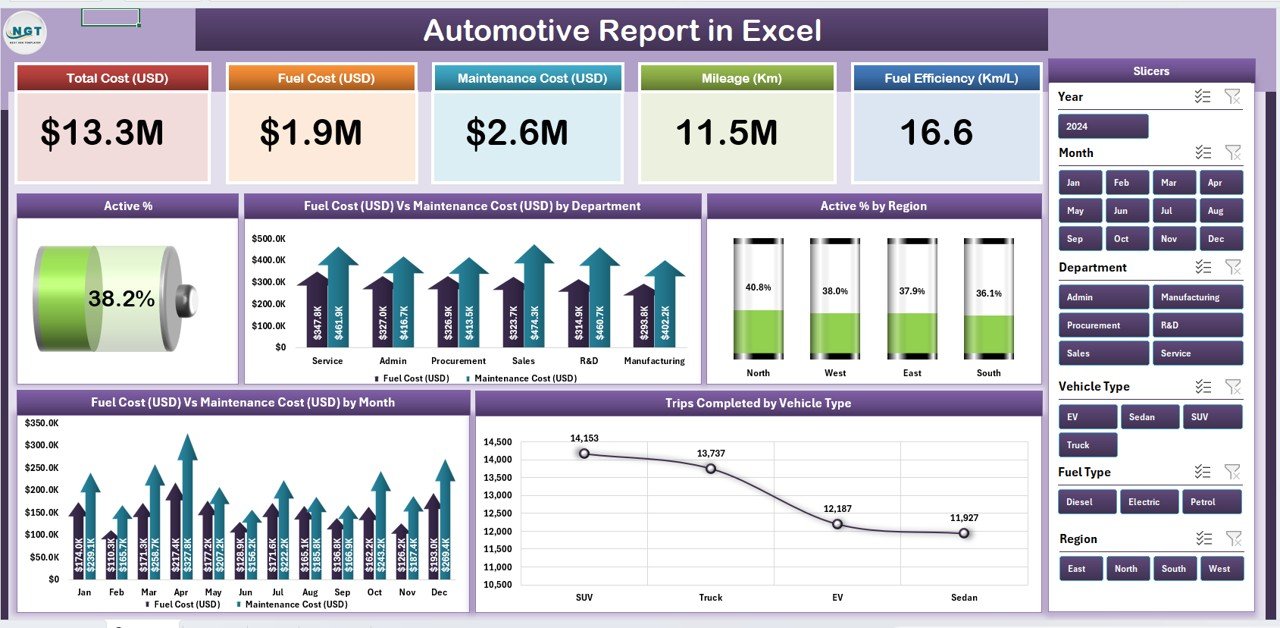
The Summary Page is the main dashboard of the report.
Here, users can instantly view the most important automotive KPIs through visuals and summary cards.
Key Highlights:
-
Top 5 KPI Cards: These cards display critical figures like total vehicles, total trips, fuel cost, maintenance cost, and active percentage.
-
Right-Side Slicer: The slicer allows quick filtering by month, region, or department.
Charts:
- Active % by Region
- Fuel Cost (USD) vs Maintenance Cost (USD) by Department
- Trips Completed by Vehicle Type
- Fuel Cost (USD) vs Maintenance Cost (USD) by Month
- Active % Trends Over Time
This page acts as a one-stop view for management — giving instant insights without manual calculations.
2. Report Page
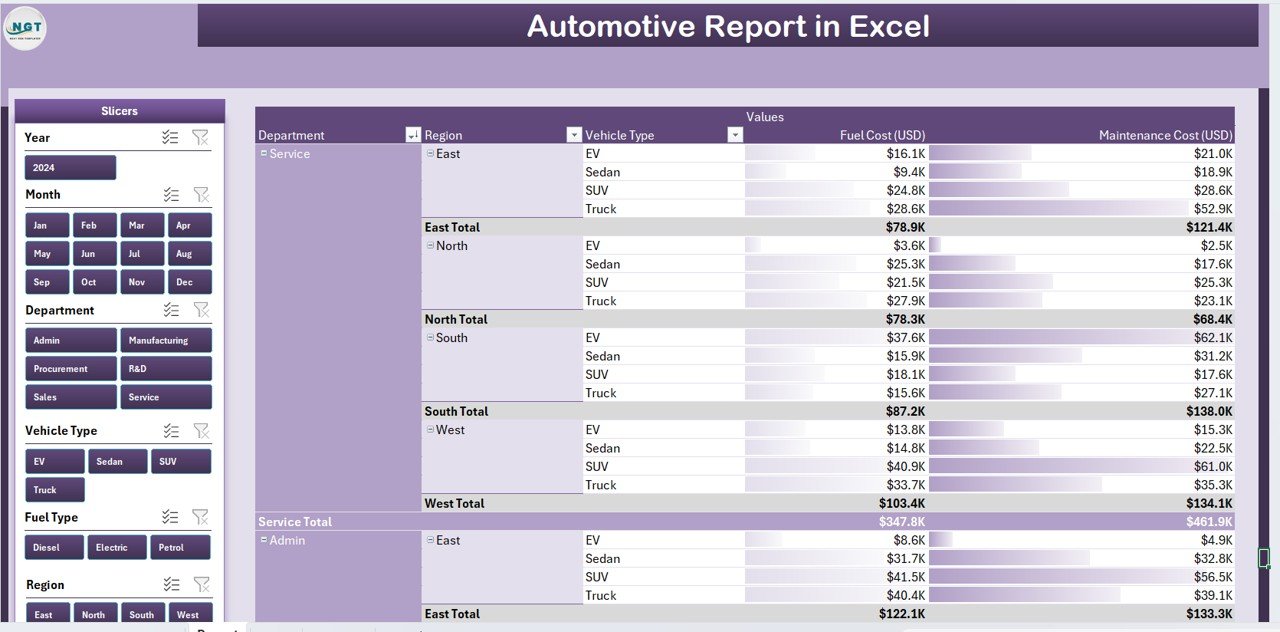
The Report Page provides a detailed tabular view of all vehicle performance data.
It’s perfect for department heads and analysts who need granular insights.
Features of the Report Page:
-
Left-Side Slicer: Filter data by vehicle type, region, or month.
-
Information Table: Displays records such as Vehicle ID, Department, Region, Fuel Cost, Maintenance Cost, Active Days, and Trips Completed.
-
Sorting and Filtering: Helps users identify top-performing vehicles or those requiring maintenance attention.
With this page, users can deep-dive into operational metrics and identify opportunities for optimization.
3. Data Sheet
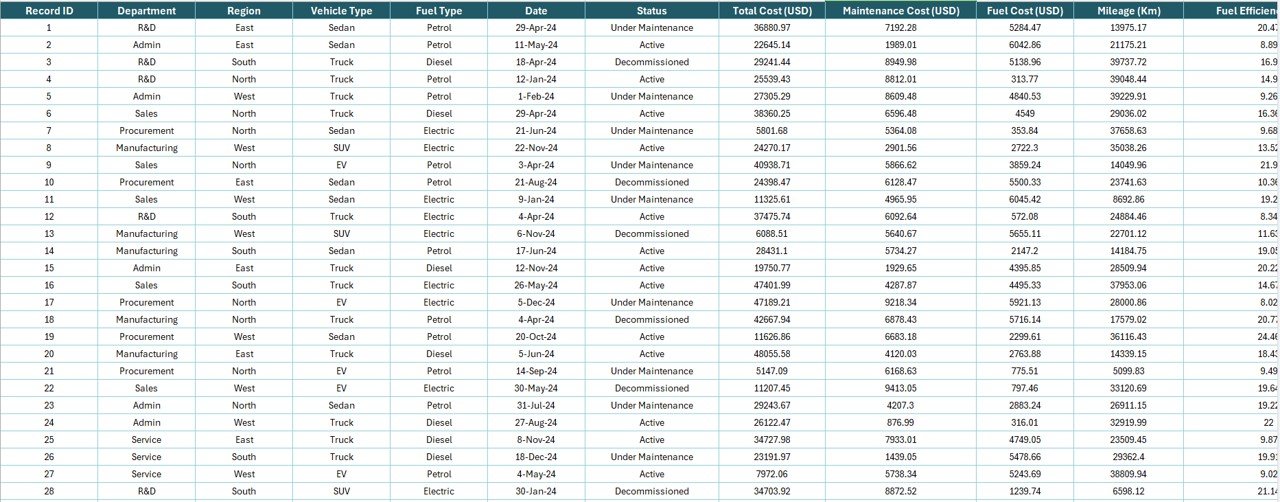
The Data Sheet is the foundation of the entire report.
This is where all raw data gets recorded — including vehicle details, costs, and usage statistics.
Data Fields Typically Include:
-
Vehicle ID and Type
-
Department and Region
-
Month and Year
-
Fuel Cost (USD)
-
Maintenance Cost (USD)
-
Trips Completed
-
Active %
This sheet powers all calculations, charts, and visuals automatically. By simply updating this sheet every month, the report stays current and accurate.
4. Support Sheet
The Support Sheet holds lists and references used in dropdown menus and slicers.
It ensures standardization across data entries, minimizing human errors.
For example, dropdown lists for Departments, Regions, or Vehicle Types come from this sheet. This structure enhances consistency and reduces duplication.
⚙️ How the Automotive Report in Excel Works
The Automotive Report in Excel works through smart use of formulas, named ranges, pivot tables, and Excel slicers. Here’s how the workflow goes:
-
Data Input:
Enter all your raw data in the Data Sheet. This includes monthly figures for fuel, maintenance, trips, and other key metrics. -
Automatic Calculations:
Excel formulas calculate totals, averages, and percentages automatically. This eliminates manual effort and saves time. -
Dashboard Visualization:
Pivot tables and charts pull insights directly from the data sheet. The visuals refresh automatically when you update the data. -
Filtering and Analysis:
Use the slicers on the Summary and Report pages to analyze data by region, department, or vehicle type instantly.
This process turns basic Excel sheets into a dynamic, interactive reporting tool that delivers real-time business insights.
🌟 Key Benefits of Using the Automotive Report in Excel
Click to Purchases Automotive Report in Excel
Using this report template offers numerous benefits for automotive professionals and businesses. Let’s explore the major ones:
1. Centralized Data Management
Instead of maintaining multiple spreadsheets, you can manage all automotive data in a single structured file. This saves time and avoids confusion.
2. Improved Decision-Making
The visual charts and KPI summaries allow managers to spot cost patterns, performance trends, and problem areas quickly — leading to informed decisions.
3. Cost Optimization
By analyzing fuel and maintenance expenses, you can identify high-cost vehicles or departments and take corrective actions to improve cost-efficiency.
4. Enhanced Fleet Performance
Tracking active percentage and trips per vehicle helps you measure utilization and identify underperforming assets.
5. Easy to Customize
The report is built in Excel, making it easy to modify layouts, formulas, and visuals according to your business needs — without requiring technical expertise.
💡 Why Use Excel for Automotive Reporting?
Many companies still rely on Excel because it offers flexibility, accessibility, and affordability.
Here’s why Excel remains a popular choice:
-
It doesn’t require expensive licenses or software installations.
-
You can update and customize it easily.
-
It supports formulas, pivot tables, and charts that automate calculations.
-
It works offline and integrates easily with other systems.
This makes Excel the perfect tool for small and medium automotive businesses that want detailed reports without complex software.
📊 KPIs You Can Track with Automotive Report in Excel
The strength of this report lies in its ability to track measurable performance indicators. Some of the key KPIs include:
-
Active Percentage (%) – Measures how many vehicles are in operation versus total available.
-
Fuel Cost (USD) – Tracks total and average fuel expenses.
-
Maintenance Cost (USD) – Monitors preventive and corrective maintenance costs.
-
Trips Completed – Shows vehicle utilization and delivery performance.
-
Average Cost per Trip – Helps in budgeting and pricing analysis.
-
Departmental Cost Breakdown – Compares operating efficiency across departments.
-
Regional Active Rate – Reveals how geographic areas impact performance.
These KPIs give a full picture of operational health and cost-effectiveness.
🚦 How to Use the Automotive Report in Excel Effectively
To get the most out of this report, follow these simple steps:
-
Start with Clean Data:
Ensure all vehicle records are consistent. Use standardized naming for departments and months. -
Update Regularly:
Enter new data each month into the Data Sheet to keep dashboards updated. -
Use Filters Wisely:
Use slicers to explore specific regions or vehicle types rather than analyzing the entire dataset at once. -
Monitor Trends Monthly:
Compare monthly performance using the built-in trend charts to identify improvements or drops in efficiency. -
Set Targets:
Define performance benchmarks, such as desired Active %, and compare actual results against them.
By following these steps, you can maintain a clear view of your automotive operations all year round.
✅ Advantages of the Automotive Report in Excel
Here are the top advantages of using this Excel-based solution:
-
💰 Cost-Effective: No need for expensive software licenses.
-
📈 Data-Driven Decisions: Real-time visuals highlight trends.
-
🧾 Comprehensive Reporting: Covers cost, performance, and utilization.
-
🧩 Customizable Structure: Easy to adapt for any organization.
-
⚡ Time-Saving: Automatic updates through Excel formulas and pivots.
-
🌍 User-Friendly Interface: Anyone with basic Excel knowledge can use it.
These advantages make it a practical and scalable solution for automotive professionals.
🧭 Opportunities for Improvement
Even though this template is powerful, continuous improvement always helps maximize its potential. Here are a few enhancement ideas:
-
Add Fuel Efficiency Metrics: Track kilometers per liter or fuel cost per trip.
-
Integrate GPS Data: Use telematics data to improve reporting accuracy.
-
Include Predictive Analysis: Add forecast charts for future cost projections.
-
Add Alerts for High Costs: Use conditional formatting to highlight vehicles with unusually high expenses.
-
Automate Data Entry: Connect with external data sources like CSV or ERP exports.
These upgrades can make the report even more advanced and insightful.
💼 Who Can Use the Automotive Report in Excel?
This Excel report is ideal for:
-
Fleet Managers: To monitor daily vehicle performance.
-
Finance Teams: To evaluate cost structures.
-
Operations Heads: To ensure efficiency across departments.
-
Logistics Coordinators: To plan and schedule trips efficiently.
-
Automotive Workshops: To maintain service and maintenance records.
Whether you run a logistics company, rental service, or corporate vehicle fleet, this report adapts to your needs effortlessly.
🧠 Best Practices for the Automotive Report in Excel
To ensure accuracy, consistency, and efficiency, follow these best practices:
-
✅ Use Data Validation: Restrict invalid entries in the data sheet.
-
✅ Back Up Your Data Regularly: Prevent loss by maintaining monthly backups.
-
✅ Keep Visuals Simple: Focus on clarity rather than too many colors or charts.
-
✅ Use Pivot Tables for Dynamic Analysis: They make slicing and dicing data easy.
-
✅ Protect Formulas: Lock formula cells to avoid accidental edits.
-
✅ Optimize File Size: Periodically remove outdated data or compress the file.
Following these practices ensures smooth performance and reliable insights.
📚 Case Example – How a Fleet Company Uses the Report
Imagine a logistics firm managing 100 vehicles across 5 regions. Each region maintains monthly data on trips, fuel usage, and maintenance. Using this Automotive Report in Excel, the company can:
-
Identify which region has the lowest fuel efficiency.
-
Compare maintenance cost trends month over month.
-
Detect inactive vehicles and redeploy them.
-
Visualize total cost vs performance across departments.
As a result, the company reduced operating costs by 15% and improved fleet utilization by 22% within three months.
🔍 Tips to Customize the Report for Your Needs
If you want to personalize this report:
-
Replace KPI names or add new columns in the Data Sheet.
-
Modify chart types (e.g., bar chart to line chart) for better readability.
-
Add new slicers (for example, by vehicle model or driver name).
-
Insert conditional formatting for alerts (e.g., fuel cost above $5,000).
-
Adjust card colors and chart themes to match your company branding.
Excel’s flexibility makes it easy to adapt without coding or third-party tools.
🧾 Conclusion
The Automotive Report in Excel is more than just a reporting tool — it’s a complete performance management system for the automotive industry. It simplifies how you track vehicle usage, analyze costs, and visualize trends. Whether you manage 10 vehicles or 1,000, this tool helps you make smarter decisions, control expenses, and improve operational efficiency.
By using this ready-to-use Excel template, you can bring structure, clarity, and insight into your automotive reporting process. With just a few clicks, you’ll turn raw data into powerful business intelligence — all within Excel.
❓ Frequently Asked Questions (FAQs)
1. What is the purpose of an Automotive Report in Excel?
It helps users monitor vehicle performance, costs, and operational efficiency using visual charts and summary KPIs in Excel.
2. Can I customize the report for my business?
Yes, the report is fully customizable. You can modify formulas, visuals, and slicers to suit your specific business structure.
3. How often should I update the data sheet?
You should update it monthly to ensure the dashboards display the latest performance metrics.
4. Do I need Excel expertise to use this report?
No, the report is user-friendly. Anyone familiar with basic Excel functions can use and update it easily.
5. Can this report handle large datasets?
Yes, it can manage hundreds or even thousands of records, though using filters and periodic backups keeps performance smooth.
6. Is there a version for Google Sheets?
Yes, similar versions can be created in Google Sheets with real-time collaboration and similar analytics.-
Visit our YouTube channel to learn step-by-step video tutorials