In the modern energy industry, data-driven decision-making is no longer optional — it’s essential. Power generation companies must track multiple performance indicators across plants, equipment, safety standards, and efficiency levels to ensure smooth operations and profitability.
The Power Generation KPI Dashboard in Power BI simplifies this complex task. Built entirely in Microsoft Power BI, this ready-to-use dashboard turns raw operational data into powerful visual insights. It helps managers, engineers, and executives monitor key performance indicators (KPIs), identify trends, and improve energy production efficiency.
In this comprehensive article, we’ll explore the structure, features, and benefits of the Power Generation KPI Dashboard in Power BI, along with best practices and frequently asked questions to help you use it effectively.
Click to Purchases Power Generation KPI Dashboard in Power BI
What Is a Power Generation KPI Dashboard in Power BI?
A Power Generation KPI Dashboard is a data visualization tool designed to measure and track the efficiency, reliability, and performance of power generation plants.
By integrating operational data — such as energy output, equipment utilization, downtime, and safety metrics — this dashboard gives stakeholders a complete overview of plant performance in real time.
Built in Microsoft Power BI, it uses data from Excel files as its data source, enabling easy updates and automation. With interactive visuals, slicers, and trend charts, users can monitor every KPI without manually creating reports.
Why Power Generation Companies Need KPI Dashboards
Power generation is a capital-intensive industry where efficiency directly affects profitability. Without a structured reporting system, teams often waste time consolidating data from multiple sources.
A Power Generation KPI Dashboard in Power BI solves that problem by:
-
Combining multiple data sources into one centralized report
-
Providing visual insights that reveal trends instantly
-
Reducing reporting time through automation
-
Improving collaboration and accountability among teams
-
Supporting real-time decision-making based on accurate data
With this dashboard, you can track monthly, MTD (Month-to-Date), and YTD (Year-to-Date) performance in a single view — ensuring complete visibility across your generation units.
Click to Purchases Power Generation KPI Dashboard in Power BI
Structure of the Power Generation KPI Dashboard in Power BI
This Power BI file consists of three main pages, each serving a specific function in your performance analysis process. Let’s go through each one in detail.
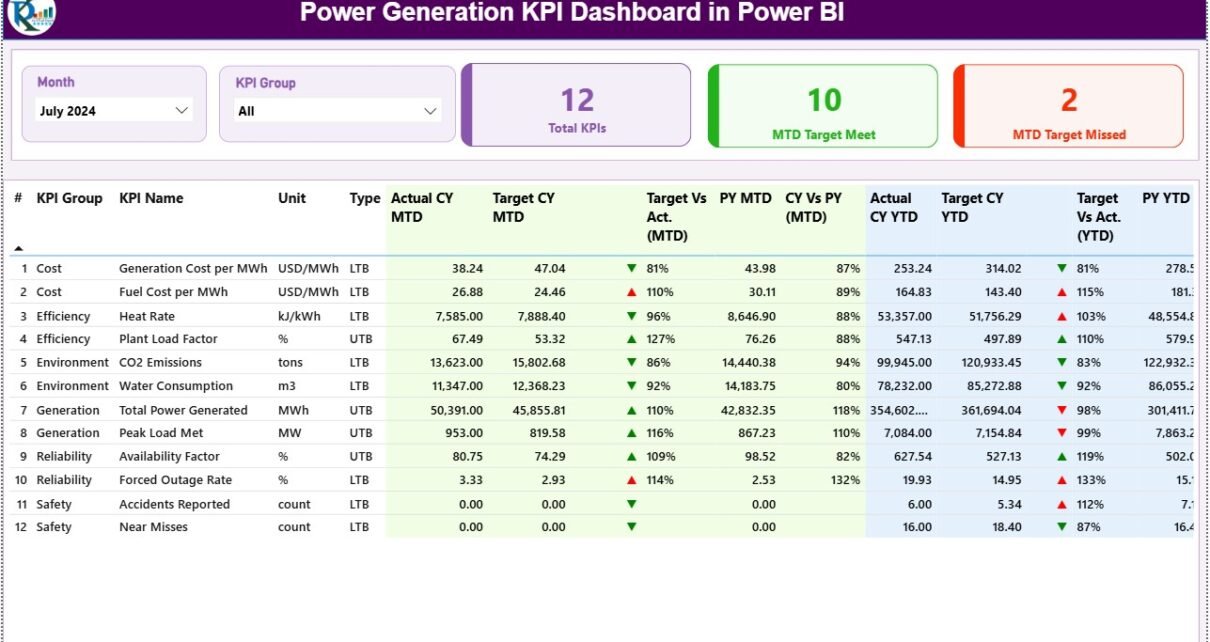
1. Summary Page – The Main Dashboard

The Summary Page is the core of the dashboard. It gives an at-a-glance overview of all KPIs, their targets, and performance status.
Key Components of the Summary Page:
-
🗓️ Slicers for Month and KPI Group:
Users can filter performance data by specific months or KPI categories to focus on relevant insights. -
💡 KPI Cards on Top:
The page includes three key cards:-
Total KPIs Count – Displays the total number of KPIs being tracked.
-
MTD Target Met Count – Shows how many KPIs achieved their month-to-date targets.
-
MTD Target Missed Count – Displays the number of KPIs that didn’t meet targets.
-
-
📋 Detailed KPI Table:
Below the cards, a comprehensive table lists all KPIs with performance metrics, including:-
KPI Number – The sequence number for easy identification.
-
KPI Group – Category of the KPI, such as Energy Output, Maintenance, or Safety.
-
KPI Name – Descriptive name of the metric.
-
Unit – Measurement unit (e.g., MW, %, hours).
-
Type – Indicates if the KPI is “LTB” (Lower the Better) or “UTB” (Upper the Better).
-
Actual CY MTD – Actual Month-to-Date performance for the current year.
-
Target CY MTD – Target Month-to-Date value.
-
MTD Icon – ▲ or ▼ symbol in green or red to show if the KPI met or missed its target.
-
Target vs Actual (MTD) – Percentage comparison using the formula:
Actual / Target -
PY MTD – Month-to-Date performance for the previous year.
-
CY vs PY (MTD) – Comparison of current and previous MTD values.
-
Actual CY YTD – Current Year-to-Date actual performance.
-
Target CY YTD – Current Year-to-Date target.
-
YTD Icon – Visual indicator (▲ or ▼) to show YTD target status.
-
Target vs Actual (YTD) – Formula:
Actual / Targetfor YTD numbers. -
PY YTD – Previous Year YTD value.
-
CY vs PY (YTD) – Year-to-Year comparison ratio.
-
The Summary Page is where decision-makers spend most of their time, as it provides a complete and interactive overview of operational performance.
2. KPI Trend Page – Visualizing Performance Over Time

The KPI Trend Page provides detailed insights into each KPI’s progress over time. It helps users identify seasonal trends, long-term improvements, or potential issues.
Key Features:
-
🎛️ Slicer for KPI Selection:
On the left side, users can select any KPI name to view its detailed trends. -
📊 Two Combo Charts:
-
MTD Chart: Displays Actual, Target, and Previous Year data for Month-to-Date performance.
-
YTD Chart: Shows similar metrics for Year-to-Date, enabling comparison of cumulative progress.
-
-
🔍 Dynamic Interaction:
Selecting a different KPI or month automatically updates both charts, allowing a deeper look at trends and deviations.
This page is ideal for performance reviews, root-cause analysis, and identifying patterns that affect generation efficiency.
3. KPI Definition Page – Understanding Each Metric

The KPI Definition Page serves as a reference library for all KPIs in the system. It is a hidden drill-through page, accessible from the Summary Page.
When users right-click a KPI and choose Drill Through, they’re taken to this page to view complete details about that specific KPI.
Information Displayed:
-
KPI Number
-
KPI Group
-
KPI Name
-
Unit
-
Formula
-
Definition
-
Type (LTB or UTB)
This page ensures transparency and consistency, so users understand what each KPI measures and how it’s calculated. A Back Button on the top-left corner takes users back to the main page instantly.
Excel Data Source Structure
The Power BI dashboard connects to an Excel file that acts as its data source. The Excel file includes three essential worksheets:
1. Input_Actual Sheet
-
Record KPI Name, Month (first day of each month), MTD numbers, and YTD numbers.
-
This sheet captures all actual performance data for KPIs.
2. Input_Target Sheet
-
Fill in the target values for each KPI, Month, MTD, and YTD.
-
Ensures accurate tracking of goal achievement.
3. KPI Definition Sheet
-
Define every KPI’s name, group, unit, formula, type (LTB/UTB), and detailed definition.
-
Establishes a common language for all performance metrics.
Using Excel as a data source allows easy updates without technical complexity — just refresh Power BI, and the dashboard updates automatically.
Click to Purchases Power Generation KPI Dashboard in Power BI
Key KPIs You Can Track in Power Generation
Here are some important KPIs commonly tracked in power generation dashboards:
Operational Efficiency KPIs
-
Plant Load Factor (PLF %): Measures the actual generation as a percentage of the maximum possible output.
-
Heat Rate (kCal/kWh): Indicates thermal efficiency — lower values represent better performance.
-
Auxiliary Power Consumption (%): Tracks internal power used by the plant.
-
Capacity Utilization (%): Shows how effectively installed capacity is being used.
Maintenance and Reliability KPIs
-
Mean Time Between Failures (MTBF): Measures equipment reliability.
-
Mean Time to Repair (MTTR): Indicates maintenance responsiveness.
-
Forced Outage Rate (%): Percentage of unplanned outages compared to total available time.
-
Availability Factor (%): Represents plant uptime and operational reliability.
Safety and Compliance KPIs
-
Lost Time Injury Frequency Rate (LTIFR): Tracks workplace safety incidents.
-
Environmental Compliance Rate (%): Measures adherence to emission and waste regulations.
-
Incident Severity Index: Evaluates the seriousness of recorded incidents.
Financial KPIs
-
Generation Cost per MWh: Determines total cost per unit generated.
-
Revenue per MWh: Tracks earnings per unit sold.
-
Profit Margin (%): Calculates profitability relative to generation costs.
Tracking these KPIs provides a 360° view of operational, financial, and safety performance in power generation plants.
Advantages of Power Generation KPI Dashboard in Power BI
1. Centralized Performance Tracking
All KPIs are integrated into a single platform, eliminating the need for multiple reports.
2. Real-Time Insights
With Power BI’s live connection and refresh capability, users get up-to-date information at all times.
3. Interactive Visualization
Dynamic slicers, combo charts, and visual indicators make data analysis faster and more intuitive.
4. Easy Integration with Excel
Since data is stored in Excel, even non-technical users can update information without coding knowledge.
5. Data-Driven Decision Making
Visual comparisons between actual, target, and previous year data enable quick identification of performance gaps.
6. Improved Transparency
The drill-through feature ensures everyone understands KPI logic, improving trust and collaboration.
7. Scalable and Customizable
Users can easily add new KPIs, departments, or data sources as operations grow.
Best Practices for Using the Power Generation KPI Dashboard
To maximize the effectiveness of your Power BI dashboard, follow these best practices:
1. Define KPIs Clearly
Ensure each KPI has a clear formula, unit, and definition. Consistency prevents misinterpretation.
2. Maintain Data Quality
Regularly verify that Excel inputs are accurate and formatted correctly to prevent visualization errors.
3. Update Data Frequently
Keep the Input_Actual and Input_Target sheets current for timely performance reviews.
4. Use Color Indicators Consistently
Follow a simple rule — green for good, red for bad. Avoid using too many colors, which can confuse users.
5. Train Team Members
Provide short Power BI training sessions so users can interact confidently with slicers and visuals.
6. Automate Refresh Schedules
Use Power BI Service to set up automatic data refreshes if you’re using a shared workspace.
7. Analyze Trends Regularly
Review MTD and YTD trends monthly to spot inefficiencies before they become critical.
8. Link KPIs to Strategic Goals
Align every KPI with broader organizational objectives like cost reduction, safety improvement, or energy efficiency.
How to Use the Dashboard Effectively
-
Open the Power BI dashboard file.
-
Use the slicers on the Summary Page to select a month or KPI group.
-
Review KPI cards for overall status.
-
Examine the detailed table for MTD and YTD performance comparisons.
-
Drill through to KPI Definition for clarification when needed.
-
Visit the KPI Trend Page to analyze progress over time.
-
Update your Excel data source monthly and refresh Power BI to stay current.
By following this workflow, your dashboard remains a living performance monitoring system — not a static report.
Tips for Customization
-
Add new visuals like trend lines or donut charts for enhanced insights.
-
Include department-wise filters to analyze performance by unit or plant.
-
Implement conditional alerts using Power BI notifications.
-
Customize themes and branding to match your organization’s identity.
-
Extend data connections to SQL Server, SharePoint, or cloud sources if needed.
Conclusion
The Power Generation KPI Dashboard in Power BI empowers energy organizations to monitor, measure, and improve performance across all critical areas — from operations to safety and financial results.
By combining Excel data with Power BI’s visualization power, this tool offers unparalleled flexibility and clarity. Whether you oversee one plant or multiple generation units, this dashboard ensures your decisions are based on data, not assumptions.
In today’s data-driven energy landscape, efficiency is everything. With this dashboard, your organization can achieve operational excellence and maintain a competitive edge.
Click to Purchases Power Generation KPI Dashboard in Power BI
Frequently Asked Questions (FAQs)
1. What is the Power Generation KPI Dashboard in Power BI?
It’s an interactive tool designed to track and visualize key performance indicators for power generation operations using Excel data.
2. Can I customize the KPIs?
Yes. You can easily modify or add KPIs by updating the Excel sheets and refreshing the Power BI file.
3. How is data connected to Power BI?
The dashboard connects to an Excel file through Power BI’s data model. Any updates in Excel reflect instantly after refreshing.
4. What types of KPIs can I track?
Operational, maintenance, safety, environmental, and financial KPIs can all be tracked within the dashboard.
5. Is coding knowledge required to use this dashboard?
No. The template is 100% no-code. Anyone with basic Excel and Power BI knowledge can use it effectively.
6. How do I refresh data in Power BI?
Simply click “Refresh” on the Power BI ribbon or schedule an automatic refresh if hosted in the Power BI Service.
7. Can this dashboard handle multiple plants?
Yes. You can include location filters or slicers to analyze KPIs for individual plants or regions.
8. What are MTD and YTD in this context?
MTD (Month-to-Date) shows performance for the current month; YTD (Year-to-Date) tracks cumulative performance from the start of the year.
9. How often should I update the Excel data source?
Update monthly for accuracy. Weekly updates are even better for real-time monitoring.
10. Where can I download this dashboard?
You can download it from NextGenTemplates.com, where it’s available as a ready-to-use Power BI file with sample data and visuals.
Click to Purchases Power Generation KPI Dashboard in Power BI
Visit our YouTube channel to learn step-by-step video tutorials