The maritime and port industry plays a vital role in global trade and logistics. From managing vessels and cargo operations to tracking costs and fuel consumption, every aspect of marine operations generates massive amounts of data. However, making sense of that data can be challenging without a proper analytical system.
That’s where the Marine & Ports Dashboard in Excel comes in.
This ready-to-use Excel-based solution allows managers, logistics coordinators, and maritime analysts to track operational performance, financial metrics, and customer satisfaction — all in one interactive dashboard.
In this article, we’ll explore what this dashboard is, how it works, its structure, advantages, best practices, and frequently asked questions.
Click to Purchases Marine & Ports Dashboard in Excel
What Is a Marine & Ports Dashboard in Excel?
A Marine & Ports Dashboard in Excel is a performance-tracking tool designed to monitor port operations, vessel activities, costs, revenues, and efficiency levels in a centralized and visual format. It transforms raw maritime data into meaningful insights that help decision-makers improve operations and profitability.
Unlike expensive BI software, this Excel-based dashboard provides powerful analytics using built-in charts, pivot tables, and slicers. It is easy to use, fully customizable, and ideal for marine authorities, logistics companies, and port operators who want real-time visibility into their KPIs.
Dashboard Overview
The Marine & Ports Dashboard in Excel comes with a Page Navigator on the left side, allowing users to switch between different analysis pages quickly. Each page focuses on specific operational or financial dimensions, ensuring that you can analyze every aspect of port and vessel performance in detail.
The dashboard includes five main analytical pages and a supporting data sheet, each designed to deliver key insights through charts, cards, and visual metrics.
Let’s break down each section.
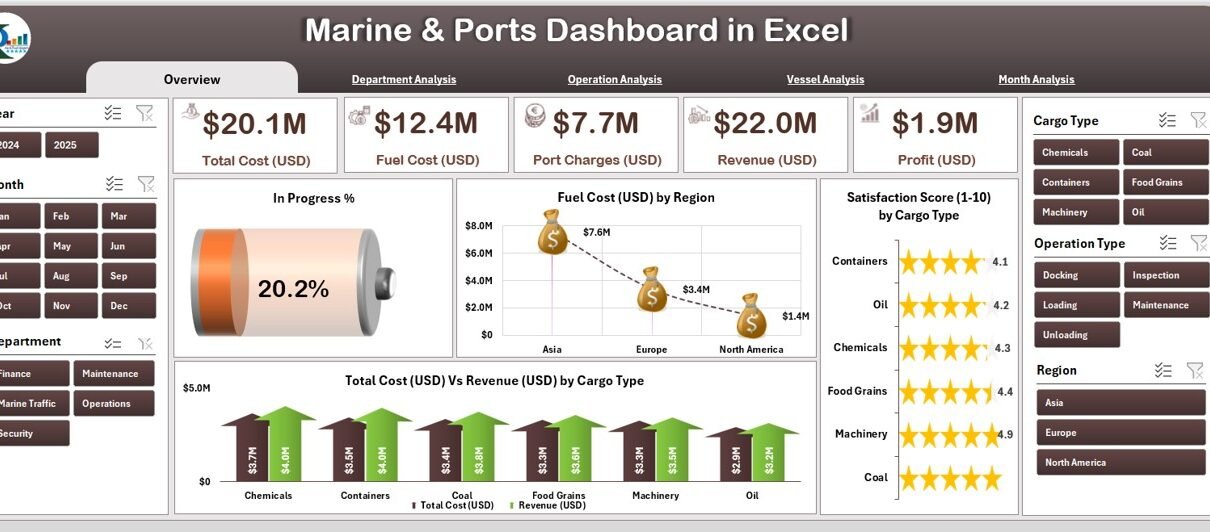
1️⃣ Overview Page
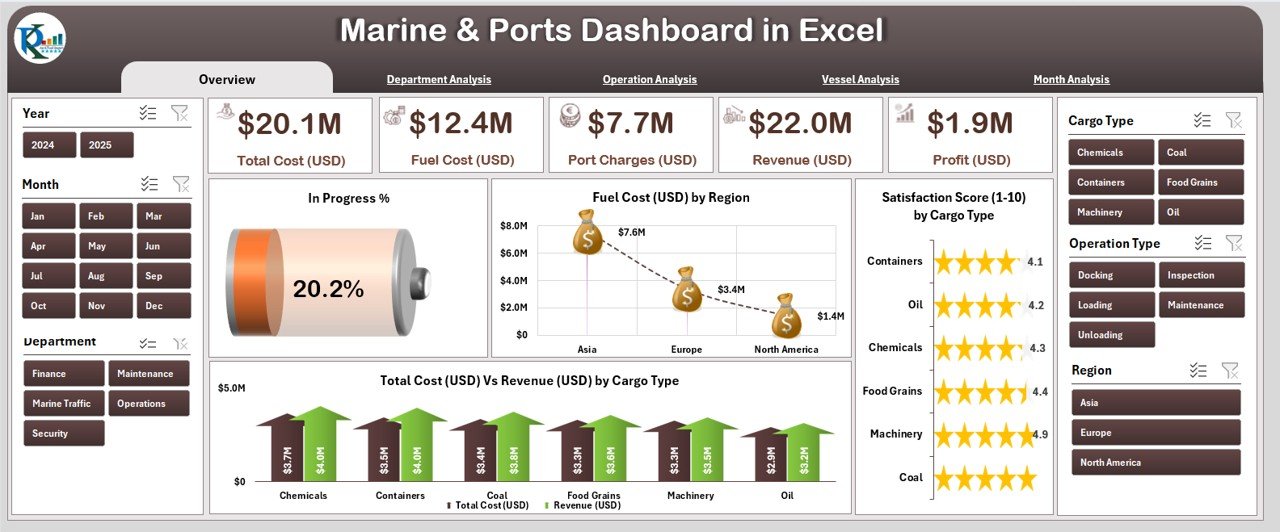
The Overview Page serves as the control center of the dashboard.
It provides a quick glance at high-level performance metrics and visual insights.
Features:
Five KPI Cards display essential metrics such as:
- Progress %
- Total Revenue (USD)
- Total Cost (USD)
- Profit (USD)
- Fuel Cost (USD)
Four dynamic charts visualize trends and comparisons:
- Progress %
- Fuel Cost (USD) by Region
- Satisfaction Score (1–10) by Cargo Type
- Total Cost (USD) vs Revenue (USD) by Cargo Type
This page helps managers identify whether the operations are on track, which regions are incurring higher fuel costs, and how different cargo types perform in terms of cost and satisfaction.
2️⃣ Department Analysis Page
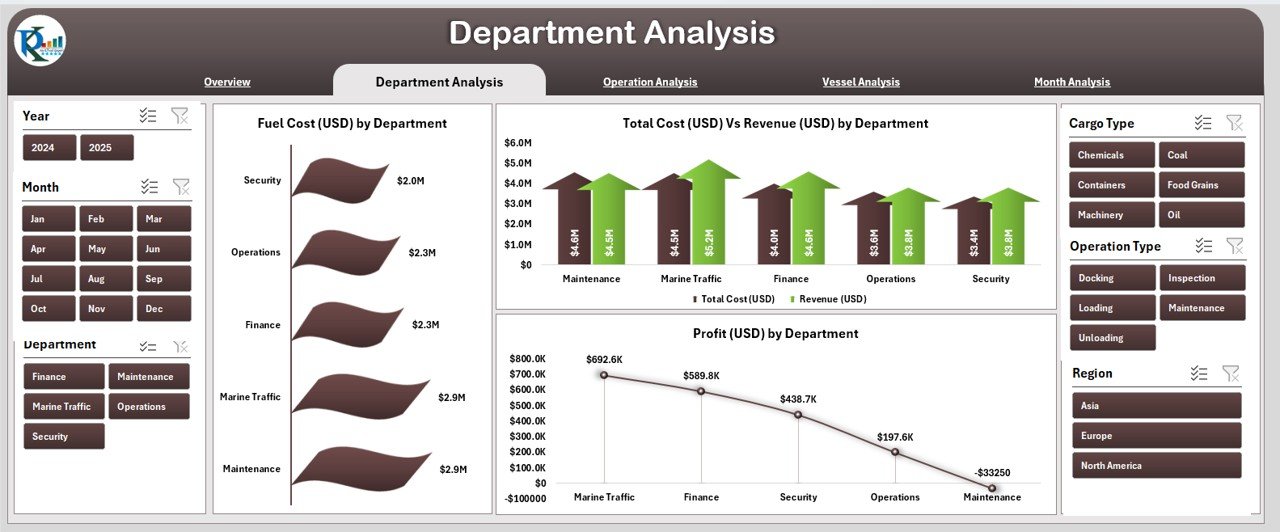
The Department Analysis Page focuses on cost, revenue, and profit distribution across various departments — such as Operations, Maintenance, Administration, and Logistics.
Charts Included:
-
Fuel Cost (USD) by Department
-
Total Cost (USD) vs Revenue (USD) by Department
-
Profit (USD) by Department
How It Helps:
By analyzing these charts, management can quickly identify which departments are cost-intensive and which are generating the highest returns. This insight supports resource optimization and better decision-making.
Click to Purchases Marine & Ports Dashboard in Excel
3️⃣ Operation Analysis Page
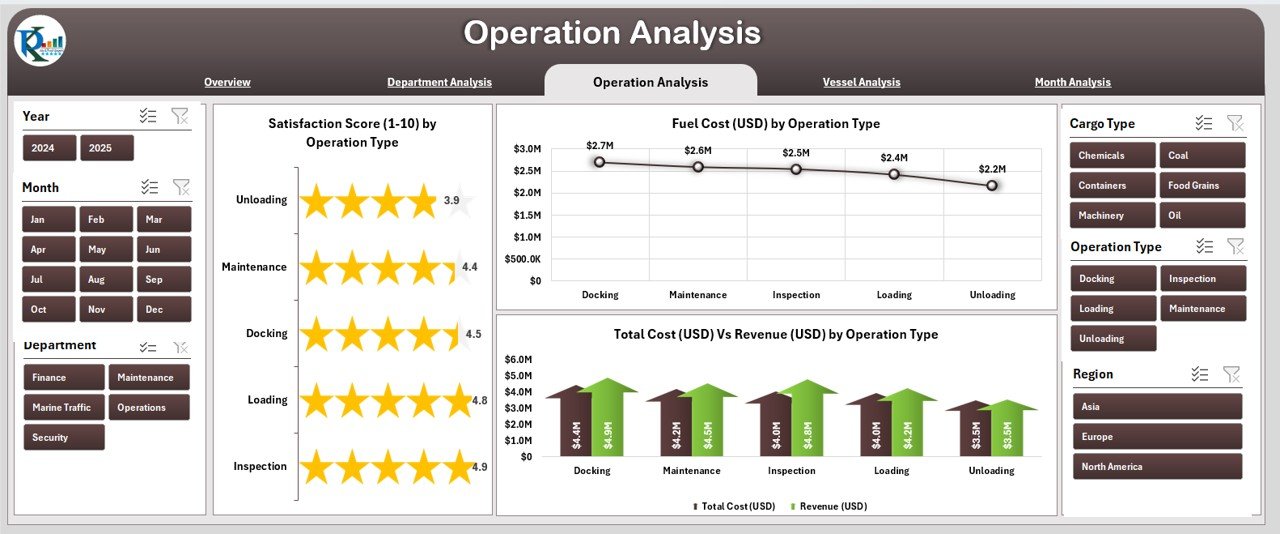
Operational performance determines the success of maritime and port management. The Operation Analysis Page highlights how different operation types impact costs, revenue, and profitability.
Charts Included:
-
Fuel Cost (USD) by Operation Type
-
Total Cost (USD) vs Revenue (USD) by Operation Type
-
Fuel Cost (USD) by Operation Type
Benefits:
This page helps identify operational inefficiencies — for example, detecting routes or operation types that consume more fuel or yield less profit. It enables the team to redesign workflows and adopt cost-saving measures.
4️⃣ Vessel Analysis Page
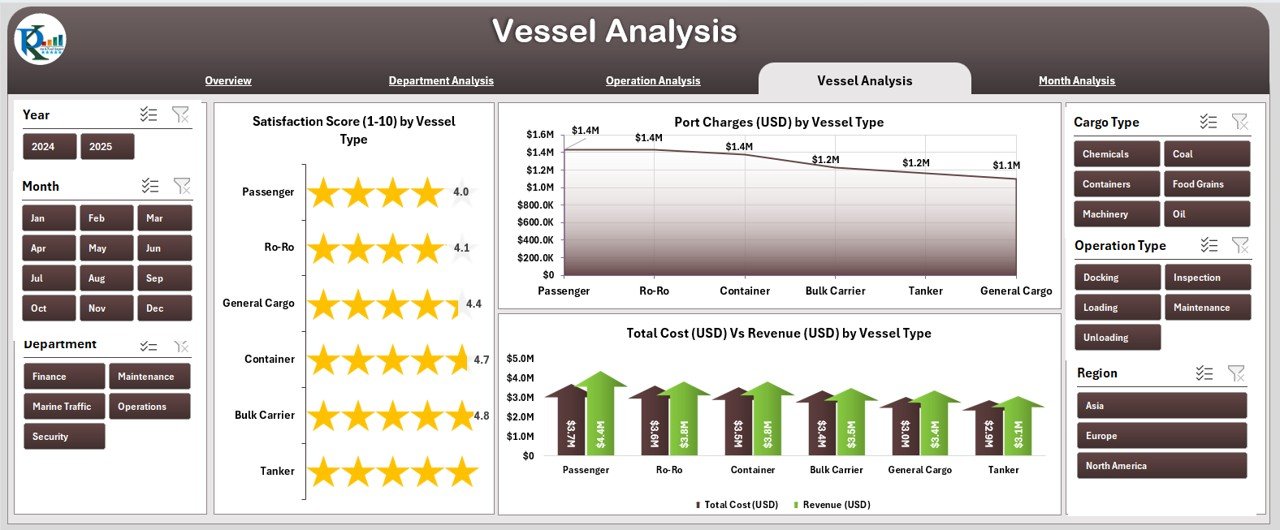
Every vessel contributes differently to overall profitability. The Vessel Analysis Page evaluates performance by vessel type, allowing fleet managers to optimize utilization.
Charts Included:
-
Satisfaction Score (1–10) by Vessel Type
-
Total Cost (USD) vs Revenue (USD) by Vessel Type
-
Profit Changes (USD) by Vessel Type
Insights Provided:
Fleet operators can assess which vessel types deliver the best cost-to-revenue ratios and the highest customer satisfaction scores. This analysis helps in fleet planning, maintenance scheduling, and procurement decisions.
5️⃣ Month Analysis Page
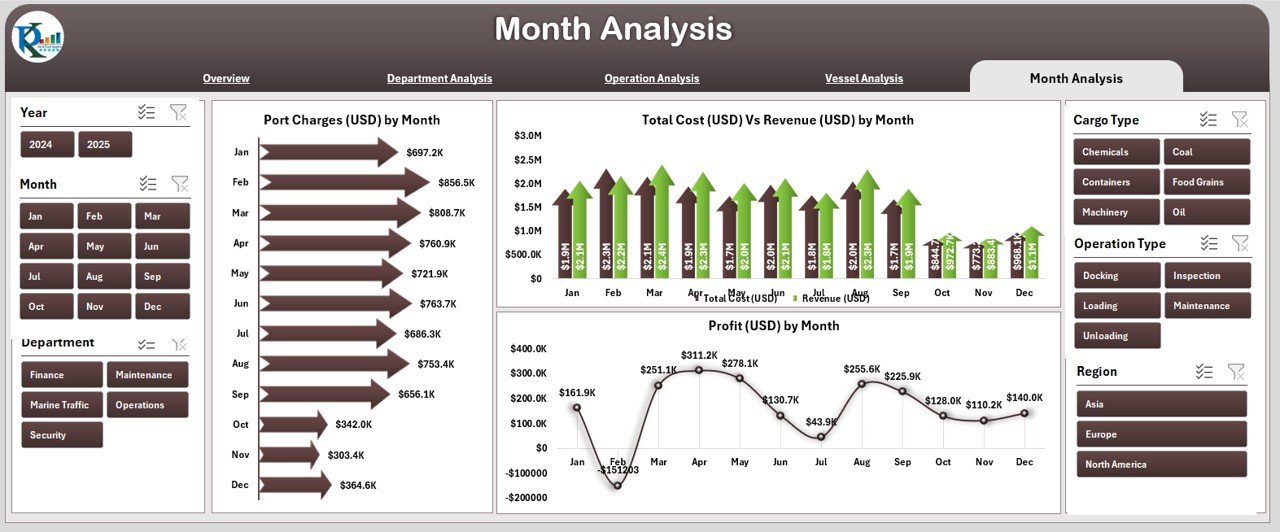
Seasonal and monthly trends can significantly influence marine operations. The Month Analysis Page provides time-based performance tracking.
Charts Included:
-
Profit Changes (USD) by Month
-
Total Cost (USD) vs Revenue (USD) by Month
-
Profit (USD) by Month
Usage:
It enables trend analysis to identify high-performing months, seasonal fluctuations, and recurring cost challenges. This empowers leaders to plan ahead, allocate budgets, and forecast future revenue effectively.
Support & Data Sheets
The dashboard includes a Data Sheet that holds all raw records and source data.
Users can update this sheet monthly or weekly. The dashboard automatically refreshes charts and metrics, ensuring real-time reporting.
The Support Sheet provides essential lists, dropdown values, and lookup references — maintaining data integrity and consistent input formatting across the dashboard.
Key Features of the Marine & Ports Dashboard in Excel
✅ Page Navigator:
Easy-to-use sidebar for quick navigation between pages.
✅ Dynamic Charts & Cards:
Instant visualization of KPIs through interactive Excel charts.
✅ Drop-Down Filters:
Select months, departments, or regions to view focused data.
✅ Profit & Cost Tracking:
Compare actual vs. target data for performance evaluation.
✅ User-Friendly Layout:
Designed for both technical and non-technical professionals.
✅ Customizable Design:
Easily adapt charts, formulas, and colors to suit your organization’s needs.
✅ Automated Refresh:
All metrics update automatically when data changes in the backend sheet.
Advantages of Marine & Ports Dashboard in Excel
A Marine & Ports Dashboard in Excel delivers multiple business advantages across operations, finance, and decision-making.
🚢 1. Centralized Visibility
It consolidates all operational and financial data into one place. Managers don’t need multiple reports — everything is available in a single dashboard.
💡 2. Better Decision-Making
By converting raw data into visual KPIs, it supports quick and informed decisions. You can spot cost overruns, fuel inefficiencies, or satisfaction issues instantly.
⏱️ 3. Time Efficiency
Instead of spending hours preparing reports, users can analyze real-time charts that update automatically as new data arrives.
💰 4. Financial Control
It helps track and compare cost vs. revenue across cargo types, departments, and operations. This prevents budget leaks and improves profitability.
📊 5. Operational Optimization
With operation-wise fuel and cost data, managers can identify improvement areas — like optimizing routes, reducing idle time, or upgrading vessels.
🌍 6. Environmental Impact Tracking
Fuel consumption data indirectly supports sustainability analysis. Tracking this helps in implementing eco-friendly measures and achieving emission goals.
🧭 7. Easy Integration
Since it’s built in Excel, it easily integrates with ERP systems, CSV data, or manual logs without any coding.
Why Choose Excel for Marine Analytics?
Click to Purchases Marine & Ports Dashboard in Excel
While many organizations use high-end tools like Power BI or Tableau, Excel remains the most practical solution for marine analytics because:
-
It’s universally available and requires no extra software installation.
-
Excel dashboards are lightweight, portable, and shareable via email or cloud.
-
You can add custom formulas, pivot tables, and macros for automation.
-
It supports what-if analysis, which helps in operational planning.
-
Most importantly, it ensures data confidentiality because everything stays local.
How to Use the Marine & Ports Dashboard
Using the dashboard is straightforward, even for non-technical users.
-
Enter Data:
Update the data sheet with monthly or departmental records such as revenue, cost, fuel usage, and satisfaction score. -
Refresh the Dashboard:
Click the refresh button or use Excel’s “Data → Refresh All” to update all visuals instantly. -
Navigate Between Pages:
Use the page navigator to switch between Overview, Department, Operation, Vessel, and Month analyses. -
Apply Filters:
Choose the desired month, region, or department to get focused results. -
Interpret Results:
Study charts and cards to find out which area performs well and which needs attention.
Use Cases of the Marine & Ports Dashboard
The dashboard suits various stakeholders in the maritime ecosystem:
-
Port Authorities: Monitor cargo throughput, revenue, and fuel consumption.
-
Shipping Companies: Track vessel performance and operational costs.
-
Finance Teams: Evaluate profitability and forecast budgets.
-
Operations Managers: Analyze route performance and resource utilization.
-
Consultants & Analysts: Use it for strategic audits and performance reviews.
Best Practices for the Marine & Ports Dashboard in Excel
To get maximum value from this dashboard, follow these proven best practices:
⚙️ 1. Maintain Data Accuracy
Ensure all entries in the data sheet are consistent and verified. Accurate data is the foundation of meaningful analytics.
🔄 2. Update Data Regularly
Refresh the data sheet weekly or monthly. Frequent updates keep your reports relevant.
📁 3. Use Defined Naming Conventions
Label departments, cargo types, and vessel names consistently to avoid mismatched data.
🎨 4. Keep Dashboard Design Clean
Avoid overcrowding charts. Maintain a balance between visuals and key metrics for better readability.
📈 5. Compare Actual vs. Target
Add target columns for each KPI. Comparing actual vs. target helps identify deviations quickly.
📧 6. Share Interactive Reports
Use Excel’s protection features or share via cloud links so stakeholders can explore dashboards securely.
🧮 7. Back Up Data Regularly
Maintain historical copies of your data to analyze long-term performance trends.
🧭 8. Automate Where Possible
Leverage Excel formulas, pivot tables, and macros to reduce manual effort and enhance productivity.
Opportunities for Improvement
While this dashboard is powerful, it can always evolve with new ideas:
-
Integration with Power BI: Combine Excel with Power BI for real-time cloud-based visualization.
-
Advanced KPI Modeling: Add predictive formulas to forecast fuel costs or profit margins.
-
VBA Automation: Automate data imports, navigation, or report exports.
-
Mobile-Friendly Version: Develop a simplified mobile dashboard for on-the-go updates.
-
Sustainability KPIs: Include carbon-emission indicators for eco-performance tracking.
Conclusion
The Marine & Ports Dashboard in Excel is more than a spreadsheet — it’s a strategic tool for maritime intelligence. It gives port authorities, shipping companies, and marine operators full control over their operations, financials, and customer satisfaction metrics.
By adopting this ready-to-use Excel dashboard, organizations can transition from manual reporting to smart, data-driven decision-making. Whether you want to monitor vessel efficiency, reduce fuel costs, or track monthly profits, this dashboard provides everything you need in a single, intuitive interface.
Frequently Asked Questions (FAQs)
1. What is a Marine & Ports Dashboard in Excel?
It’s an interactive Excel-based analytics tool that tracks operational, financial, and performance metrics for maritime and port management.
2. Who can use this dashboard?
Port managers, logistics teams, finance departments, and shipping companies can use it to analyze cost, revenue, and efficiency metrics.
3. Do I need advanced Excel skills to use it?
No. The dashboard is designed for everyone. You just need to update data in the provided sheet — all charts and visuals update automatically.
4. Can I customize the dashboard?
Yes. You can edit chart titles, colors, and formulas to suit your business needs.
5. How often should I update the data?
It’s recommended to update the data monthly or weekly for real-time and accurate insights.
6. Can I add more KPIs?
Absolutely. You can insert additional metrics like carbon emissions, port congestion rate, or fuel efficiency ratio.
7. Does it work on all Excel versions?
Yes. It works on Excel 2016 or later (Windows and macOS) with full compatibility for pivot charts and slicers.
8. Can I share the dashboard with others?
Yes. You can share it as an Excel file or via OneDrive or SharePoint so that stakeholders can view or interact with it.
9. Is the data secure?
All data stays within your Excel file and local system, ensuring full confidentiality.
10. What are the main benefits of using this dashboard?
It saves time, reduces reporting errors, improves operational visibility, and enhances decision-making across the marine and port ecosystem.
Visit our YouTube channel to learn step-by-step video tutorials
Click to P
Watch the step-by-step video tutorial:
urchases Marine & Ports Dashboard in Excel