Running a landscaping business successfully requires more than just creativity and great customer service — it demands data-driven management. From project timelines to service costs and client satisfaction, tracking the right Key Performance Indicators (KPIs) ensures your business remains efficient, profitable, and growth-oriented.
The Landscaping Services KPI Dashboard in Power BI brings all this data together in one place. It transforms raw information into insightful visuals, allowing owners, project managers, and finance teams to monitor operations with ease.
In this guide, we’ll explore what this dashboard includes, how it works, its advantages, best practices, and frequently asked questions — everything you need to understand and use this dashboard effectively.
Click to Purchases Landscaping Services KPI Dashboard in Power BI
🌱 What Is a Landscaping Services KPI Dashboard in Power BI?
A Landscaping Services KPI Dashboard is a performance monitoring system designed in Microsoft Power BI, specifically for landscaping companies. It connects to an Excel data source and helps track essential KPIs such as project completion rates, target achievements, maintenance schedules, and customer satisfaction.
By visualizing this data interactively, managers can instantly identify performance trends, assess progress against targets, and take informed actions.
In simple terms, this dashboard transforms manual data management into a visual, automated decision-making tool.
🧩 Why Landscaping Businesses Need KPI Dashboards
Landscaping companies handle multiple projects simultaneously — from residential lawns to large commercial properties. Each project involves budgeting, manpower, resource allocation, and customer communication.
Without a KPI dashboard, teams often struggle with:
-
Tracking progress across projects
-
Monitoring performance goals
-
Comparing current results to past performance
-
Identifying issues early enough to fix them
The Landscaping Services KPI Dashboard in Power BI solves all these problems by providing real-time analytics and clear visuals that anyone can interpret — even without technical expertise.
Click to Purchases Landscaping Services KPI Dashboard in Power BI
📊 Key Features of the Landscaping Services KPI Dashboard in Power BI
This ready-to-use dashboard contains three analytical pages — each designed to offer a different perspective on performance and KPIs.
1️⃣ Summary Page — The Central Control Panel
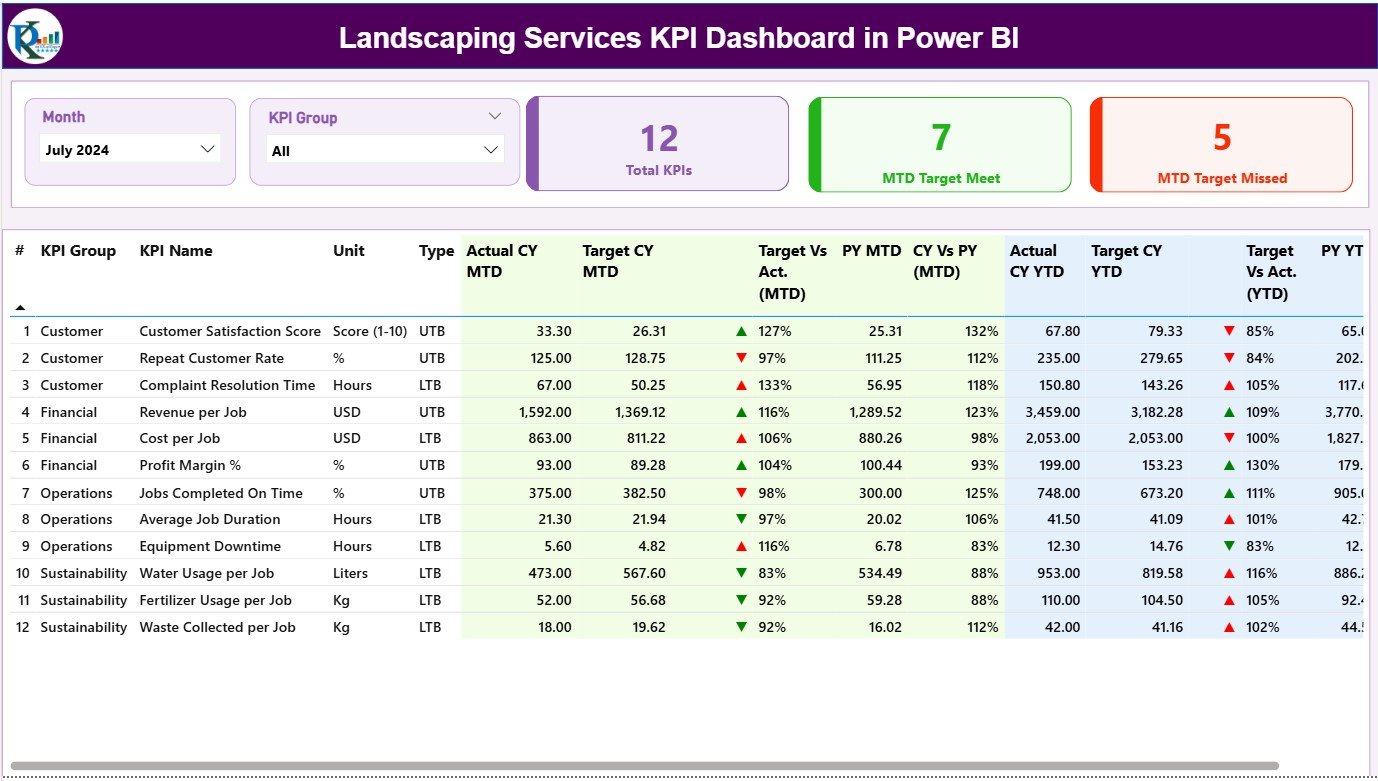
The Summary Page is the main page of the dashboard — the place where users can get a complete overview of business performance.
Key features include:
-
🎚️ Slicers for Month and KPI Group:
Located at the top, these slicers let you filter KPIs by month or category (e.g., Operations, Finance, or Customer Service). -
📈 Performance Cards:
Three visual cards display key summary metrics:-
Total KPIs Count
-
MTD Target Met Count
-
MTD Target Missed Count
-
-
📋 Detailed KPI Table:
The table below provides full KPI-level visibility with columns such as:-
KPI Number – Unique sequence for each KPI
-
KPI Group – The category it belongs to
-
KPI Name – The metric being tracked
-
Unit – Measurement unit (e.g., %, Hours, USD)
-
Type – Lower the Better (LTB) or Upper the Better (UTB)
-
Actual CY MTD – Current Year’s Month-to-Date actual values
-
Target CY MTD – MTD target values for comparison
-
MTD Icon – Red/Green ▼▲ icons indicating KPI status
-
Target vs Actual (MTD) – Percentage value (Actual ÷ Target)
-
PY MTD – Previous Year MTD data
-
CY vs PY (MTD) – Comparison between Current and Previous Year MTD values
-
Actual CY YTD – Year-to-Date actuals
-
Target CY YTD – Year-to-Date targets
-
YTD Icon – Visual indicator showing performance status
-
Target vs Actual (YTD) – Percentage performance vs target
-
PY YTD – Last year’s YTD data
-
CY vs PY (YTD) – YTD comparison between current and previous years
-
This page gives users an instant understanding of where they stand versus their targets, both monthly and yearly.
2️⃣ KPI Trend Page — Visualizing Performance Over Time

The KPI Trend Page helps users visualize how KPIs change month after month.
Main features include:
-
Two combo charts — one for MTD and another for YTD — displaying Actual, Target, and Previous Year values.
-
A KPI selector slicer on the left side (cell-linked from the data model).
-
Line and column combinations to highlight trends clearly.
This view helps users track improvements or identify areas where performance dips repeatedly.
For instance, if the “Average Project Completion Time” has improved consistently over six months, this chart makes it immediately visible.
3️⃣ KPI Definition Page — Your Reference Sheet
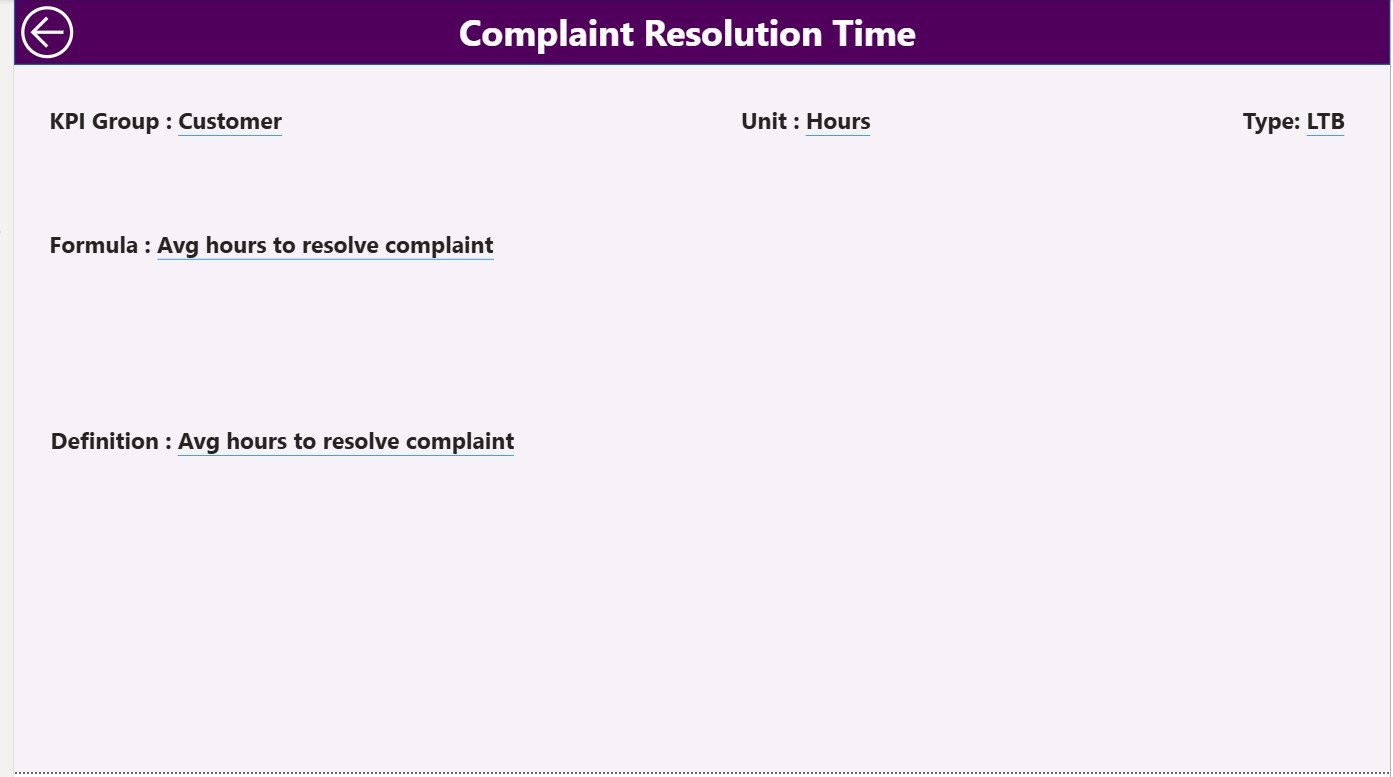
The KPI Definition Page acts as a drill-through page where users can view the detailed definition and formula for each KPI.
It remains hidden by default, but you can drill through from the Summary Page to view details like:
-
KPI Formula
-
Definition
-
Unit
-
Type (LTB or UTB)
To return, simply click the Back button on the top-left corner.
This structure ensures clarity, consistency, and easy navigation across the report.
📂 Excel Data Source Structure
The dashboard fetches its data directly from an Excel workbook, ensuring flexibility and user control. The Excel file contains three key sheets:
1. Input_Actual Sheet Tab
Enter actual KPI data here — including KPI Name, Month (first day of the month), MTD, and YTD figures.
2. Input_Target Sheet Tab
Enter target values for each KPI by month, along with MTD and YTD target numbers.
3. KPI Definition Sheet Tab
Define your KPIs with the following columns:
-
KPI Number
-
KPI Group
-
KPI Name
-
Unit
-
Formula
-
Definition
-
Type (LTB or UTB)
This integration allows the Power BI file to refresh instantly whenever Excel data updates — no need for complex configurations.
Click to Purchases Landscaping Services KPI Dashboard in Power BI
🧠 How the Landscaping Services KPI Dashboard Works
Here’s how the dashboard operates step by step:
-
Data Entry: Input your actuals and targets into the Excel sheets.
-
Power BI Refresh: Load or refresh your data source in Power BI Desktop.
-
Visualization: The dashboard automatically updates visuals and calculations.
-
Navigation: Use slicers to filter by month or KPI group, or drill through to details.
-
Decision-Making: Review KPIs where performance is below target and take corrective action.
With this setup, you can monitor monthly and yearly results without manual reports.
🏗️ Key KPIs for Landscaping Businesses
Your landscaping dashboard can include a wide variety of KPIs across operations, finance, and customer service.
Operational KPIs
-
Average Project Completion Time (Days)
-
On-Time Project Delivery (%)
-
Equipment Utilization Rate (%)
-
Labor Productivity (Hours per Project)
Financial KPIs
-
Revenue per Project ($)
-
Profit Margin (%)
-
Cost per Square Foot ($)
-
Budget Variance (%)
Customer & Quality KPIs
-
Customer Satisfaction Score (CSAT %)
-
Repeat Business Rate (%)
-
Complaint Resolution Time (Hours)
-
Quality Inspection Pass Rate (%)
Tracking these KPIs ensures that your company doesn’t just complete jobs — it does so profitably and consistently.
Click to Purchases Landscaping Services KPI Dashboard in Power BI
🌟 Advantages of Landscaping Services KPI Dashboard in Power BI
The dashboard offers multiple benefits that directly impact business performance:
✅ 1. Real-Time Visibility
Power BI automatically visualizes data updates, enabling management to see live progress across all projects.
✅ 2. Centralized Data Monitoring
All KPIs, targets, and historical data sit in one interactive dashboard, eliminating multiple spreadsheets.
✅ 3. Better Decision-Making
Decision-makers can compare actuals to targets instantly, identifying underperforming areas before they become problems.
✅ 4. Cost and Time Efficiency
Automated visuals replace hours of manual reporting — freeing time for planning and client engagement.
✅ 5. Trend Analysis
MTD and YTD comparisons make it easy to analyze how performance evolves throughout the year.
✅ 6. Data Consistency and Clarity
The KPI Definition page ensures that every metric has a standard formula and meaning, avoiding confusion.
✅ 7. Drill-Through Insights
Click through KPIs to view details like formulas and definitions, keeping your reporting interactive and insightful.
✅ 8. Professional Presentation
Power BI visuals add a polished, professional look — perfect for client reports, internal reviews, or management meetings.
🔧 How to Customize the Dashboard
To tailor the dashboard for your landscaping business, you can:
-
Add new KPIs such as fertilizer usage or fuel costs.
-
Adjust color indicators to match your brand theme.
-
Create department-specific dashboards (e.g., Operations vs. Sales).
-
Link directly to your CRM or accounting system using Power Query.
-
Embed visuals into client reports to showcase project performance.
The flexibility of Power BI ensures the dashboard grows with your business.
🧭 Best Practices for Using the Landscaping Services KPI Dashboard
To make the most of your KPI dashboard, follow these practical tips:
🌿 1. Keep Data Clean and Consistent
Ensure Excel sheets have no blank rows or inconsistent KPI names before refreshing.
📅 2. Update Data Regularly
Update actual and target data monthly to maintain the accuracy of MTD and YTD trends.
🧩 3. Use Meaningful Visuals
Avoid overloading visuals; use color and icons to highlight key changes only.
🎯 4. Define Clear Ownership
Assign responsibility for each KPI (e.g., Operations Manager for “On-Time Delivery %”).
💬 5. Communicate Insights
Share reports in Power BI Service or export visuals to PDF for team meetings.
🔄 6. Automate Refresh Schedules
Set up automatic refreshes if connected to cloud or shared Excel files.
📊 7. Compare Year-Over-Year
Always track current performance against the same period last year for context.
📈 8. Review KPI Relevance
Periodically update your KPIs to reflect changing business priorities, such as sustainability or cost control.
These practices help maintain the accuracy, clarity, and relevance of your Power BI dashboards.
🧩 Example of KPI Analysis
Imagine your On-Time Project Delivery Rate drops from 92% last year to 80% this month.
In the Summary Page, a red ▼ icon appears, and the Target vs Actual (MTD) column shows a drop below 90%. The KPI Trend Page further confirms that delays increased during the rainy season.
You can now analyze deeper — maybe manpower scheduling or supply chain delays caused the decline. With these insights, managers can plan proactive actions to improve future performance.
🧠 How This Dashboard Supports Decision-Making
This Power BI dashboard turns operational data into actionable intelligence. Managers can:
-
Identify underperforming projects quickly.
-
Compare MTD vs. YTD results.
-
Evaluate profitability by service type or region.
-
Optimize labor and resource utilization.
-
Showcase data-driven results during client presentations.
Instead of scattered Excel sheets, the dashboard gives a complete business snapshot in one click.
🪴 Tips to Enhance Your KPI Dashboard Experience
-
Add slicers for project type, location, or customer segment.
-
Use tooltips to display extra details when hovering over visuals.
-
Implement conditional color scales for performance grading.
-
Include a data refresh log to track updates.
-
Use Power BI bookmarks for different management views.
🏁 Conclusion
The Landscaping Services KPI Dashboard in Power BI helps businesses manage projects, monitor financial performance, and ensure customer satisfaction — all in one interactive, easy-to-use platform.
By combining Excel data sources with Power BI’s visual power, you can turn your landscaping data into meaningful insights. Whether you manage a small team or multiple branches, this dashboard helps you stay on target, control costs, and continuously improve service quality.
Click to Purchases Landscaping Services KPI Dashboard in Power BI
❓ Frequently Asked Questions (FAQs)
1. What is the Landscaping Services KPI Dashboard in Power BI?
It’s a Power BI-based visual analytics tool that tracks key landscaping KPIs using data from Excel, helping businesses monitor performance in real time.
2. Who should use this dashboard?
Ideal users include landscaping company owners, operations managers, project supervisors, and finance teams.
3. What data source does it use?
The dashboard connects to an Excel file that includes input sheets for Actuals, Targets, and KPI Definitions.
4. Can I customize the KPIs?
Yes, you can add or modify KPIs based on your business needs, including custom formulas and categories.
5. Does it show MTD and YTD performance?
Absolutely. It compares Month-to-Date and Year-to-Date metrics along with Previous Year data.
6. How are KPIs visualized?
Through tables, combo charts, and color-coded indicators (green for target met, red for missed).
7. Can I drill down into KPI details?
Yes. Use the drill-through feature on the Summary Page to access detailed KPI definitions.
8. Do I need advanced Power BI skills?
Not at all. The dashboard is fully pre-built; you only need to update the Excel data and refresh.
9. Can I share this dashboard with my team?
Yes, publish it to Power BI Service or export as PDF to share insights easily.
10. Where can I download this template?
You can download the Landscaping Services KPI Dashboard in Power BI directly from NextGenTemplates.com — your trusted hub for professional Power BI and Excel dashboards.
Click to Purchases Landscaping Services KPI Dashboard in Power BI
Visit our YouTube channel to learn step-by-step video tutorials