In the modern world, outsourcing has become a strategic tool for organizations to manage efficiency, reduce costs, and scale operations. Businesses that rely on BPO (Business Process Outsourcing) and KPO (Knowledge Process Outsourcing) face a common challenge — managing performance across multiple clients, departments, and processes.
That’s where the Outsourcing (BPO KPO) Dashboard in Excel steps in. This dashboard transforms complex outsourcing data into clear, actionable insights through visual charts, KPIs, and metrics — all in one easy-to-use Excel file.
Click to Purchases Outsourcing (BPO KPO) Dashboard in Excel
📊 What Is an Outsourcing (BPO KPO) Dashboard in Excel?
An Outsourcing (BPO KPO) Dashboard in Excel is a performance-monitoring tool designed to analyze outsourcing projects across different dimensions like departments, clients, teams, and processes. It helps business leaders and managers visualize data such as project profitability, cost-to-revenue ratios, customer satisfaction, and delays — without needing advanced BI software.
This ready-to-use Excel template is ideal for both BPO (transaction-based operations such as customer service, accounting, HR, etc.) and KPO (knowledge-driven services like analytics, research, and consulting).
By using Excel’s power of pivot tables, slicers, and charts, this dashboard allows you to track performance dynamically and make better, data-driven decisions.
⚙️ Key Features of the Outsourcing (BPO KPO) Dashboard
The dashboard has been carefully structured to cover every angle of BPO and KPO operations. Below are its five analytical pages, each providing specific insights.
🏠 1. Overview Page
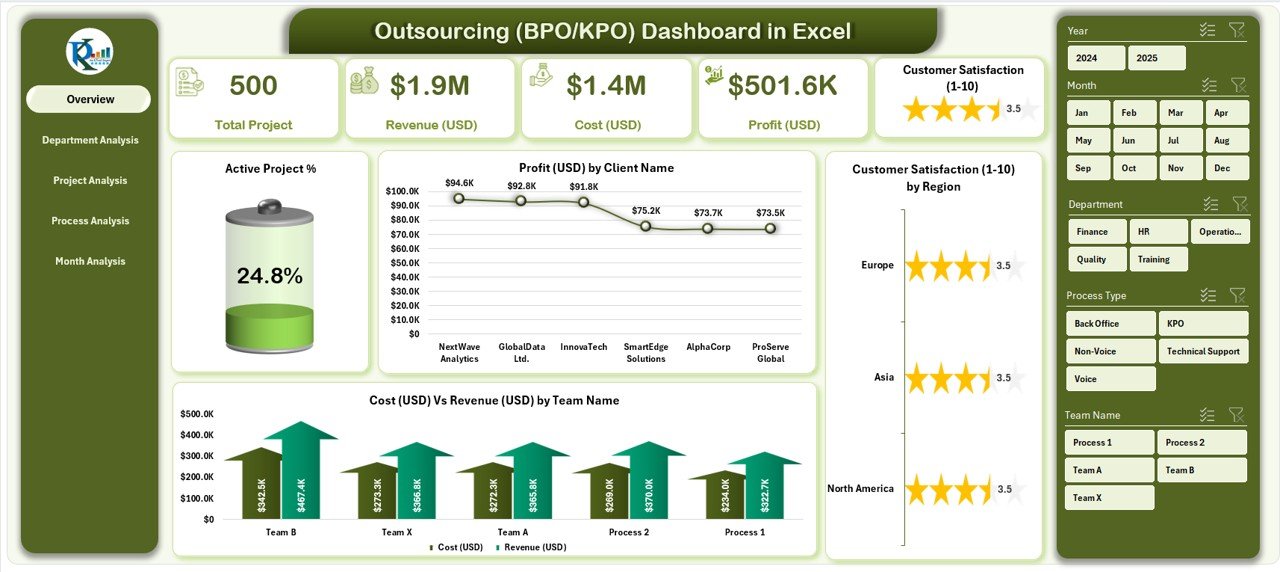
This is the main page — your executive summary of outsourcing performance.
-
Page Navigator: Located on the left side, it allows seamless movement between all dashboard pages.
-
Performance Cards: Display quick summaries of key metrics such as:
-
Active Project %
-
Total Profit (USD)
-
Cost vs Revenue (USD)
-
Customer Satisfaction (1–10) by Region
-
-
Visual Charts:
-
Active Project %
-
Profit (USD) by Client Name
-
Customer Satisfaction (1–10) by Region
-
Cost (USD) vs Revenue (USD) by Team Name
-
This page gives decision-makers a bird’s-eye view of company health and client performance.
🧩 2. Department Analysis Page
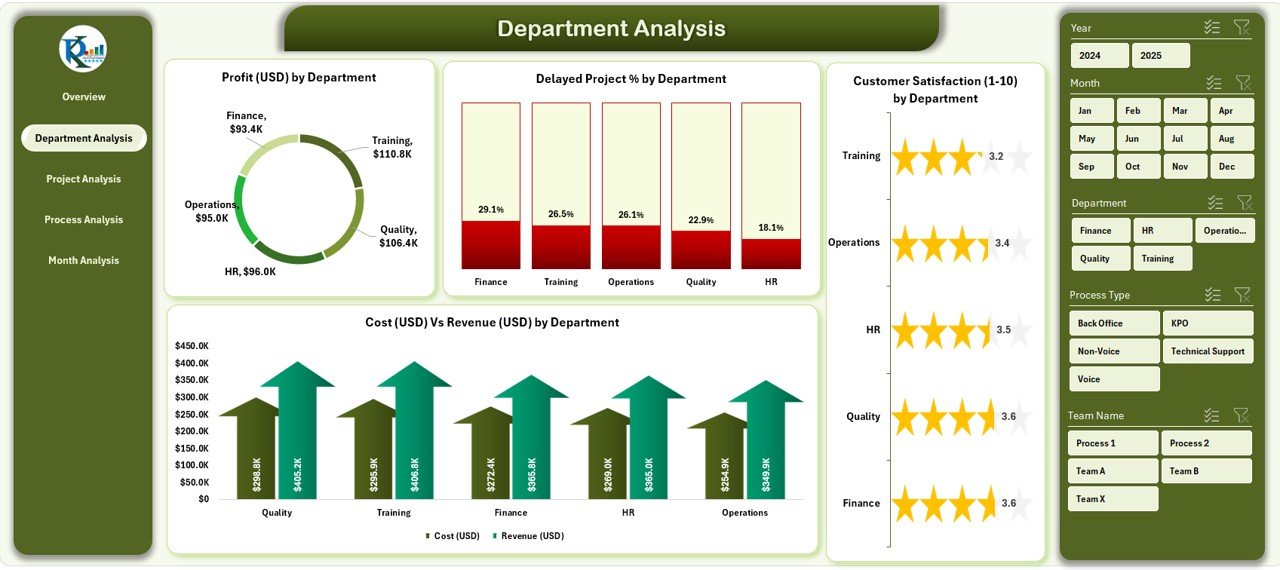
Departments form the backbone of every outsourcing company. This page breaks down key metrics by each department to pinpoint operational efficiency and improvement areas.
-
Charts Included:
-
Profit (USD) by Department
-
Delayed Project % by Department
-
Customer Satisfaction (1–10) by Department
-
Cost (USD) vs Revenue (USD) by Department
-
-
Click to Purchases Outsourcing (BPO KPO) Dashboard in Excel
The Department Analysis helps leaders compare productivity and profitability among departments like Finance BPO, HR Services, Tech Support, or Research KPO.
🧮 3. Project Analysis Page
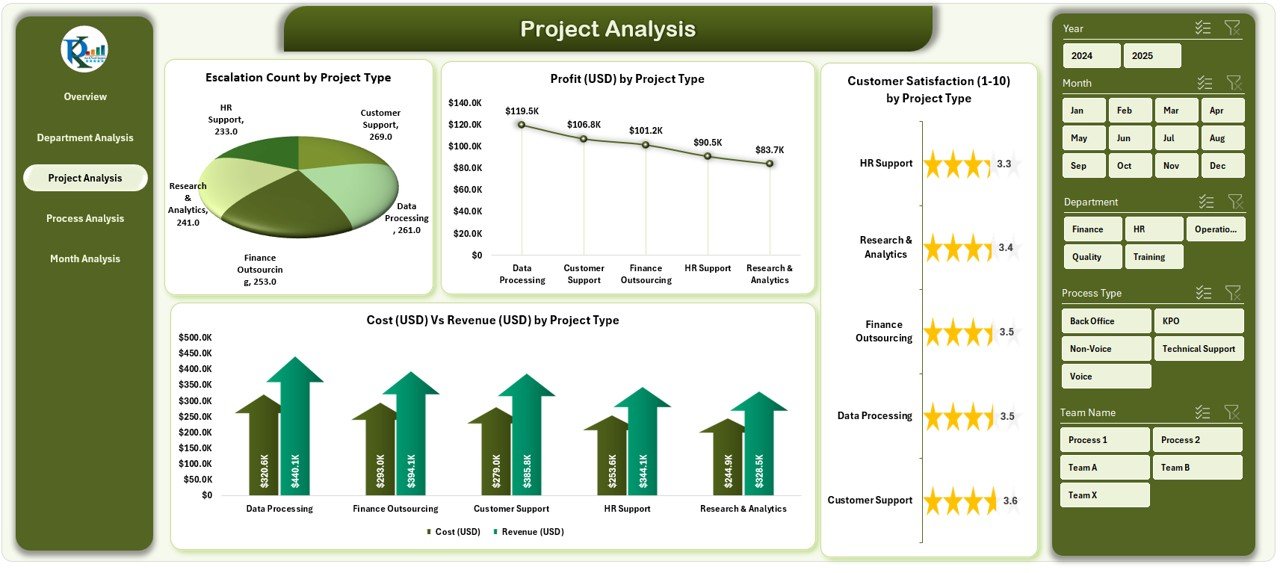
Projects vary in complexity, profitability, and duration. The Project Analysis page helps you drill into project-specific metrics.
-
Charts Included:
-
Profit (USD) by Project Type
-
Delayed Project % by Project Type
-
Customer Satisfaction (1–10) by Project Type
-
Cost (USD) vs Revenue (USD) by Project Type
-
Managers can instantly identify which project types yield maximum profit and which require performance improvement.
🔄 4. Process Analysis Page
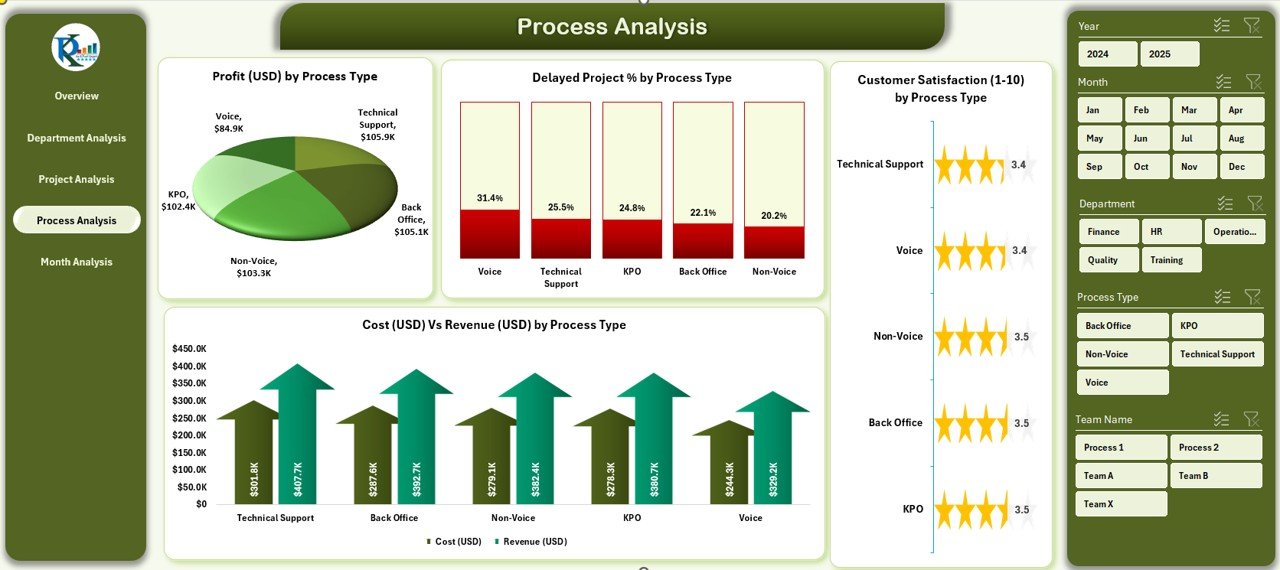
This page examines the efficiency and profitability of each process within the outsourcing workflow.
-
Charts Included:
-
Profit (USD) by Process Type
-
Delayed Project % by Process Type
-
Customer Satisfaction (1–10) by Process Type
-
Cost (USD) vs Revenue (USD) by Process Type
-
Whether your teams handle payroll processing, data analytics, or research documentation, this page clarifies which processes perform well and which cause cost leaks.
📅 5. Month Analysis Page
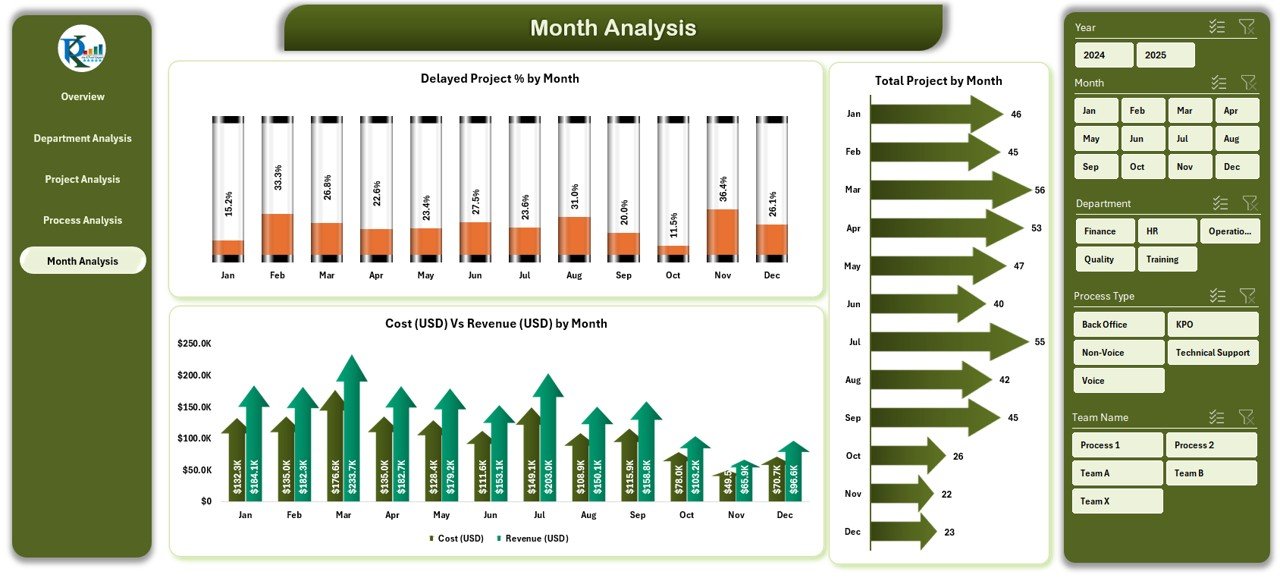
Time-based analysis helps you observe trends and seasonality. The Month Analysis page shows how performance fluctuates month-to-month.
-
Charts Included:
-
Delayed Project % by Month
-
Cost (USD) vs Revenue (USD) by Month
-
Total Projects by Month
-
By tracking progress monthly, you can forecast future workloads, set realistic targets, and align resource planning.
📂 Support Sheet: Data Sheet
All charts pull data from the Data Sheet, which stores detailed performance records — such as department name, client name, process type, project type, cost, revenue, satisfaction score, and project duration.
This central dataset acts as the foundation for all insights shown across dashboard pages.
💡 Why Should Businesses Use a BPO KPO Dashboard in Excel?
Click to Purchases Outsourcing (BPO KPO) Dashboard in Excel
Excel remains one of the most flexible and widely used platforms for performance management. While Power BI and Tableau offer advanced visualization, Excel’s accessibility makes it perfect for medium-sized outsourcing businesses.
Key Reasons:
-
No Additional Software: Runs directly in Microsoft Excel.
-
Customizable: Add or remove KPIs easily.
-
Affordable: No licensing or subscription cost.
-
Offline Access: Work anywhere without the internet.
-
Easy Sharing: Email or cloud-share Excel files effortlessly.
This dashboard empowers business leaders to track profitability, optimize costs, and enhance client satisfaction using familiar Excel tools.
🚀 How Does the Outsourcing Dashboard Work?
The dashboard uses a structured Excel data model. Here’s how it functions:
-
Data Input: Users enter monthly project data such as cost, revenue, project type, and satisfaction score into the Data Sheet.
-
Auto-Calculation: Excel formulas and pivot tables compute metrics like Profit %, Delayed Project %, and Average Satisfaction Score.
-
Dynamic Visuals: Charts update automatically through slicers and filters for real-time insights.
-
Page Navigation: A built-in navigator allows quick access between Overview, Department, Project, Process, and Month Analysis.
No coding or macro knowledge is required — everything works through Excel’s built-in functionality.
🏢 Applications of BPO KPO Dashboard Across Industries
Outsourcing spans various sectors, and this dashboard adapts to all.
Popular Use Cases:
-
Customer Support BPO: Track query resolution time, client ratings, and cost vs revenue.
-
Finance BPO: Monitor transaction accuracy, audit compliance, and cost efficiency.
-
IT KPO: Measure project profitability, knowledge output, and error rate.
-
Research KPO: Analyze report completion timelines and quality scores.
-
HR Outsourcing: Track recruitment TAT (Turnaround Time), cost per hire, and satisfaction ratings.
No matter the domain, this Excel template simplifies performance management.
🏆 Advantages of the Outsourcing (BPO KPO) Dashboard in Excel
Using this dashboard brings measurable benefits to organizations and managers alike.
🌟 1. Centralized Data View
View all outsourcing metrics in one place — from project-level details to monthly profitability. No need to open multiple sheets.
📊 2. Instant Performance Insights
Pivot charts and slicers deliver instant clarity on how departments and teams perform, enabling proactive decisions.
💰 3. Cost vs Revenue Tracking
Compare cost and revenue dynamically to identify the most profitable clients and projects.
😊 4. Improved Client Satisfaction
Track feedback scores by region, department, or process to improve client relationships and service quality.
📆 5. Month-to-Month Comparison
Monitor trends and seasonality to anticipate peak workloads or performance dips.
⚡ 6. Simplified Reporting
Generate executive-ready summaries within seconds — ideal for management reviews and client updates.
🧭 Best Practices for Using the Outsourcing Dashboard in Excel
To ensure maximum efficiency and accuracy, follow these best practices:
✅ 1. Maintain Data Consistency
Use uniform naming conventions for clients, departments, and processes. This ensures slicers and charts update correctly.
✅ 2. Update Data Monthly
Keep the Data Sheet current. Regular updates make trend analysis more meaningful.
✅ 3. Track the Right KPIs
Focus on KPIs that truly influence performance — avoid overcrowding the dashboard.
✅ 4. Validate Data Accuracy
Double-check all cost and revenue entries before analysis to avoid skewed results.
✅ 5. Use Conditional Formatting
Highlight low satisfaction scores or high costs visually for better readability.
✅ 6. Backup Regularly
Maintain monthly backups of your dashboard file to track historical trends and avoid accidental loss.
✅ 7. Train Teams
Educate department heads on how to interpret and use dashboard insights effectively.
Who Can Benefit from This Dashboard?
This dashboard isn’t limited to analysts. It’s designed for everyone involved in managing outsourcing operations:
-
Project Managers: To monitor project progress and client satisfaction.
-
Operations Heads: To evaluate departmental profitability.
-
Finance Teams: To compare cost and revenue patterns.
-
Quality Analysts: To analyze feedback scores and improve standards.
-
Business Owners: To gain strategic insights into performance and decision-making.
How to Customize the Dashboard
The dashboard is fully customizable according to your business needs:
-
Add new KPIs or rename existing ones.
-
Modify chart types (bar, pie, area, etc.).
-
Change themes and colors to match your brand.
-
Extend month columns to capture new years.
-
Create region- or client-specific analysis tabs.
All customization can be done within Excel — no special tools required.
💡 Example Insights from the Dashboard
Here are some actionable insights users often derive:
-
“Process A” has 25 % higher costs than “Process B.”
-
Customer satisfaction dips during Q3, suggesting workload strain.
-
Client X projects yield 40 % profit margin, making them high-priority.
-
Department Y consistently delays projects, requiring resource balancing.
These data-driven insights enable smarter planning and improved operational control.
🧾 Step-by-Step Guide: Using the Dashboard Effectively
-
Download Template: Start with the ready-to-use Outsourcing Dashboard in Excel.
-
Enter Data: Fill in client, project, and financial details.
-
Refresh Pivots: Click Refresh All to update charts.
-
Use Slicers: Filter by month, department, or client.
-
Analyze Pages: Navigate through Overview, Department, Project, Process, and Month Analysis.
-
Export Reports: Save filtered reports as PDFs for presentations.
🧮 Data Management Tips
-
Keep numeric values formatted (USD for cost/revenue).
-
Use data validation to restrict invalid entries.
-
Apply Excel’s Table Feature for dynamic range expansion.
-
Protect formula cells to prevent accidental edits.
These tips help maintain dashboard integrity over time.
🧠 Real-World Example Scenario
Let’s imagine a KPO firm handling market research and analytics projects for multiple clients.
-
In July, revenue increased 20 %, but profit dropped 8 %.
-
The Department Analysis revealed the “Research” department exceeded budget due to extra revisions.
-
The Process Analysis page highlighted high costs in “Survey Data Cleaning.”
By identifying these trends, management re-allocated resources, renegotiated contracts, and achieved a 12 % cost reduction in August.
That’s the real power of the Outsourcing Dashboard in Excel — transforming raw numbers into clear business actions.
🏁 Conclusion
The Outsourcing (BPO KPO) Dashboard in Excel bridges the gap between data and decision-making. By integrating financial, operational, and satisfaction metrics into one dynamic file, it empowers businesses to analyze performance, enhance client relations, and maximize profit — all without complex tools or coding.
Whether you’re managing call centers, analytics projects, or finance BPO operations, this Excel dashboard offers an all-in-one analytical solution for smart outsourcing management.
❓ Frequently Asked Questions (FAQs)
1️⃣ What is the purpose of the Outsourcing (BPO KPO) Dashboard in Excel?
It helps outsourcing companies track performance, cost, revenue, and satisfaction metrics in a single, interactive Excel file.
2️⃣ Can I customize the KPIs in the dashboard?
Yes, you can easily modify KPIs, formulas, and visuals to fit your business needs.
3️⃣ Do I need Excel macros to use this dashboard?
No. The dashboard works through standard Excel functions, pivot tables, and slicers — no VBA needed.
4️⃣ How often should I update the data?
Monthly updates are ideal for accurate trend and performance tracking.
5️⃣ Is the dashboard suitable for both BPO and KPO operations?
Absolutely. The dashboard is designed for both transaction-based (BPO) and knowledge-based (KPO) processes.
6️⃣ Can this dashboard be shared with clients?
Yes, you can export reports as PDFs or share the Excel file via cloud or email.
7️⃣ What Excel version is required?
Microsoft Excel 2016 or later is recommended for full compatibility with slicers and pivot charts.
Visit our YouTube channel to learn step-by-step video tutorials