In today’s fast-paced healthcare world, hospitals must track performance, measure patient satisfaction, and ensure cost efficiency. Manual reporting can be time-consuming and prone to error — which is why modern hospitals rely on analytics dashboards.
The Hospitals Dashboard in Excel is a ready-to-use solution designed for healthcare administrators, finance teams, and quality departments. It turns hospital data into visual insights that support better decision-making.
Let’s explore what this dashboard is, how it works, and how it can revolutionize healthcare data management.
Click to Purchases Hospitals Dashboard in Excel
What Is a Hospitals Dashboard in Excel?
A Hospitals Dashboard in Excel is an interactive analytical tool that helps healthcare professionals track key performance indicators (KPIs) related to hospital operations, patient outcomes, and financial performance.
It provides a single-window view of everything that matters — from patient recovery rates to departmental profits. Built in Microsoft Excel, it requires no additional software, making it both accessible and customizable for any hospital or clinic.
🎯 Purpose of the Dashboard
The main goal of this dashboard is to simplify hospital performance tracking by offering real-time insights through charts, cards, and filters.
With this template, users can:
-
Monitor treatment costs, insurance coverage, and discounts.
-
Evaluate patient satisfaction and recovery percentages.
-
Analyze profitability across departments, hospitals, and branches.
-
Compare performance trends month-over-month.
Structure of the Hospitals Dashboard in Excel
The Hospitals Dashboard is thoughtfully structured with five main analytical pages and two supporting sheets. Each page offers a different perspective on hospital data to ensure complete visibility into performance and operations.
📘 Support Sheets
Before we dive into the analytical pages, it’s important to mention two key backend sheets:
-
Data Sheet:
This is the foundation of the dashboard where all hospital data is stored. It includes information such as patient details, departments, costs, profits, insurance coverage, and more. The dashboard automatically updates charts and metrics based on this data. -
Support Sheet:
Contains drop-down lists, formulas, and other backend elements required for data validation, calculations, and interactivity across sheets.
Pages of the Hospitals Dashboard
The dashboard consists of five interactive analytical pages that make it easier to explore hospital data from different dimensions — Overview, Department, Hospital, Branch, and Month analysis.
Each page includes a right-side slicer panel for easy filtering by criteria such as department, hospital name, month, and payment method.
Let’s explore each one in detail.
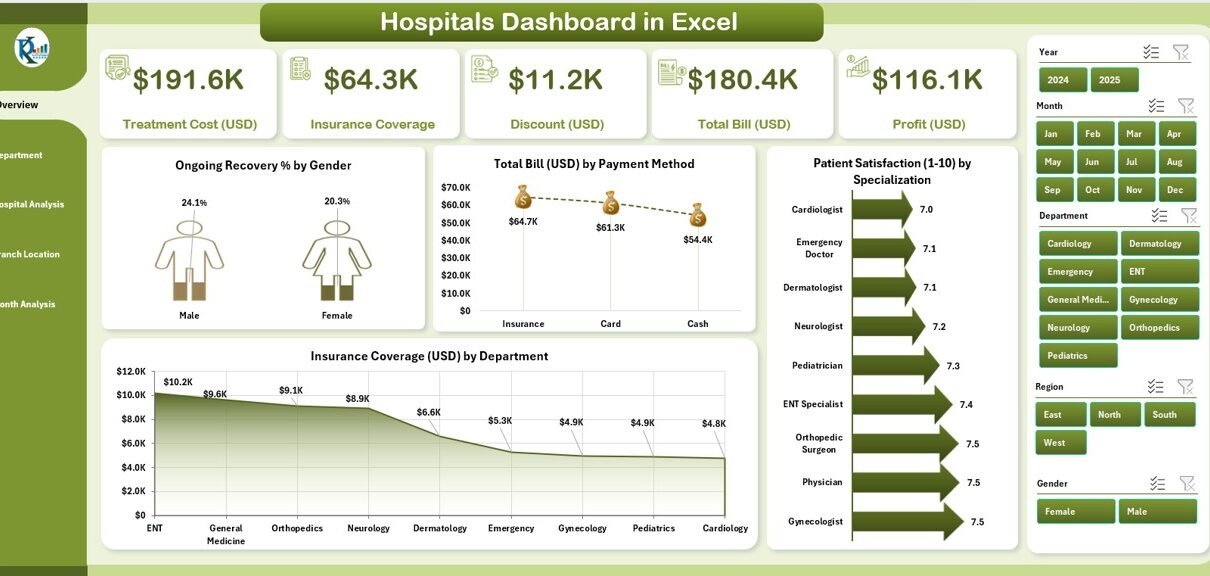
1️⃣ Overview Page
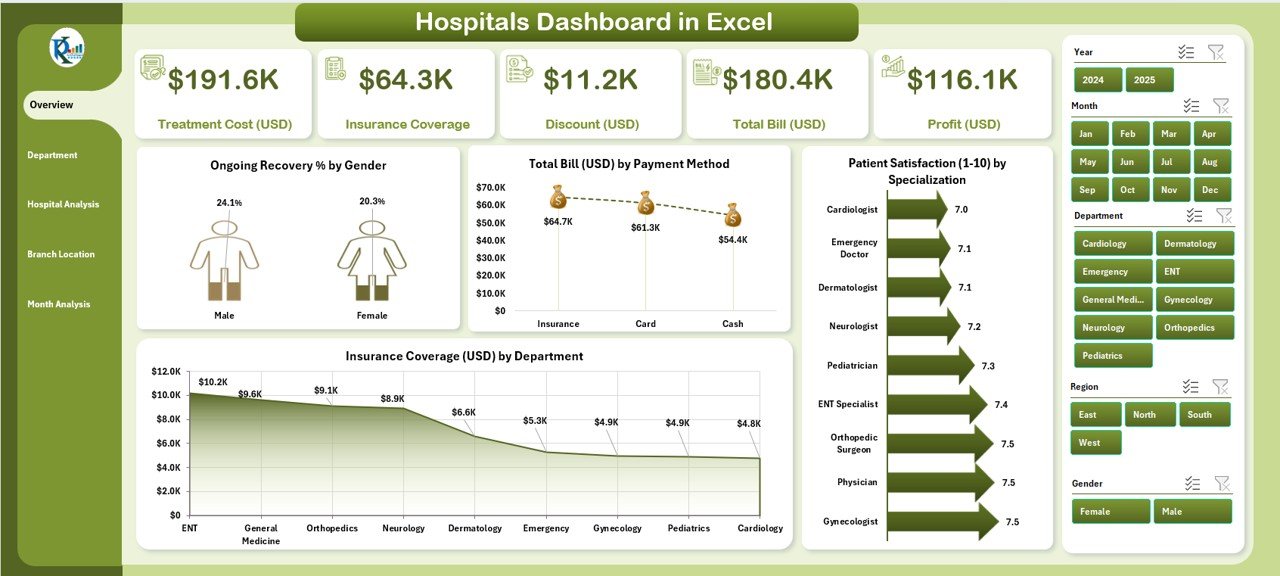
The Overview Page acts as the command center of the dashboard.
Key Components:
-
Page Navigator: Located on the left side for easy access to all other pages.
-
Slicers: Positioned on the right side, enabling users to filter data dynamically.
-
Five Summary Cards: Displaying high-level KPIs such as total treatment cost, total profit, average patient satisfaction, ongoing recovery %, and total insurance coverage.
Charts on this Page:
-
Ongoing Recovery % by Gender: Analyzes recovery trends between male and female patients.
-
Total Bill (USD) by Payment Method: Shows how patients are paying — cash, card, or insurance.
-
Patient Satisfaction (1-10) by Specialization: Evaluates satisfaction levels across specializations.
-
Insurance Coverage (USD) by Department: Highlights how much insurance covers per department.
This page offers a comprehensive view of hospital performance at a glance.
2️⃣ Department Analysis
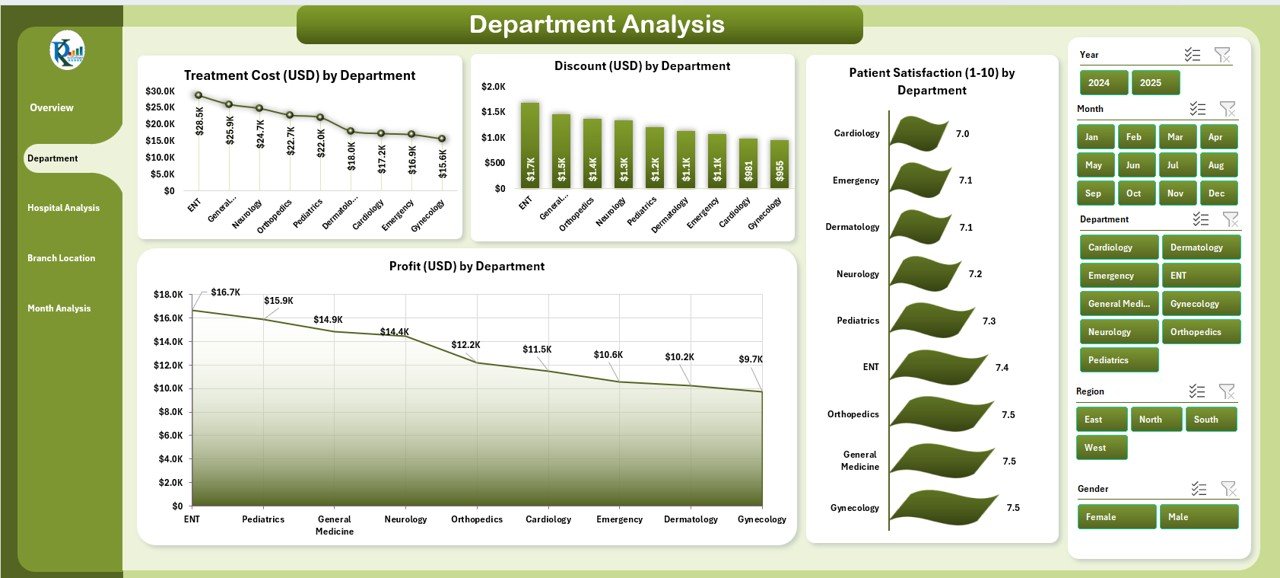
The Department Analysis Page breaks down performance by each medical department — such as Cardiology, Neurology, Pediatrics, and Orthopedics.
Key Components:
-
Right-side slicer for quick filtering by department or month.
-
Department-wise KPIs to identify strong and weak areas.
Charts on this Page:
-
Treatment Cost (USD) by Department: Compares departmental expenditure.
-
Discount (USD) by Department: Displays promotional or negotiated discounts.
-
Patient Satisfaction (1-10) by Department: Measures service quality and care experience.
-
Profit (USD) by Department: Reveals which departments contribute most to profitability.
This section helps management make informed decisions about resource allocation and performance improvement.
3️⃣ Hospital Analysis
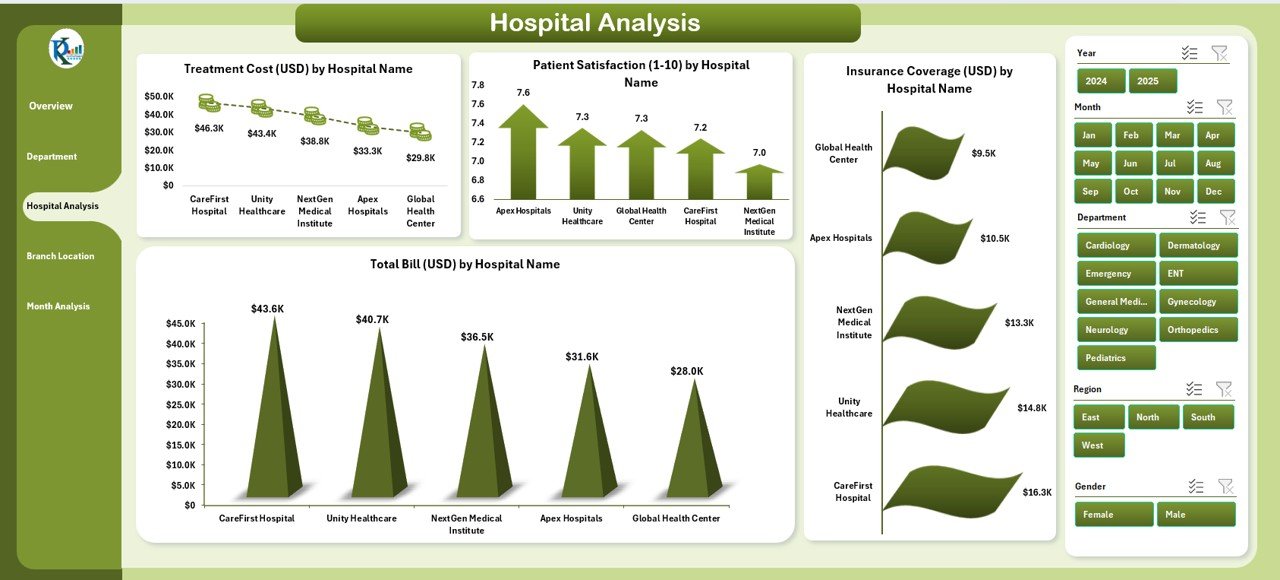
The Hospital Analysis Page provides insights when an organization operates multiple hospitals or units.
Charts on this Page:
-
Treatment Cost (USD) by Hospital Name: Identifies which hospital incurs the highest treatment costs.
-
Patient Satisfaction (1-10) by Hospital Name: Evaluates service quality across different branches.
-
Insurance Coverage (USD) by Hospital Name: Tracks how insurance is utilized per facility.
-
Total Bill (USD) by Hospital Name: Measures overall billing volume by institution.
This page is ideal for multi-hospital organizations or healthcare networks that need to monitor performance at multiple locations.
4️⃣ Branch Location Analysis
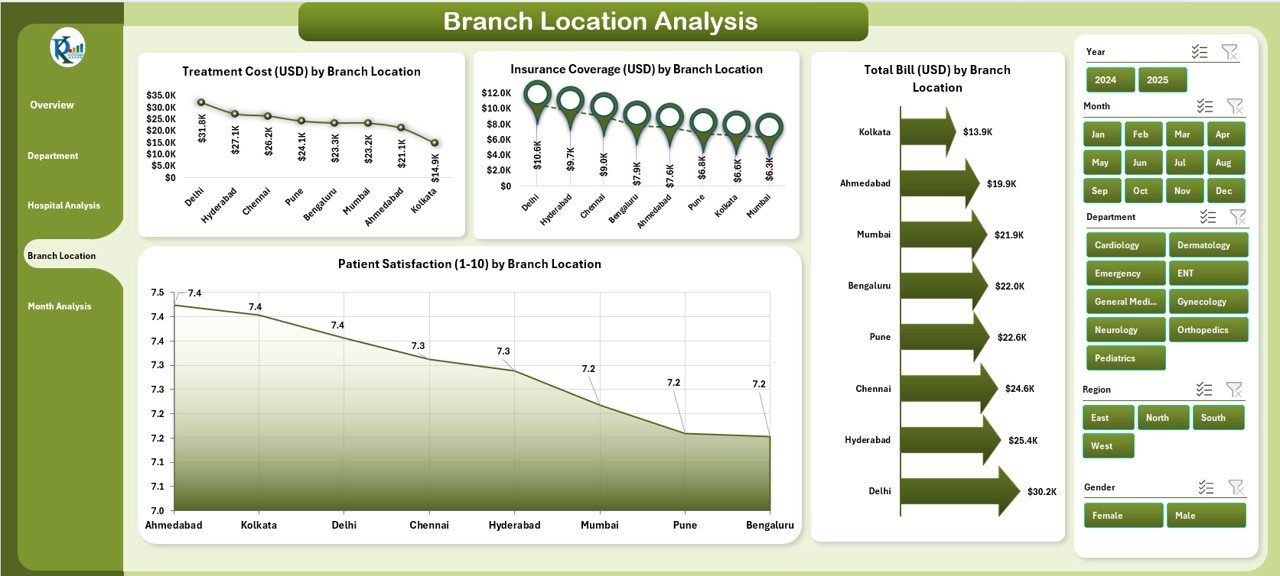
The Branch Location Analysis Page focuses on geographic performance.
Click to Purchases Hospitals Dashboard in Excel
Charts on this Page:
-
Treatment Cost (USD) by Branch Location
-
Patient Satisfaction (1-10) by Branch Location
-
Insurance Coverage (USD) by Branch Location
-
Total Bill (USD) by Branch Location
This helps administrators understand regional performance trends and identify where costs, profits, or satisfaction levels differ.
It’s particularly useful for hospital chains with multiple branches in different cities or countries.
5️⃣ Month Analysis
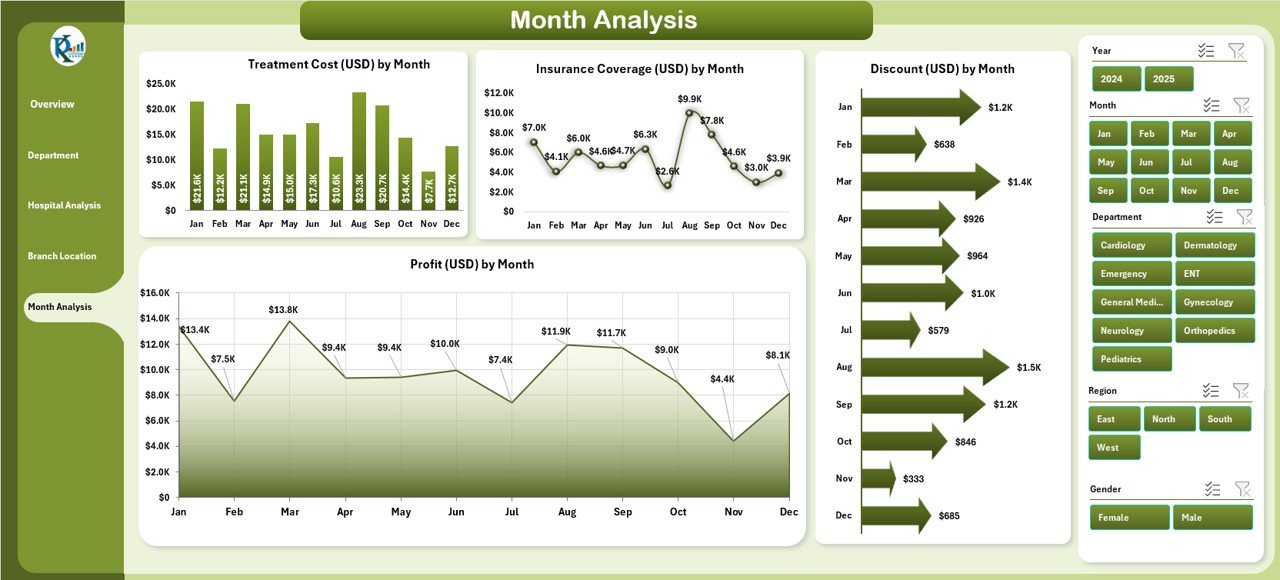
The Month Analysis Page helps track trends over time — providing clarity on performance throughout the year.
Charts on this Page:
-
Treatment Cost (USD) by Month
-
Insurance Coverage (USD) by Month
-
Discount (USD) by Month
-
Profit (USD) by Month
With this monthly perspective, hospitals can quickly detect seasonal variations, cost surges, or improvements in efficiency.
💡 Why Hospitals Need a Dashboard in Excel
A well-designed Excel dashboard transforms raw healthcare data into actionable insights.
Here’s why hospitals need one:
-
✅ Instant Insights: No need to dig through multiple spreadsheets — view everything in one place.
-
✅ Better Decision-Making: Data visualization helps identify trends and anomalies quickly.
-
✅ Increased Efficiency: Automates calculations and updates, saving hours of manual work.
-
✅ Cost-Effective: Uses Microsoft Excel — no expensive software or licenses required.
-
✅ Customizable: Easy to modify KPIs, charts, and layouts to match hospital needs.
-
✅ Data Transparency: Enables clear communication among departments and management.
🧮 Key Performance Indicators (KPIs) Tracked
This Hospitals Dashboard in Excel tracks a wide range of KPIs that represent financial, operational, and patient-centric metrics.
Common KPIs Include:
-
Treatment Cost (USD)
-
Total Bill (USD)
-
Insurance Coverage (USD)
-
Patient Satisfaction (1-10)
-
Ongoing Recovery %
-
Profit (USD)
-
Discount (USD)
-
Number of Patients
-
Average Treatment Time
-
Bed Occupancy Rate (%)
Tracking these KPIs helps hospitals maintain operational excellence and patient care quality.
🌟 Advantages of Hospitals Dashboard in Excel
The benefits of using this Excel-based dashboard are numerous.
1. Centralized Information
All hospital data — from patient satisfaction to revenue — is available in one interactive file.
2. Time Savings
Automation and pre-built charts eliminate repetitive reporting tasks.
3. Data Accuracy
Reduces human error by using formulas and structured data inputs.
4. Visual Storytelling
Charts and color-coded visuals make it easy to interpret performance trends.
5. Real-Time Decision-Making
Interactive slicers allow instant filtering and insights on demand.
6. No Technical Skills Required
Built entirely in Excel, anyone familiar with spreadsheets can use it easily.
7. Scalability
Works for single hospitals as well as multi-location healthcare groups.
8. Cost-Efficiency
Provides premium analytics without the cost of enterprise software.
🧭 Opportunities for Improvement
Even though this Excel dashboard is robust, there’s always room for enhancement.
Potential Areas to Upgrade:
-
Automated Data Import: Link directly to patient management or billing systems.
-
Enhanced Visualization: Add more dynamic charts using Power Query or Power Pivot.
-
Mobile Optimization: Convert the dashboard into a Power BI version for on-the-go viewing.
-
Predictive Analytics: Incorporate forecasting models to anticipate future patient trends.
-
Integration with Cloud Storage: Use SharePoint or OneDrive for real-time collaboration.
These improvements can make the Hospitals Dashboard even more powerful and future-ready.
🧠 Best Practices for the Hospitals Dashboard in Excel
To get the most value from this dashboard, follow these best practices:
-
Keep Data Updated:
Regularly refresh your data to maintain accuracy and relevance. -
Use Consistent Formatting:
Ensure that date, currency, and number formats remain uniform across sheets. -
Define Clear KPI Ownership:
Assign specific departments to monitor particular KPIs (e.g., Finance for profit, HR for satisfaction). -
Leverage Slicers Wisely:
Use slicers to filter insights by gender, department, or month without cluttering the view. -
Validate Data Inputs:
Utilize Excel’s Data Validation features to prevent incorrect entries. -
Use Conditional Formatting:
Highlight top-performing or underperforming areas automatically. -
Protect the Structure:
Lock formula cells to prevent accidental editing. -
Backup Regularly:
Store a backup copy to avoid data loss due to overwriting or errors.
Following these steps ensures smooth functioning and maximum accuracy of your Hospitals Dashboard.
Click to Purchases Hospitals Dashboard in Excel
How to Use the Hospitals Dashboard in Excel
Using this template is simple:
-
Open the Excel File: No installation or setup required.
-
Go to the Data Sheet: Enter or paste your hospital data.
-
Navigate Using Page Navigator: Jump between pages easily.
-
Filter Data with Slicers: Choose month, department, or hospital.
-
View Real-Time Insights: The charts, cards, and metrics will update automatically.
That’s it! In just a few minutes, you can visualize complex hospital performance data.
Who Can Use This Dashboard?
This dashboard is ideal for:
-
Hospital Administrators — to monitor operations and costs.
-
Finance Teams — to analyze billing, discounts, and profitability.
-
Quality Assurance Teams — to track patient satisfaction and recovery rates.
-
Department Heads — to assess performance and manage budgets.
-
Consultants and Analysts — to evaluate overall hospital efficiency.
Whether you manage a single hospital or a large healthcare group, this Excel template is a perfect fit.
🧭 Real-World Use Case
Imagine a hospital chain with five branches. Each branch updates the Data Sheet weekly with patient numbers, costs, and satisfaction scores.
Within seconds, the Excel dashboard consolidates all the information, showing management which branch performs best and where cost leakages exist.
This real-time transparency helps the leadership team take proactive steps — such as increasing discounts in low-satisfaction branches or rewarding departments with top recovery rates.
🧩 Integration Possibilities
The Hospitals Dashboard can integrate with other systems to expand its functionality:
-
Microsoft Power BI: For deeper analytics and real-time dashboards.
-
Google Sheets: For cloud collaboration across teams.
-
ERP or HIS systems: For automated data synchronization.
-
Power Automate or VBA: To automate repetitive tasks like data refresh.
These integrations can elevate the dashboard from a static report to a dynamic decision-support tool.
🧾 Conclusion
The Hospitals Dashboard in Excel is more than just a spreadsheet — it’s a comprehensive healthcare analytics solution.
With powerful visuals, interactive slicers, and structured data tracking, it helps hospital administrators, finance managers, and medical directors gain complete visibility into their organization’s performance.
Whether you want to track treatment costs, evaluate patient satisfaction, or compare profitability across branches, this dashboard delivers actionable insights — instantly and affordably.
If you’re looking to improve your hospital’s performance management process, the Hospitals Dashboard in Excel from NextGenTemplates.com is your all-in-one solution.
❓ Frequently Asked Questions (FAQs)
1️⃣ What is the purpose of a Hospitals Dashboard in Excel?
It provides a centralized platform to monitor hospital performance through visual KPIs and charts, helping administrators make data-driven decisions.
2️⃣ How can I customize this dashboard?
You can modify charts, KPIs, and slicers based on your hospital’s specific requirements. All elements are editable in Excel.
3️⃣ Does this dashboard require advanced Excel skills?
No. It’s fully user-friendly. Basic Excel knowledge is enough to navigate and update data.
4️⃣ Can this dashboard be used for multiple hospitals?
Yes. It supports multi-hospital data analysis using slicers for Hospital Name and Branch Location.
5️⃣ Is there any automation included?
Yes. All calculations, charts, and visual updates happen automatically once you update the data.
6️⃣ Can I share this dashboard with my team?
Absolutely. You can share the Excel file via email or cloud storage like OneDrive or Google Drive.
7️⃣ How often should I update the data?
It’s best to update weekly or monthly for accurate performance monitoring.
8️⃣ Can I integrate this dashboard with other tools?
Yes. It can integrate with Power BI, Google Sheets, or ERP systems using connectors or manual data export/import.
Visit our YouTube channel to learn step-by-step video tutorials