Running an Agri Tech startup is not easy. The industry moves fast, farming seasons change quickly, and teams must track dozens of performance indicators every month. Because of this, many founders, analysts, and operations managers struggle to maintain clarity across operations. However, when you use a KPI Dashboard in Power BI, you get a simple and powerful way to monitor your business and make smart decisions.
In this article, you will explore everything about the Agri Tech Startups KPI Dashboard in Power BI. I will explain its structure, features, benefits, best practices, and the entire working process. You will also see how Agri Tech companies can use KPIs to improve productivity, reduce wastage, and increase profits.
Let’s start the complete guide.
Click to Purchases Agri Tech Startups KPI Dashboard in Power BI
What Is an Agri Tech Startups KPI Dashboard in Power BI?
An Agri Tech Startups KPI Dashboard in Power BI is a ready-to-use performance monitoring tool built inside Power BI. It collects data from an Excel sheet and converts all essential metrics into clean charts, tables, and visuals. As a result, you get a clear view of your business performance without switching between multiple spreadsheets.
This dashboard includes:
-
A Summary Page
-
A KPI Trend Page
-
A KPI Definition Page
Each page helps you track different parts of your Agri Tech business such as crop yield, logistics, farmer onboarding, product performance, sales, operations, and customer success.
Because Power BI updates the visuals in real time, you make faster decisions, identify risks, and see growth opportunities immediately.
Why Agri Tech Startups Need a KPI Dashboard
Before we understand the dashboard, we need to understand why Agri Tech startups must track KPIs.
Agri Tech companies deal with:
-
Seasonal demand
-
Weather-based disruptions
-
Large datasets
-
Multiple products and services
-
Farmer engagement
-
Supply chain complexity
-
Technology adoption in rural areas
Because of these challenges, the leadership team needs a tool that shows real performance at a glance. A KPI dashboard does exactly that. It reduces confusion, increases visibility, and improves operational discipline.
https://nextgentemplates.com/product/agri-tech-startups-kpi-dashboard-in-power-bi/
Key Features of the Agri Tech Startups KPI Dashboard in Power BI
Let’s explore the most important part now — the main features of this dashboard. I have rewritten the information you provided for clarity, simplicity, and smooth flow.
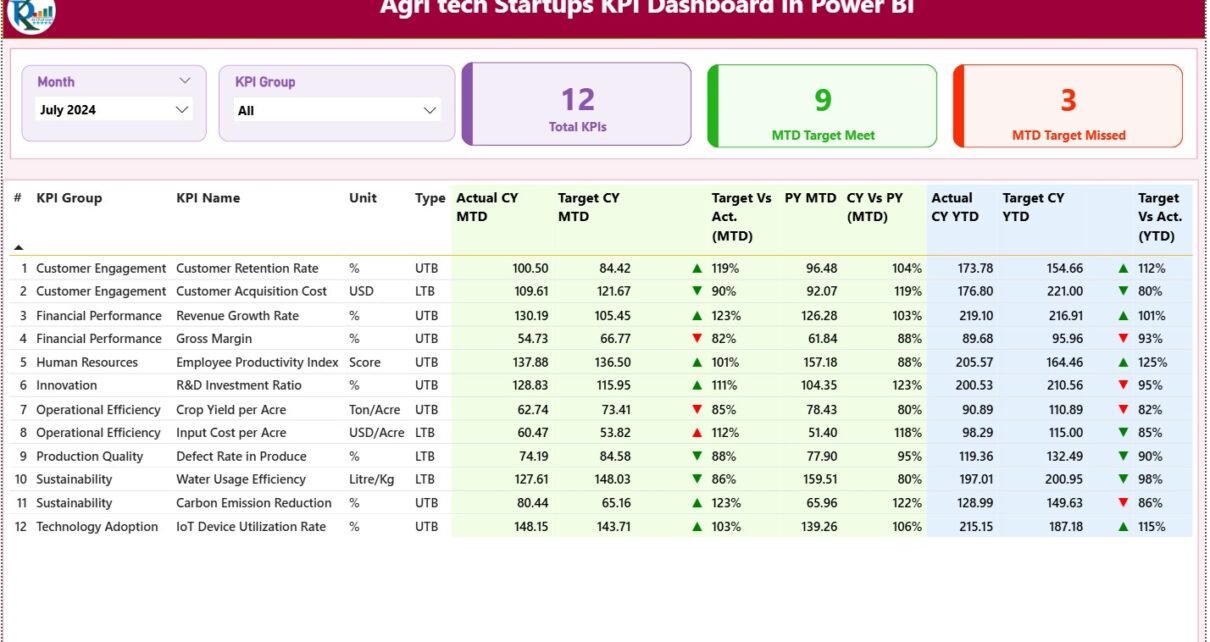
1. Summary Page – Your Main Performance View
The Summary Page works as the heart of the dashboard. It shows all important KPI values in one place so you can understand your performance instantly.
What You See on the Summary Page
✔ Month Slicer – Choose the month you want to analyze
✔ KPI Group Slicer – Filter KPIs by category such as operations, farmer engagement, sales, yield, etc.
✔ Cards for Quick Insights
-
Total KPI Count
-
MTD (Month-to-Date) Target Met Count
-
MTD Target Missed Count
These cards give you a quick snapshot of your startup’s health.
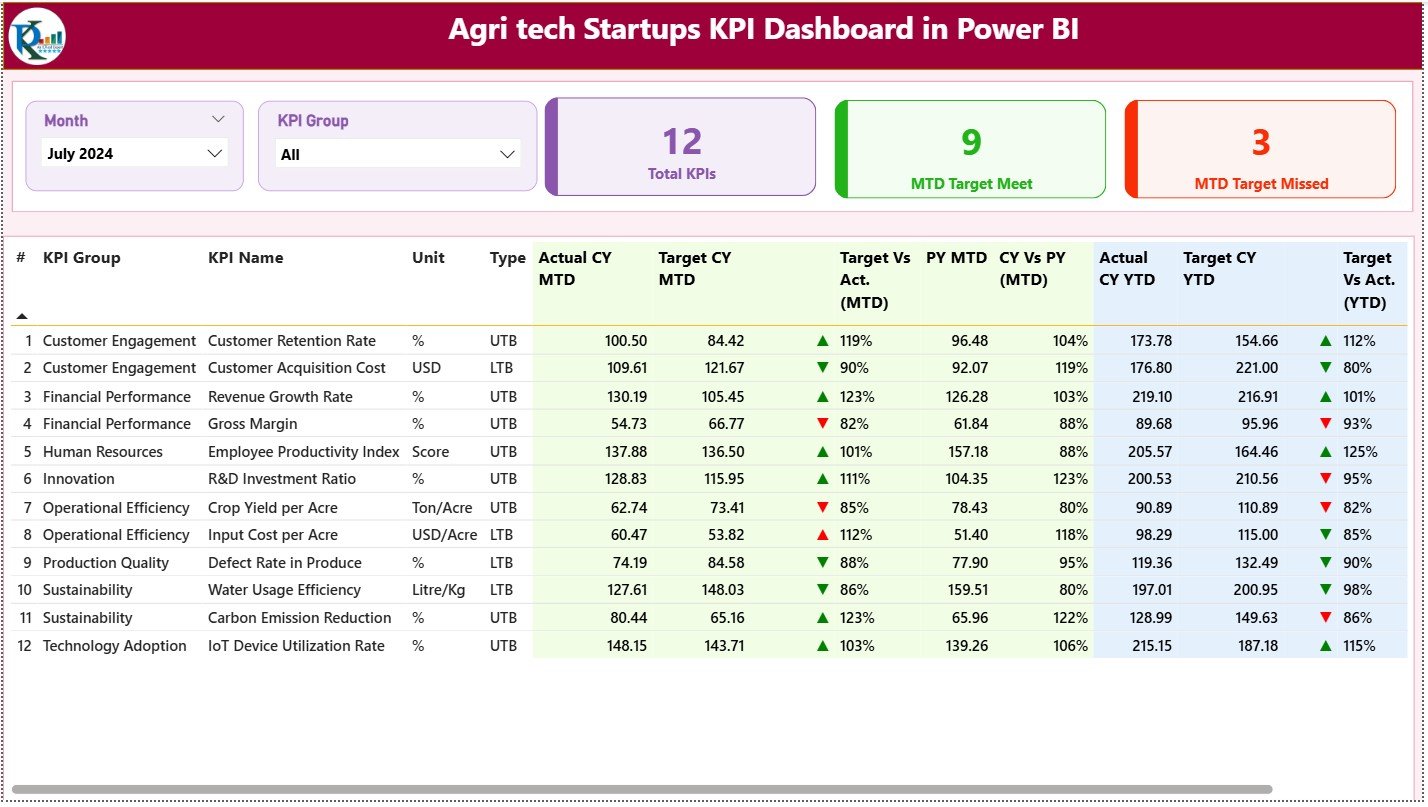
Detailed KPI Table
Below the slicers and cards, you get a detailed KPI table. This is the most important part of the dashboard because you track complete MTD and YTD performance with simple visuals.
The table includes:
-
KPI Number – Sequence of the KPI
-
KPI Group – Category such as Sales, Operations, Logistics
-
KPI Name – Full name of the metric
-
Unit – Measurement unit
-
Type – LTB (Lower the Better) or UTB (Upper the Better)
-
Actual CY MTD – Current Month-To-Date value
-
Target CY MTD – Target for the month
-
MTD Icon – Green ▲ for met, Red ▼ for missed
-
Target vs Actual MTD % – (Actual ÷ Target)
-
PY MTD – Previous Year MTD value
-
CY vs PY (MTD) – Performance growth percentage
-
Actual CY YTD – Current Year Year-To-Date value
-
Target CY YTD – YTD target
-
YTD Icon – Visual indicator of performance
-
Target vs Actual YTD %
-
PY YTD – Previous Year YTD
-
CY vs PY (YTD)
This structure helps you compare performance across months, years, and KPI groups.
2. KPI Trend Page – Track Growth Over Time
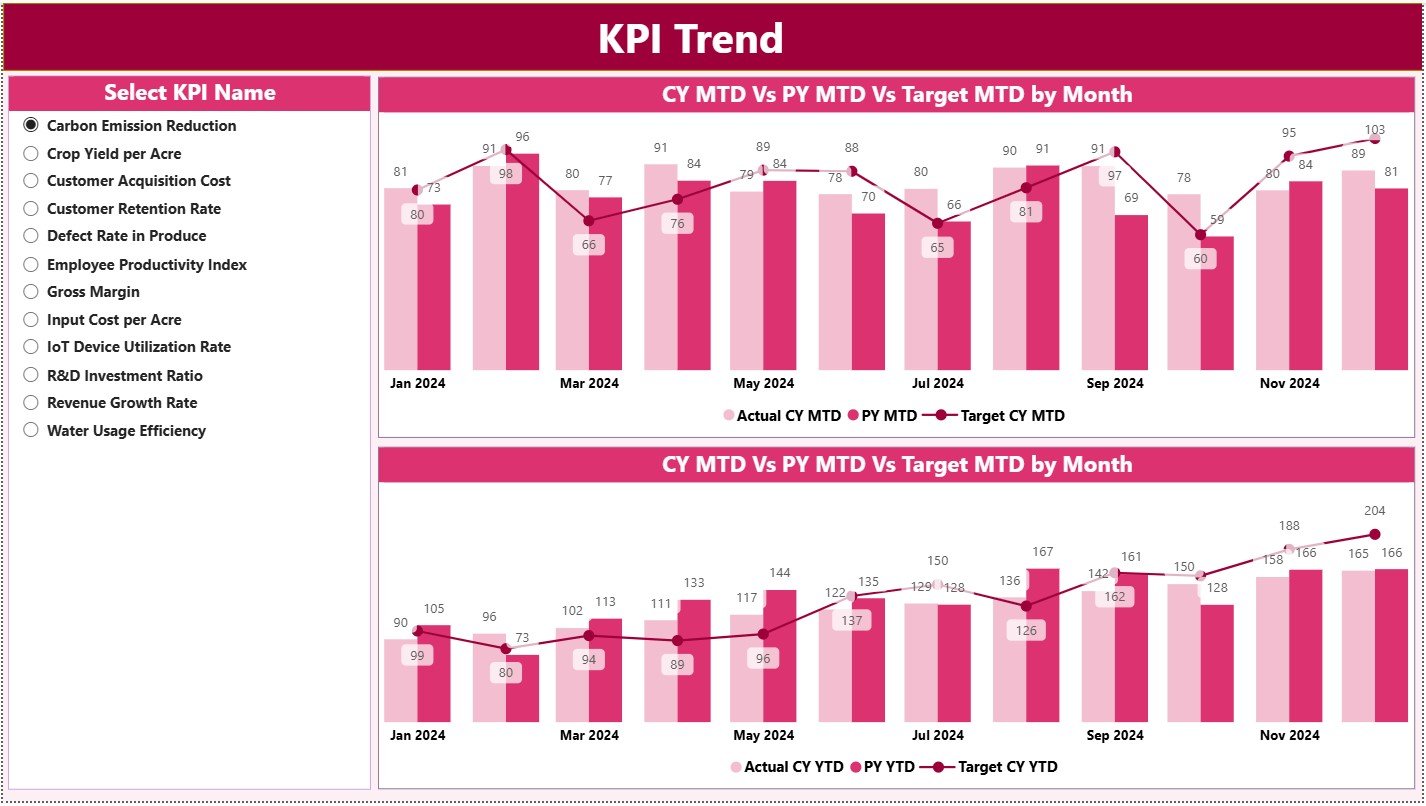
The KPI Trend page helps you understand how each KPI changes month after month.
What You See on This Page
-
A slicer for KPI Name
-
Two Combo Charts
-
Actual Current Year vs Previous Year vs Target (MTD)
-
Actual Current Year vs Previous Year vs Target (YTD)
-
Because of these charts, you easily track improvements, drops, or inconsistencies in KPIs like:
-
Crop yield
-
Delivery turnaround time
-
Sensor device performance
-
Soil testing count
-
Farmer onboarding rate
-
Subscription renewal rate
The trend page is useful for performance review meetings and strategy planning.
Click to Purchases Agri Tech Startups KPI Dashboard in Power BI
3. KPI Definition Page – Clear KPI Understanding
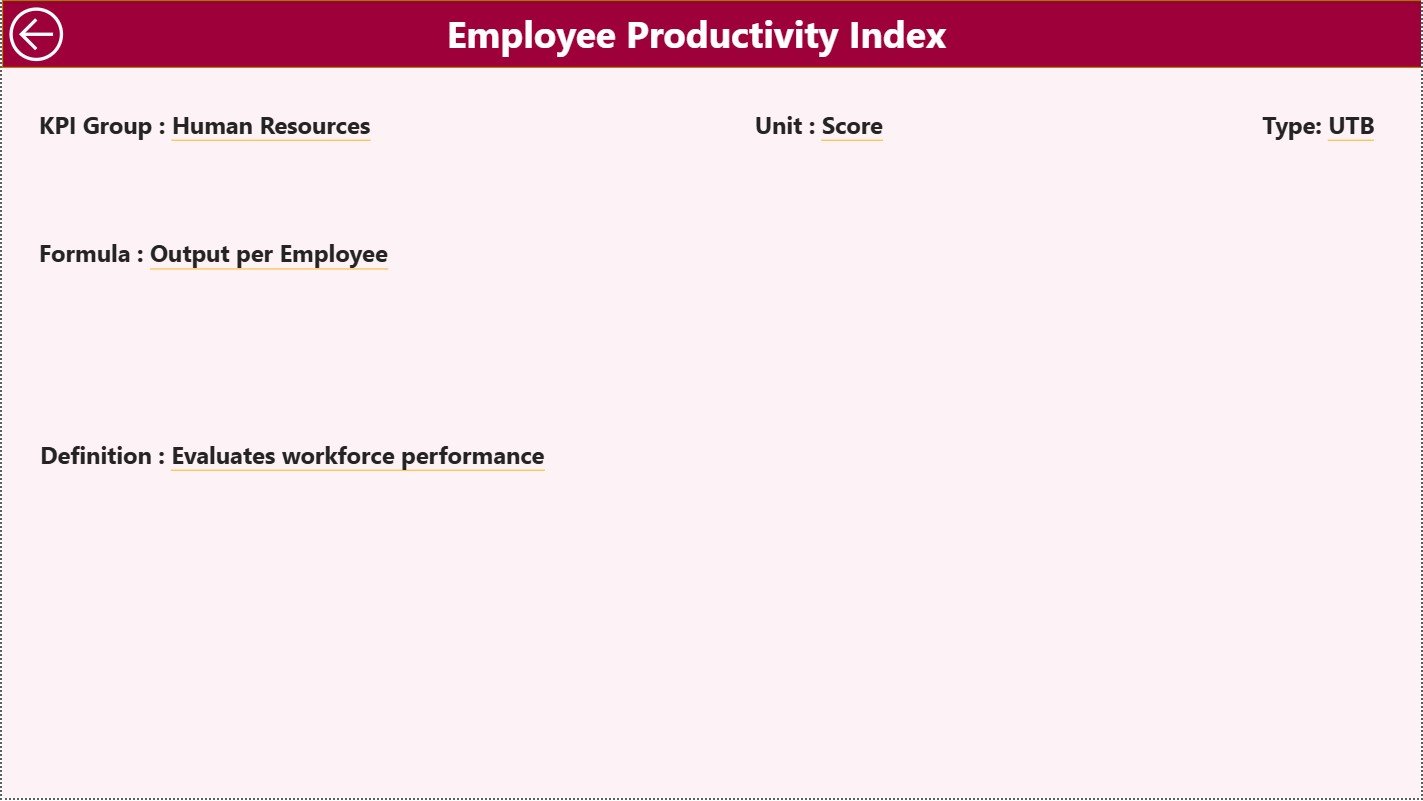
This page is hidden, but you can open it using drill-through from the Summary Page.
What You See on the KPI Definition Page
-
KPI Number
-
KPI Group
-
KPI Name
-
Unit
-
Type (LTB or UTB)
-
Formula
-
Detailed Definition
Because of this page, every team member understands the KPI meaning correctly. It also removes confusion during reporting.
How the Excel Data Source Works in This Dashboard
This dashboard uses an Excel file as the data source. You get three worksheets inside the file.
1. Input_Actual Sheet
Fill the following fields:
-
KPI Name
-
Month (use the first date of the month)
-
MTD Actual
-
YTD Actual
Because the entry format remains consistent, Power BI updates visuals perfectly.
2. Input_Target Sheet
Fill:
-
KPI Name
-
Month
-
MTD Target
-
YTD Target
Power BI compares this data with actual numbers and calculates the performance score.
3. KPI Definition Sheet
Fill:
-
KPI Number
-
KPI Group
-
KPI Name
-
Unit
-
Formula
-
Definition
-
Type (LTB or UTB)
Because KPI definitions are well-organized, the dashboard becomes easier to maintain.
Advantages of Agri Tech Startups KPI Dashboard in Power BI
Let’s look at the major benefits your startup gets.
1. Real-Time Performance Insights
You see all KPIs in real time. As soon as data changes in Excel, the dashboard updates. This helps you take immediate action when performance drops.
2. Better Decision Making
When you compare actual and target values, you understand what is working and what needs improvement. This clarity improves your decisions.
3. Simple Visuals for Complex Operations
Agri Tech operations involve many moving parts. Because Power BI converts data into charts and icons, even non-technical people understand performance easily.
4. Faster Reporting and Review Meetings
Teams no longer scroll through Excel sheets during meetings. You simply open the dashboard and view clean visuals.
5. Strong Focus on Growth and Efficiency
The dashboard highlights KPI gaps. As a result, your team focuses on improvement rather than guesswork.
6. Easy Tracking of Seasonal and Yearly Trends
Agriculture is seasonal. With the KPI Trend page, you track seasonal performance patterns and plan better.
7. Improved Operational Control
From logistics to farming cycles to customer support, everything becomes measurable. Because of this, your startup builds a performance-driven culture.
Click to Purchases Agri Tech Startups KPI Dashboard in Power BI
Best Practices for Using the Agri Tech Startups KPI Dashboard in Power BI
To get the most value from the dashboard, follow these best practices.
1. Keep KPI Definitions Clear and Updated
Update KPI definitions regularly. Avoid complex formulas. Keep names simple.
2. Enter Data Correctly in Excel
Use consistent date formats. Fill all fields. Do not leave gaps. Correct data leads to correct visuals.
3. Review Performance Every Week
Do a weekly review. Because weekly analysis highlights early issues, you solve problems faster.
4. Use LTB and UTB Properly
Mark each KPI correctly:
- LTB (Lower the Better) – Cost per delivery, defect rate
- UTB (Upper the Better) – Yield, output, farmer onboarding
This ensures icons display correctly.
5. Compare Current Year and Previous Year
Use PY MTD and PY YTD values. These values show if your startup is improving or going backward.
6. Keep Dashboard Layout Simple
Avoid unnecessary visuals. Keep the dashboard clean. Simple layouts improve understanding.
7. Train Your Team
Train employees to read KPIs. When the team understands metrics, performance improves naturally.
How Agri Tech Startups Can Use This Dashboard in Daily Operations
Here are practical applications of the dashboard:
-
Track farmer onboarding progress
-
Monitor performance of IoT devices
-
Measure sensor accuracy levels
-
Evaluate crop yield patterns
-
Track delivery and logistics performance
-
Monitor app installations and usage
-
Compare demand across regions
-
Manage inventory, seeds, and fertilizers
-
Understand customer behavior
-
Track revenue and cost KPIs
Because the dashboard is customizable, you can add more KPIs anytime.
Conclusion
The Agri Tech Startups KPI Dashboard in Power BI is a powerful, ready-to-use solution for tracking performance in a fast-changing industry. This dashboard brings clarity, accuracy, and speed to decision making. It allows startup founders, analysts, and operations teams to see the complete business picture in minutes.
Because the dashboard organizes KPIs into Summary, Trend, and Definition pages, you get a structured view of performance. When combined with proper data entry and best practices, this dashboard becomes a long-term growth partner for any Agri Tech business.
If you want to run your operations smoothly, reduce risks, and increase growth, this dashboard is the perfect tool.
Click to Purchases Agri Tech Startups KPI Dashboard in Power BI
Frequently Asked Questions (FAQs)
1. What is the Agri Tech Startups KPI Dashboard in Power BI?
It is a ready-to-use Power BI dashboard that helps Agri Tech startups track all major KPIs through clean visuals, charts, and tables using Excel data.
2. Does this dashboard require coding skills?
No. You do not need coding knowledge. You only update the Excel sheets, and Power BI handles the visuals.
3. How often should I update the data?
You should update the data weekly or monthly depending on your operations. Regular updates give accurate insights.
4. Can I add new KPIs to the dashboard?
Yes. You can add new KPIs by updating the KPI Definition sheet and adjusting the visuals.
5. Who can use this dashboard?
Founders, analysts, operations teams, growth teams, and investors can use it. It suits any Agri Tech startup.
6. Can I track both MTD and YTD values?
Yes. The dashboard shows complete Month-To-Date and Year-To-Date numbers along with icons and comparison charts.
7. Is the dashboard customizable?
Yes. You can customize all pages, visuals, and formulas according to your business needs.
Click to Purchases Agri Tech Startups KPI Dashboard in Power BI
Visit our YouTube channel to learn step-by-step video tutorials
Watch the step-by-step video tutorial: