The startup world grows fast, and founders need clear insights to make smart decisions. Yet, most teams struggle because their data stays scattered or difficult to understand. When this happens, decision-making slows down, investors lose confidence, and growth becomes difficult. That is why many founders and business analysts use the Aristech Startups Dashboard in Excel.
This dashboard brings all essential startup data into one simple and clean view. It shows funding, revenue, industry trends, startup stages, valuation, regional insights, and month-wise performance. Since the layout is smooth and the visuals update automatically, users manage their startup data with confidence.
In this detailed guide, you will learn what the Aristech Startups Dashboard offers, how each page works, and why it is a powerful tool for founders, investors, and analysts. You will also explore the advantages, best practices, and frequently asked questions.
Click to Purchases Aristech Startups Dashboard in Excel
What Is the Aristech Startups Dashboard in Excel?
The Aristech Startups Dashboard in Excel is a ready-to-use analytical tool that helps you track growth, funding, revenue, valuation, and startup performance. The dashboard includes multiple charts, slicers, filters, and cards that show important KPIs in a simple and visually clear structure.
Because everything is built in Excel, you do not need advanced technical skills. You can update your data sheet, and the dashboard will refresh automatically. It becomes a central hub for understanding your startup ecosystem without using expensive tools or complex software.
This dashboard works great for:
-
Startup founders
-
Business consultants
-
Angel investors & venture capital teams
-
Financial analysts
-
Startup incubators & accelerators
-
Students and researchers
It helps you understand patterns, identify risks, compare performance across categories, and make better decisions with real-time insights.
Key Features of the Aristech Startups Dashboard in Excel
You get access to multiple analytical pages, each designed for a specific purpose. Since the page navigator sits on the left side, you can move between pages easily. The dashboard includes cards, filters, and interactive charts that respond quickly to user selections.
Below is the complete breakdown of all five pages you included in the dashboard.
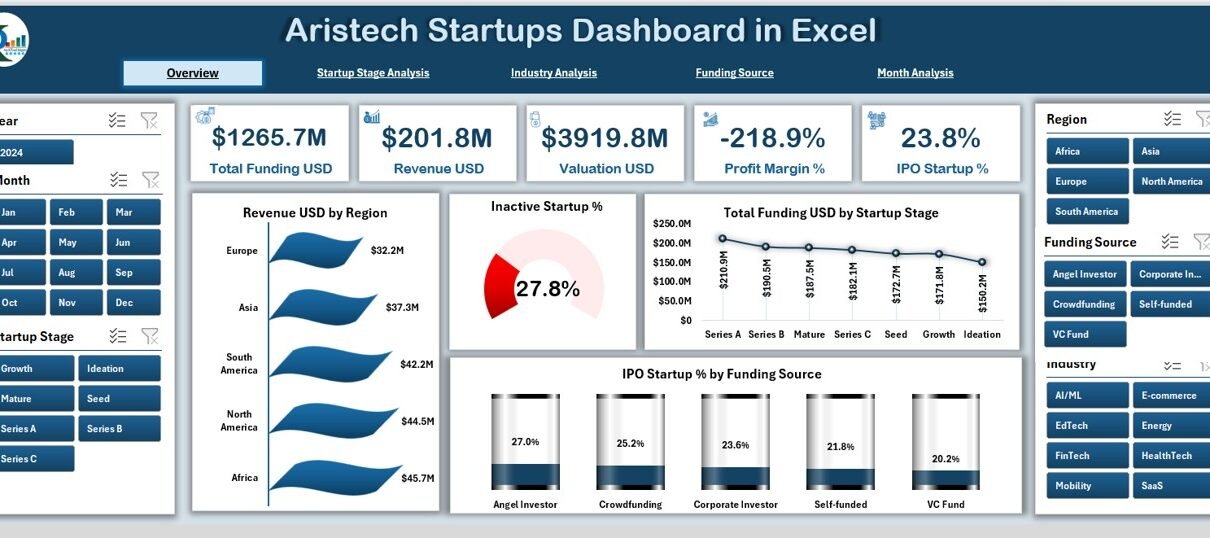
1. Overview Page: What Does the Overview Page Show?
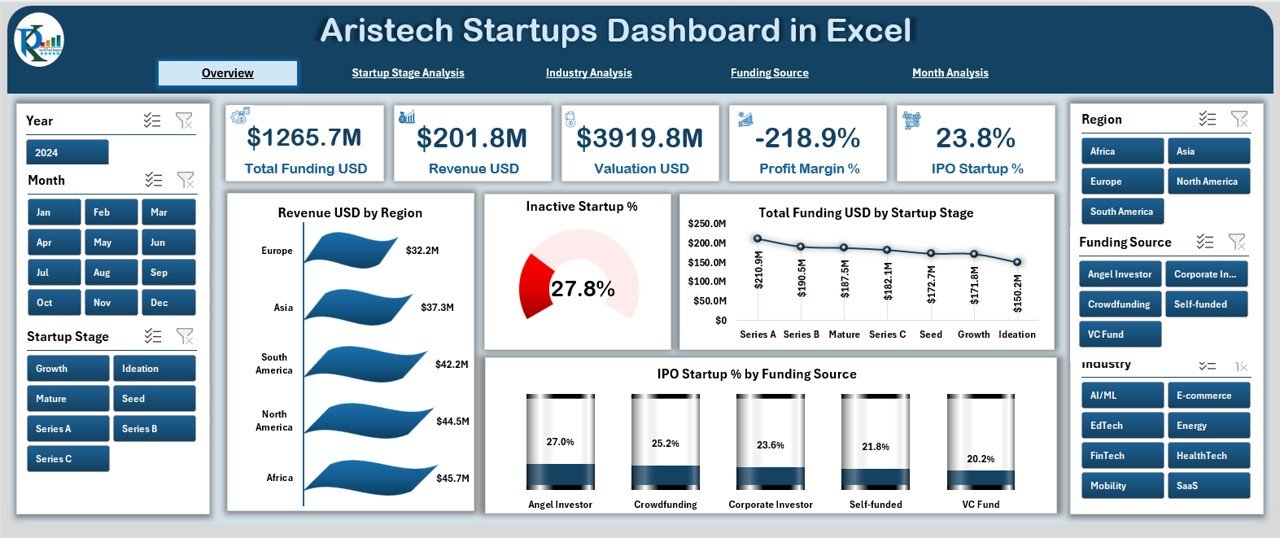
The Overview Page acts as the main page of the dashboard. You can see high-level startup performance here. Since this page gives you a snapshot of the entire dataset, it becomes the most important part of the dashboard.
Elements Available on the Overview Page
✔ Right-side slicer panel for quick filtering
✔ Five KPI cards for instant insights
✔ Four powerful charts that highlight major trends
Charts on the Overview Page
-
Revenue (USD) by Region
This chart helps you see which region generates the most revenue. You can compare global performance and identify the best-performing markets. -
Inactive Startup %
This shows how many startups stopped operations. It helps investors understand risk factors. -
Total Funding (USD) by Status Stage
This shows funding amounts for each startup stage such as Seed, Series A, Series B, and Pre-IPO. -
IPO Startup % by Funding Source
This chart helps you understand how different funding sources influence IPO outcomes.
Because this page highlights all major KPIs in one place, it helps founders and investors make quick decisions.
2. Startup Stage Analysis: Why Do We Need Startup Stage Insights?
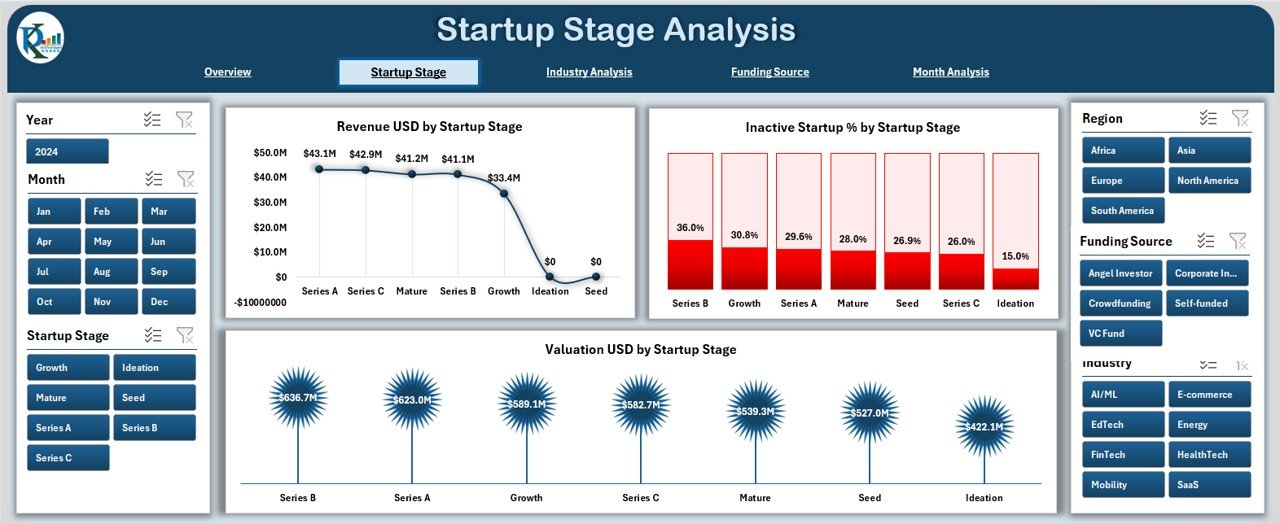
Every startup moves through different stages, and each stage shows different performance levels. The Startup Stage Analysis Page brings clarity to this journey. As startups grow, revenue, valuation, and funding patterns change. This page helps track these changes.
Elements Available
✔ Right-side slicer panel
✔ Three detailed charts
Charts on the Startup Stage Page
-
Revenue (USD) by Startup Stage
You can compare revenue at Seed, Early Stage, Growth Stage, Expansion, and IPO stage. -
Inactive Startup % by Startup Stage
This chart shows the stages where most startups fail. It is very useful for risk analysis. -
Valuation (USD) by Startup Stage
This helps founders and investors identify valuation growth at every stage.
When you understand stage-wise performance, you make better strategic and financial decisions.
3. Industry Analysis Page: How Does Industry Performance Affect Startups?
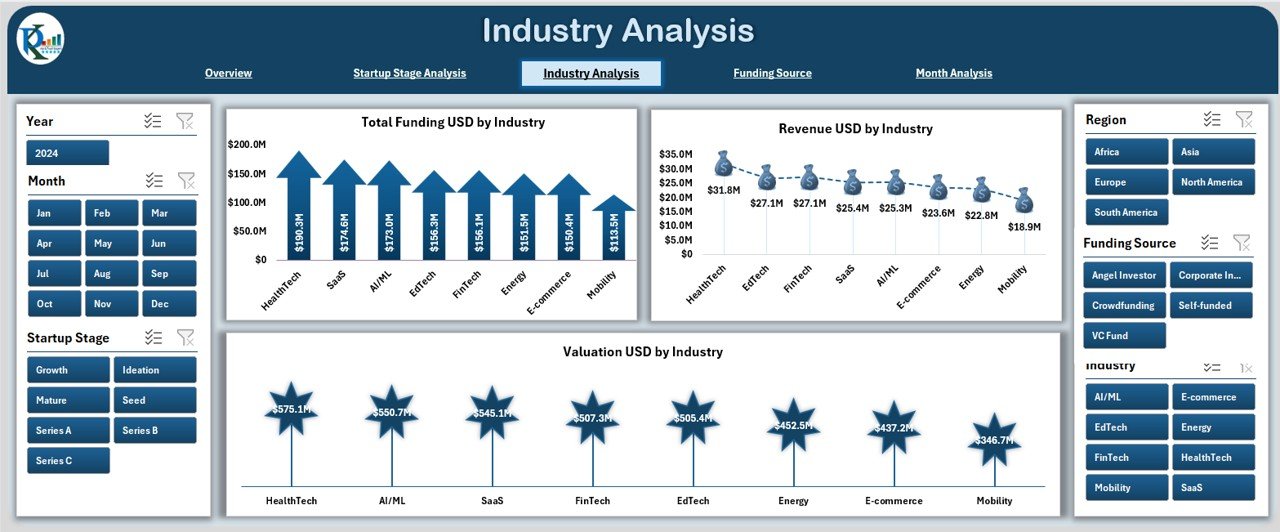
Different industries grow at different speeds. The Industry Analysis Page helps you compare industries like:
-
Technology
-
E-commerce
-
Healthcare
-
Real estate
-
Fintech
-
Education
-
Manufacturing
-
Logistics
What This Page Includes
✔ Right-side slicers
✔ Three major industry-level charts
Charts on the Industry Analysis Page
-
Total Funding (USD) by Industry
You can see which industries attract the most investor interest. -
Revenue (USD) by Industry
This highlights industries that generate strong financial returns. -
Valuation (USD) by Industry
This reveals which sectors grow faster in valuation.
Industry insights help teams identify opportunities, reduce risks, and target strong markets.
4. Funding Source Analysis: What Is the Impact of Funding Sources?
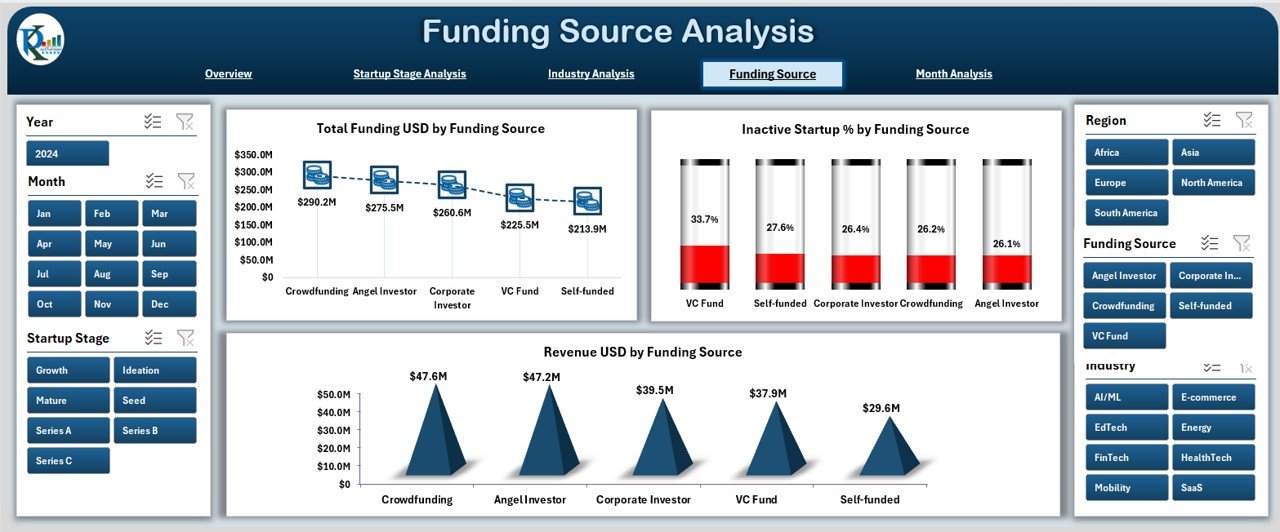
Startups receive funds from many sources such as:
-
Venture capital
-
Angel investors
-
Crowdfunding
-
Government grants
-
Private equity
-
Corporate investors
-
Self-funding
Each funding source brings different growth patterns. The Funding Source Analysis Page shows how these patterns influence performance.
Elements Available
✔ Interactive slicer panel
✔ Three important charts
Charts on the Funding Source Page
-
Total Funding (USD) by Funding Source
Understand where the highest amount of money comes from. -
Revenue (USD) by Funding Source
Analyze how funding type affects revenue performance. -
Inactive Startup % by Funding Source
See which funding types carry higher risk.
This page helps investors improve their funding strategy and helps founders choose the right funding source for growth.
5. Month Analysis Page: Why Do Monthly Trends Matter?
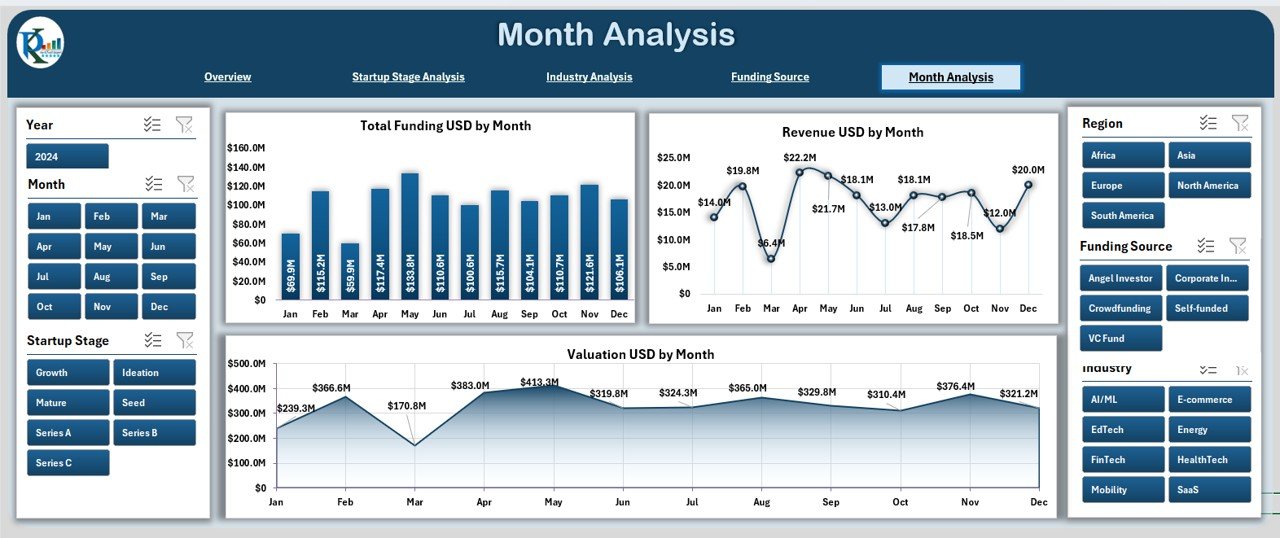
Monthly trends help you understand cash flow patterns, seasonal behavior, and growth opportunities. The Month Analysis Page shows the monthly breakdown of startup performance.
Included Elements
✔ Right-side slicer panel
✔ Three detailed month-wise charts
Charts on the Month Analysis Page
-
Total Funding (USD) by Month
See which months attract higher investments. -
Revenue (USD) by Month
Analyze revenue seasonality. -
Valuation (USD) by Month
Track valuation growth over the year.
Monthly analytics help you plan future budgets, improve cash flow decisions, and create better strategies.
Click to Purchases Aristech Startups Dashboard in Excel
Advantages of the Aristech Startups Dashboard in Excel
The dashboard offers multiple advantages that help startups grow faster and smarter.
✔ 1. Single view of all important startup metrics
Everything stays organized in one place.
✔ 2. Easy navigation through page navigator
The left-side navigator allows smooth page transitions.
✔ 3. No technical skills required
Excel handles the logic automatically.
✔ 4. Fully interactive charts & slicers
Users see updated insights with one click.
✔ 5. Better funding and risk analysis
The dashboard shows the connection between funding, valuation, and revenue.
✔ 6. Useful for investors and founders
Both parties understand trends and make better decisions.
✔ 7. Real-time insights
When you update the data sheet, the visuals change instantly.
✔ 8. Helps identify strong and weak areas
You can compare stages, industries, regions, and months easily.
✔ 9. Saves time and effort
Manual reporting becomes unnecessary.
✔ 10. Perfect for presentations
Charts look clean and professional.
Best Practices for Using the Aristech Startups Dashboard in Excel
To get the best results from your dashboard, follow these practical tips:
✔ Keep your data sheet clean and accurate
Use proper formatting and avoid empty fields.
✔ Update your dashboard regularly
Fresh data leads to better insights.
✔ Use slicers for deeper analysis
Slicers help you compare categories quickly.
✔ Customize card values when needed
Focus on KPIs that matter most to your startup.
✔ Explore each page carefully
Each page provides a different type of insight.
✔ Compare trends across industries and regions
It helps you identify hidden opportunities.
✔ Use filters before presenting
Clean visuals help your audience understand the story clearly.
✔ Keep your charts simple
Clean visuals improve readability.
✔ Use conditional formatting in data sheets
It highlights important values instantly.
✔ Export charts when needed
Use charts in investor presentations, reports, and pitch decks.
Conclusion
The Aristech Startups Dashboard in Excel offers a complete way to track startup performance with clarity and confidence. Since the dashboard includes five powerful pages, you can view revenue, funding, valuation, industry trends, startup stages, and monthly patterns in an organized manner. It helps founders understand growth patterns, investors evaluate opportunities, and analysts prepare accurate reports.
With this dashboard, you manage your startup ecosystem with ease. You track progress, identify risks, compare performance categories, and plan growth strategies based on real insights.
This tool gives you control, helps you stay informed, and strengthens your decision-making process.
Frequently Asked Questions (FAQs)
1. What is the Aristech Startups Dashboard in Excel?
It is a ready-to-use analytical dashboard that tracks startup revenue, funding, valuation, industry performance, and more using Excel.
2. Who should use this dashboard?
Startup founders, investors, financial analysts, consultants, accelerators, and students can use this dashboard.
3. Can I customize this dashboard?
Yes, you can add new charts, modify slicers, change themes, or adjust KPIs based on your need.
4. Does the dashboard update automatically?
Yes. When you update the data sheet, all charts and pages refresh instantly.
5. Can I use this for investor presentations?
Yes. The charts are clean, professional, and suitable for pitch decks and reports.
6. Do I need Excel skills to use it?
No. Basic Excel knowledge is enough to manage and update the dashboard.
7. How many pages does this dashboard include?
It includes five pages: Overview, Startup Stage, Industry, Funding Source, and Month Analysis.
8. Does this dashboard help with financial forecasting?
Yes. You can analyze revenue and funding trends to forecast future performance.
9. Can I add more industries or countries?
Yes. You can expand your dataset anytime.
10. Is this dashboard suitable for large datasets?
Yes. Excel manages thousands of rows smoothly, and the dashboard stays interactive.
Visit our YouTube channel to learn step-by-step video tutorials