Artificial Intelligence (AI) is transforming industries across the globe. From automating workflows to predicting outcomes, AI now drives efficiency, innovation, and performance in nearly every business sector. Artificial Intelligence (AI) KPI Dashboard in Power BI However, tracking AI project performance and outcomes can be challenging without proper measurement tools.
That’s where the Artificial Intelligence (AI) KPI Dashboard in Power BI becomes a game-changer.
This dashboard provides a centralized view of key performance indicators (KPIs) related to AI initiatives — including accuracy, efficiency, cost savings, and implementation timelines. Built using Power BI and powered by Excel data, this dashboard allows teams to monitor AI metrics, analyze progress over time, and make data-driven decisions faster.
Click to Purchases Artificial Intelligence (AI) KPI Dashboard in Power BI
In this article, we’ll explore its structure, key features, benefits, best practices, and frequently asked questions.
🧠 What Is an Artificial Intelligence (AI) KPI Dashboard in Power BI?
An AI KPI Dashboard in Power BI is a visual analytics tool designed to track the performance of artificial intelligence systems, algorithms, and projects. It captures data from Excel and transforms it into insightful, interactive visuals that help teams assess the efficiency, accuracy, and value of AI implementations.
This Power BI dashboard consists of three pages:
-
Summary Page – A performance overview with slicers and visual indicators.
-
KPI Trend Page – Visual trends of actual vs. target performance.
-
KPI Definition Page – A drill-through reference for KPI details and formulas.
It’s ideal for data scientists, AI project managers, and business leaders who want to measure the success of AI initiatives in real time.
🧩 Key Features of the AI KPI Dashboard in Power BI
This ready-to-use dashboard template connects to an Excel file containing input, target, and KPI definition sheets. Below are its core components and functionalities.
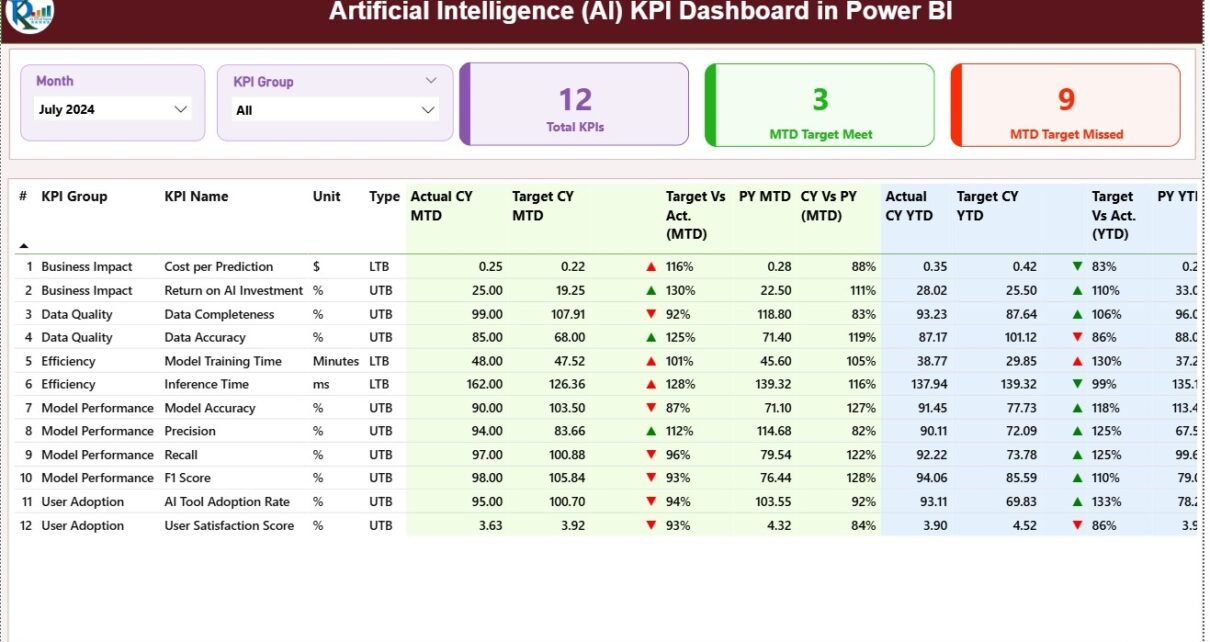
1️⃣ Summary Page
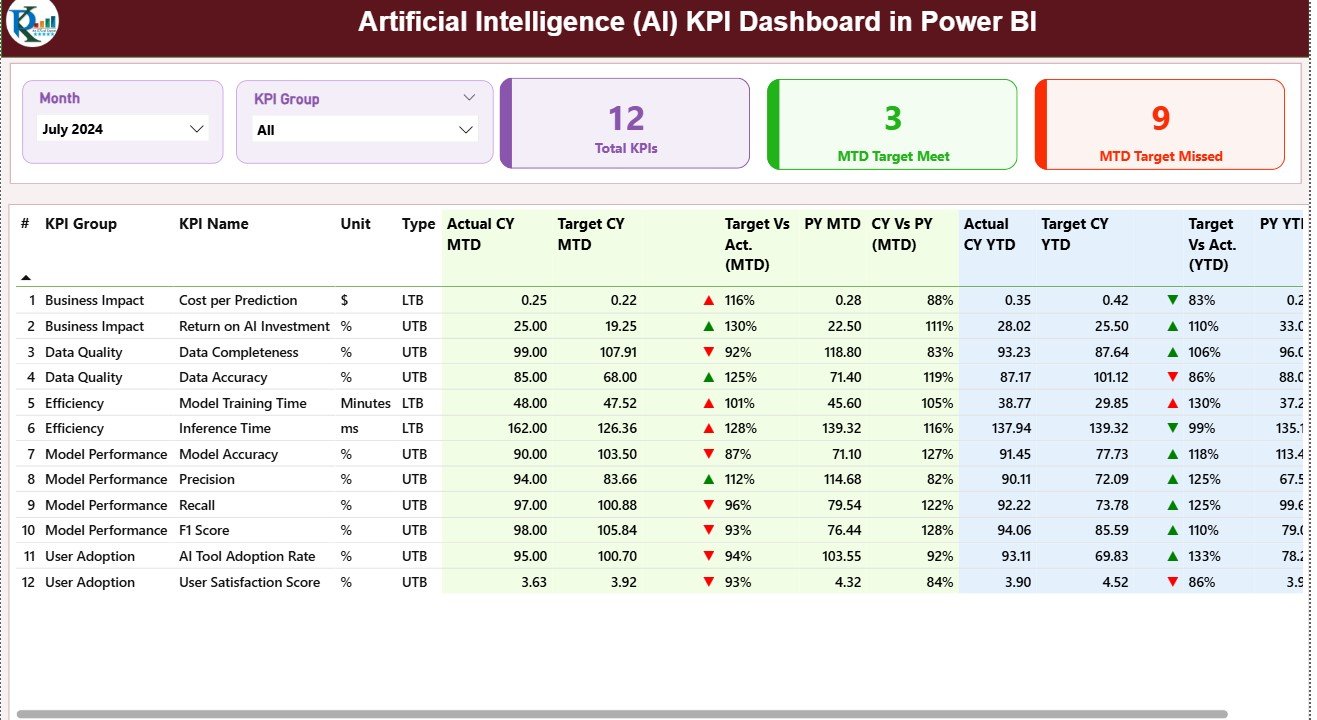
The Summary Page acts as the main control center for the dashboard. It offers a snapshot of how your AI initiatives are performing at any given time.
Features include:
-
Slicers: Filter by Month and KPI Group to focus your analysis.
-
Performance Cards:
-
Total KPIs Count
-
MTD (Month-to-Date) Target Met Count
-
MTD Target Missed Count
-
-
Detailed Table: Displays KPI-wise data, including:
-
KPI Number, Group, and Name
-
Unit and Type (UTB – Upper the Better / LTB – Lower the Better)
-
Actual vs Target for both MTD and YTD (Year-to-Date)
-
Comparison with Previous Year (PY)
-
Conditional formatting icons (▲▼) for instant status visibility.
-
This layout enables executives to track which AI metrics meet targets and which need improvement.
2️⃣ KPI Trend Page
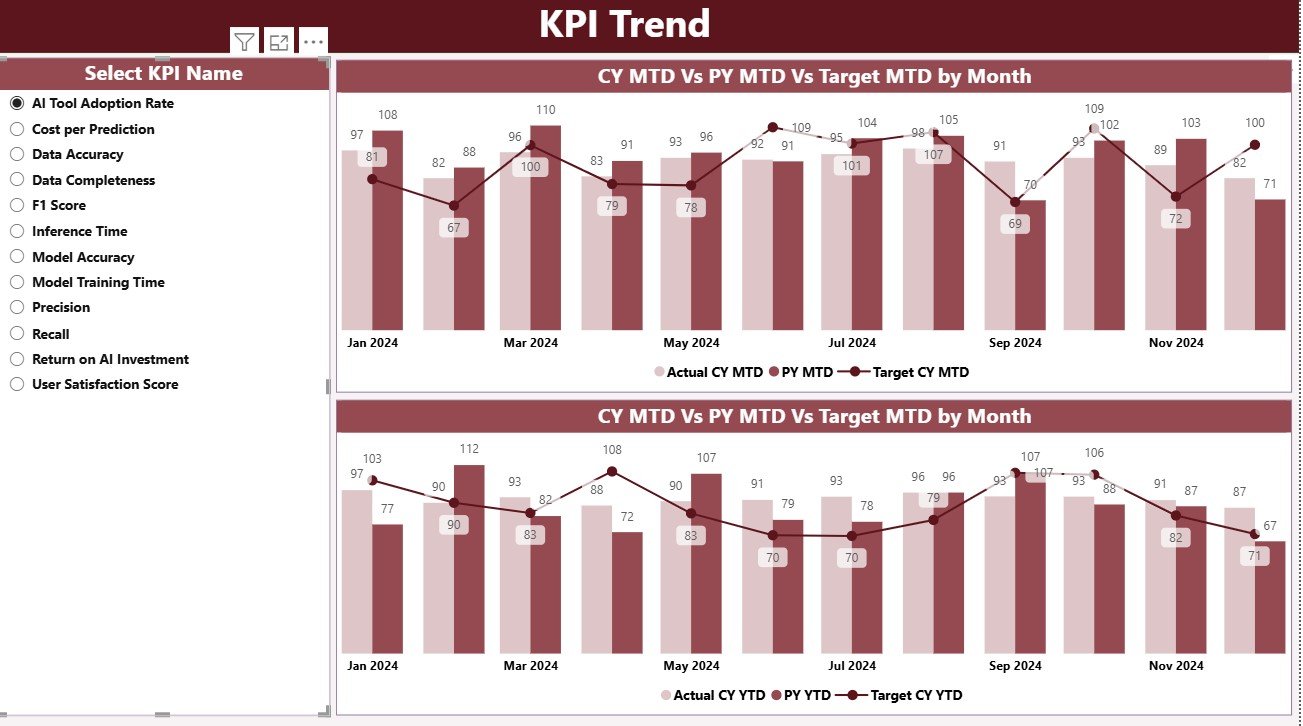
The KPI Trend Page provides detailed trend analysis and visual storytelling for each AI performance metric.
Highlights:
-
Slicer for KPI Name: Select the KPI you want to analyze.
-
Combo Charts: Compare Actual, Target, and PY values side by side.
-
Trend Views: Separate charts for MTD and YTD trends.
This page helps data analysts identify seasonal variations, performance gaps, or rapid improvements in AI efficiency and accuracy.
3️⃣ KPI Definition Page
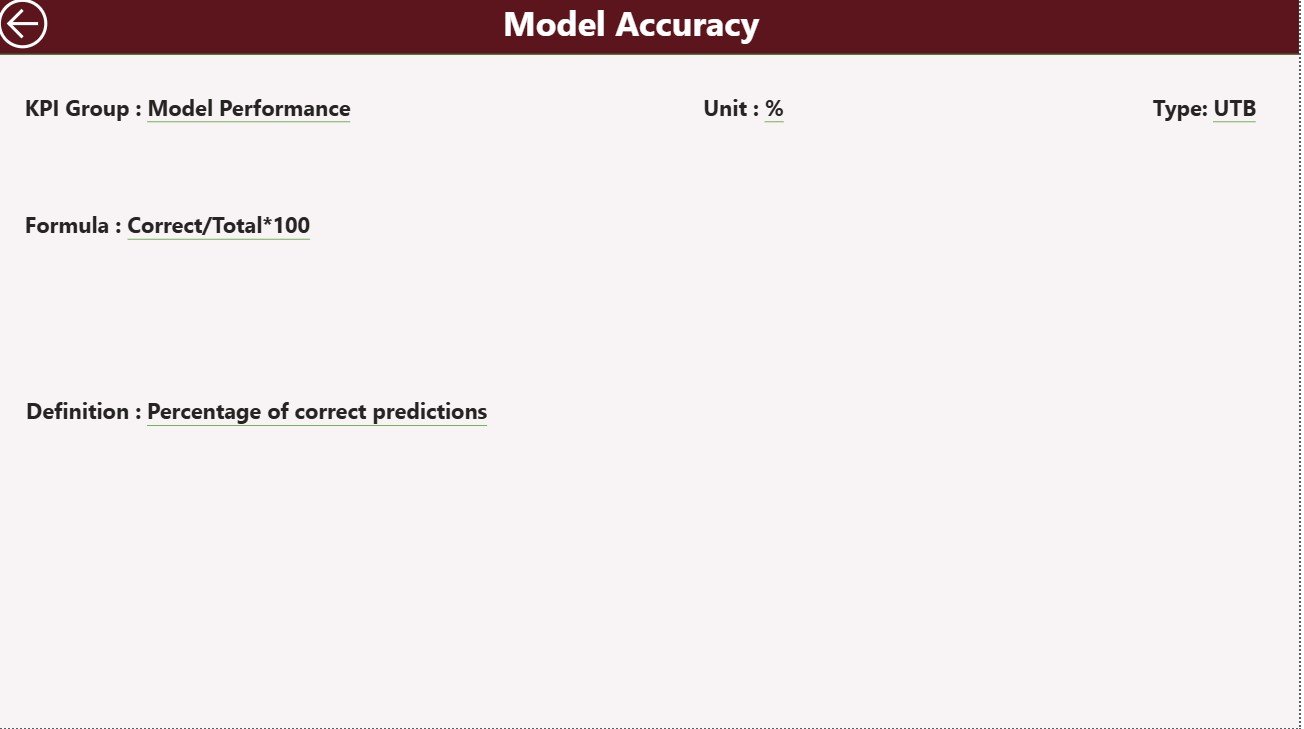
The KPI Definition Page functions as a hidden drill-through section that provides detailed descriptions of each KPI.
Details included:
-
KPI Number and Group
-
KPI Name and Unit of Measurement
-
Type (UTB/LTB)
-
Formula
-
Definition
You can access this page directly by drilling through from the Summary Page, then return using the Back button on the top-left corner.
📊 Excel Data Structure
The Power BI dashboard connects to a well-structured Excel file with three worksheets, ensuring easy data management.
1. Input_Actual Sheet
-
Enter actual performance numbers for each KPI.
-
Fields include KPI Name, Month (use first day of month), MTD, and YTD values.
2. Input_Target Sheet
-
Define target values for each KPI.
-
Include the same Month, MTD, and YTD fields for comparison.
3. KPI Definition Sheet
-
Document each KPI with details such as KPI Number, Group, Formula, Unit, and Type (LTB or UTB).
This Excel integration makes the dashboard simple to update and ensures consistent KPI measurement.
Click to Purchases Artificial Intelligence (AI) KPI Dashboard in Power BI
🚀 Benefits of Using an AI KPI Dashboard in Power BI
The dashboard brings structure and transparency to AI project monitoring. Let’s look at the main advantages.
✅ 1. Real-Time Performance Insights
Instantly see how your AI models are performing compared to targets — without manual reporting.
✅ 2. Simplified KPI Management
All performance metrics are displayed on a single screen, allowing for quick status checks.
✅ 3. Accuracy and Transparency
With visual indicators and trend charts, decision-makers can easily spot inefficiencies or improvements.
✅ 4. Time and Cost Efficiency
Eliminate the need for manual data analysis. Automated dashboards save hours of reporting time every month.
✅ 5. Enhanced Decision-Making
Access interactive visuals that make identifying risks or successes intuitive.
✅ 6. Scalability
Add new KPIs, modify data sources, or expand your dashboard as your AI program grows.
🤖 Common KPIs for AI Performance Tracking
Here are some key metrics you can include in your AI KPI Dashboard in Power BI:
1. Model Accuracy and Performance
-
Model Accuracy (%)
-
Precision and Recall (%)
-
False Positive Rate (%)
-
F1 Score
-
Training Time (mins)
2. Efficiency Metrics
-
Prediction Speed (ms per request)
-
Resource Utilization (%)
-
Model Deployment Time (days)
-
Automation Success Rate (%)
3. Financial KPIs
-
Cost Reduction through AI (%)
-
AI Project ROI (%)
-
Budget Utilization (%)
-
Savings from Process Automation (USD)
4. Adoption and Usage Metrics
-
AI System Uptime (%)
-
User Adoption Rate (%)
-
Number of Automated Decisions
-
Active Model Count
5. Innovation and Improvement
-
Model Retraining Frequency
-
Feature Improvement Rate (%)
-
New Use Cases Implemented (#)
These KPIs provide a full picture of AI’s impact on business outcomes.
Click to Purchases Artificial Intelligence (AI) KPI Dashboard in Power BI
🧠 How to Use the AI KPI Dashboard in Power BI
Follow these simple steps to use the dashboard effectively:
-
Connect Excel Data:
Link your Excel data source (Input_Actual, Input_Target, and KPI Definition sheets). -
Refresh Data:
Use Power BI’s “Refresh” button to load the latest performance data. -
Filter and Analyze:
Apply slicers for Month or KPI Group to focus on specific time periods or AI functions. -
View KPI Trends:
Explore the KPI Trend page for time-based insights on AI model performance. -
Drill Through to Details:
Click on a KPI to access the Definition Page and understand its formula or logic.
By following this workflow, you can monitor your AI initiatives with clarity and precision.
💡 Advantages of Using Power BI for AI KPI Tracking
Power BI’s capabilities go far beyond static reporting. Here’s why it’s perfect for tracking AI metrics:
-
📈 Interactive Dashboards: Engage with data dynamically through visuals and filters.
-
⚡ Real-Time Updates: Refresh your data connections anytime to view the latest metrics.
-
🔍 Detailed Drill-Downs: Click on visuals to explore detailed KPI-level insights.
-
🌐 Easy Sharing: Publish your dashboard to Power BI Service for online access.
-
🧩 Custom Visuals: Add charts like gauges, combo graphs, or progress rings for enhanced visuals.
-
🔒 Secure Data Management: Control access permissions through Power BI’s built-in security features.
🔧 Opportunities for Improvement
While this AI KPI Dashboard is comprehensive, you can take it even further with these enhancements:
-
🤝 Integration with Databases: Connect Power BI to SQL Server, Azure, or APIs for live data.
-
🔄 Automation: Use Power Automate to schedule data refreshes.
-
📊 Predictive Analytics: Incorporate Power BI’s AI visuals like Key Influencers for deeper insights.
-
🧩 Custom Tooltips: Display additional KPI info when hovering over visuals.
-
📱 Mobile Optimization: Design mobile layouts for on-the-go reporting.
🧭 Best Practices for Building and Using the AI KPI Dashboard
To get the most value out of your dashboard, follow these best practices:
🧠 1. Define Clear Objectives
Start by identifying what you want to measure — e.g., model accuracy, adoption rate, or cost efficiency.
🧠 2. Choose the Right KPIs
Ensure that all KPIs align with your AI goals and business strategy.
🧠 3. Maintain Data Quality
Clean and validate your Excel data regularly to ensure accurate reporting.
🧠 4. Use Consistent Units
Keep measurement units consistent (%, $, time) across all sheets.
🧠 5. Review KPIs Monthly
Set a review cadence to analyze MTD and YTD progress and recalibrate goals.
🧠 6. Encourage Collaboration
Share dashboards with cross-functional teams (data science, operations, and management).
🧠 7. Leverage Power BI Features
Use bookmarks, slicers, and drill-throughs to create an intuitive user experience.
⚙️ Example: Real-World Use Case
Imagine an AI startup monitoring model performance across multiple clients.
The Power BI dashboard shows that Model Accuracy improved by 8%, but Prediction Speed dropped slightly in the latest month.
By reviewing the KPI Trend Page, the data team identifies that the slower speed is due to the addition of complex features during retraining.
They optimize the model, and by the next month, both accuracy and prediction speed improve — with visual proof right in Power BI.
This real-time visibility helps teams make data-backed decisions that directly enhance AI performance and customer satisfaction.
Click to Purchases Artificial Intelligence (AI) KPI Dashboard in Power BI
🧾 Conclusion
The Artificial Intelligence (AI) KPI Dashboard in Power BI is a must-have tool for organizations leveraging AI technologies. It simplifies the tracking of AI performance metrics, aligns team objectives, and promotes informed decision-making.
With its interactive visuals, Excel integration, and trend analysis capabilities, this dashboard empowers businesses to monitor progress, benchmark results, and continuously improve AI systems.
Whether you’re a data scientist, project manager, or business leader — this dashboard ensures your AI investments deliver measurable impact.
❓ Frequently Asked Questions (FAQs)
1. What is an AI KPI Dashboard in Power BI?
It’s a Power BI dashboard designed to monitor key metrics for AI projects, such as accuracy, efficiency, and cost savings.
2. How is the data connected?
The dashboard uses an Excel file as its data source with Actual, Target, and Definition sheets.
3. What are the main KPIs?
Model Accuracy, ROI, Processing Speed, Cost Reduction, and Adoption Rate are some key metrics.
4. Can I add more KPIs?
Yes, you can expand the Excel data and refresh Power BI to add new KPIs anytime.
5. Do I need coding skills to use it?
No. Power BI’s drag-and-drop interface makes it user-friendly.
6. How often should I refresh the data?
Monthly or weekly, depending on your project’s reporting frequency.
7. Is this dashboard suitable for all industries?
Yes. It can track AI projects in finance, healthcare, manufacturing, and more.
8. Can I share it with my team online?
Yes. You can publish it to Power BI Service for secure, cloud-based collaboration.
9. Can I analyze trends over time?
Absolutely. The KPI Trend Page visualizes both MTD and YTD performance.
10. What makes this dashboard unique?
Its simplicity, flexibility, and Power BI integration make it a practical and powerful analytics solution.
Click to Purchases Artificial Intelligence (AI) KPI Dashboard in Power BI
Visit our YouTube channel to learn step-by-step video tutorials
Watch the step-by-step video tutorial: