The blockchain and cryptocurrency industry moves extremely fast. Prices change every second, transaction volumes fluctuate daily, and network activity evolves continuously. Therefore, tracking performance without a structured system always creates confusion and poor decision-making. Many professionals rely on scattered data, manual reports, or multiple dashboards, which slows analysis and increases risk.
That is exactly why a Blockchain & Cryptocurrency KPI Scorecard in Excel becomes a powerful and practical solution.
In this detailed article, you will learn what a Blockchain & Cryptocurrency KPI Scorecard in Excel is, why it is important, how it works, its complete worksheet-wise structure, key features, advantages, best practices, and frequently asked questions. Moreover, this guide uses clear language and practical explanations so you can apply it immediately in real-world crypto and blockchain operations.
Click to buy Blockchain & Cryptocurrency KPI Scorecard In Excel
What Is a Blockchain & Cryptocurrency KPI Scorecard in Excel?
A Blockchain & Cryptocurrency KPI Scorecard in Excel is a structured performance tracking tool designed to monitor critical blockchain and crypto-related key performance indicators in one centralized place. Instead of reviewing multiple reports or dashboards, users can track all KPIs in a single Excel-based scorecard.
Because the scorecard is built in Excel, it remains flexible, affordable, and easy to use. Moreover, teams can customize KPIs based on exchanges, wallets, mining operations, DeFi platforms, or blockchain networks.
This scorecard helps organizations track performance using Actual vs Target, MTD, YTD, and Previous Year (PY) comparisons. As a result, decision-makers gain clarity, consistency, and control over crypto performance metrics.
Why Do Blockchain and Cryptocurrency Teams Need a KPI Scorecard?
Blockchain and cryptocurrency operations generate massive volumes of data every day. However, raw data alone does not help unless teams track the right KPIs in a structured way.
Key reasons why a KPI Scorecard is essential:
- Blockchain networks involve multiple performance metrics like transaction speed, network fees, hash rate, and uptime.
- Cryptocurrency platforms need constant monitoring of trading volume, liquidity, user activity, and security metrics.
- Manual tracking increases errors and delays insights.
- Without targets, teams cannot measure success or improvement.
- Scattered data reduces transparency and accountability.
Therefore, a Blockchain & Cryptocurrency KPI Scorecard in Excel creates a single source of truth for performance monitoring.
How Does a Blockchain & Cryptocurrency KPI Scorecard in Excel Work?
The KPI Scorecard works by combining structured data input with automated calculations and visual indicators. First, users enter KPI definitions and monthly data. Then, Excel formulas calculate MTD, YTD, and comparison metrics. Finally, charts and visual indicators display performance clearly.
The working flow looks like this:
- Define KPIs and targets in the KPI Definition sheet
- Enter actual data in the Input Data sheet
- Review KPI performance in the Scorecard sheet
- Analyze trends in the KPI Trend sheet
Because everything connects dynamically, updating data automatically refreshes the entire scorecard.
Worksheet-Wise Structure of the Blockchain & Cryptocurrency KPI Scorecard in Excel
This ready-to-use KPI Scorecard template contains four well-structured worksheets, each designed for a specific purpose. Let us explore them one by one.
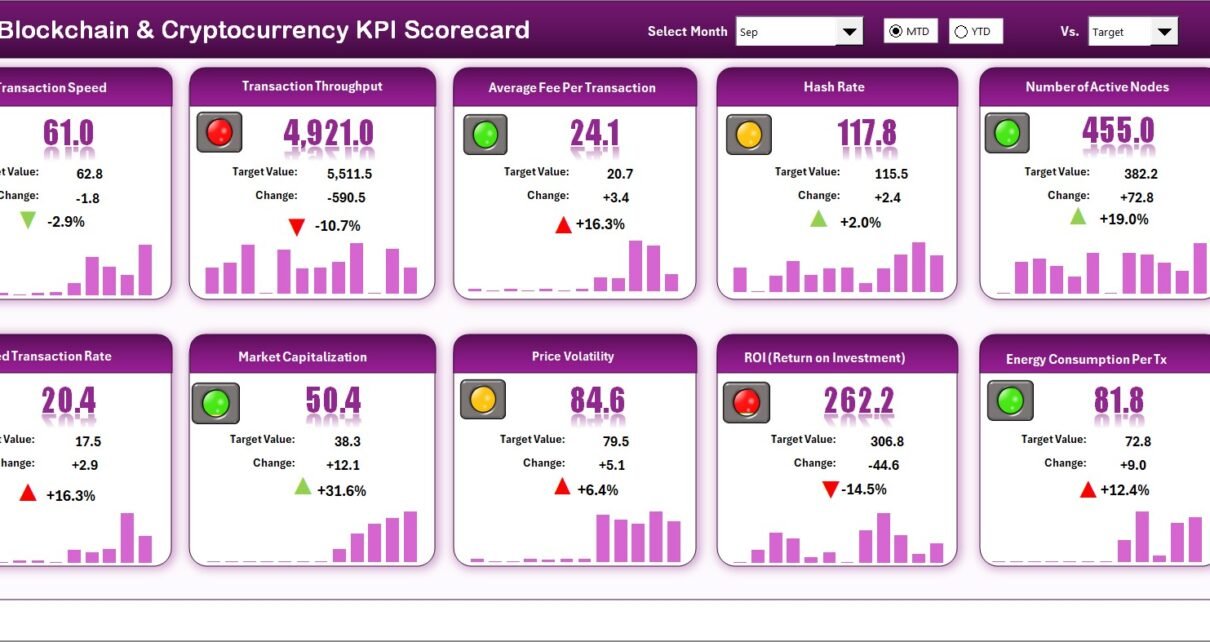
Scorecard Sheet – How Do You View KPI Performance in One Place?
The Scorecard Sheet acts as the main dashboard of the KPI Scorecard. It provides a complete overview of blockchain and cryptocurrency KPIs in a single view.
Key features of the Scorecard Sheet:
- Dropdown Menus
Select Month, MTD, or YTD easily
Instantly update all KPI values
Actual vs Target Comparison
Compare real performance against planned targets
Identify gaps quickly
Visual Indicators
Color-coded indicators highlight performance status
Conditional formatting shows good, average, or poor performance
Comprehensive KPI Overview
Displays KPI Name, Group, Unit, and Type
Shows MTD and YTD performance together
10 KPIs in One View
Monitor multiple KPIs without scrolling
Maintain clarity and focus
As a result, users can instantly understand whether KPIs perform well or need corrective action.

Click to buy Blockchain & Cryptocurrency KPI Scorecard In Excel
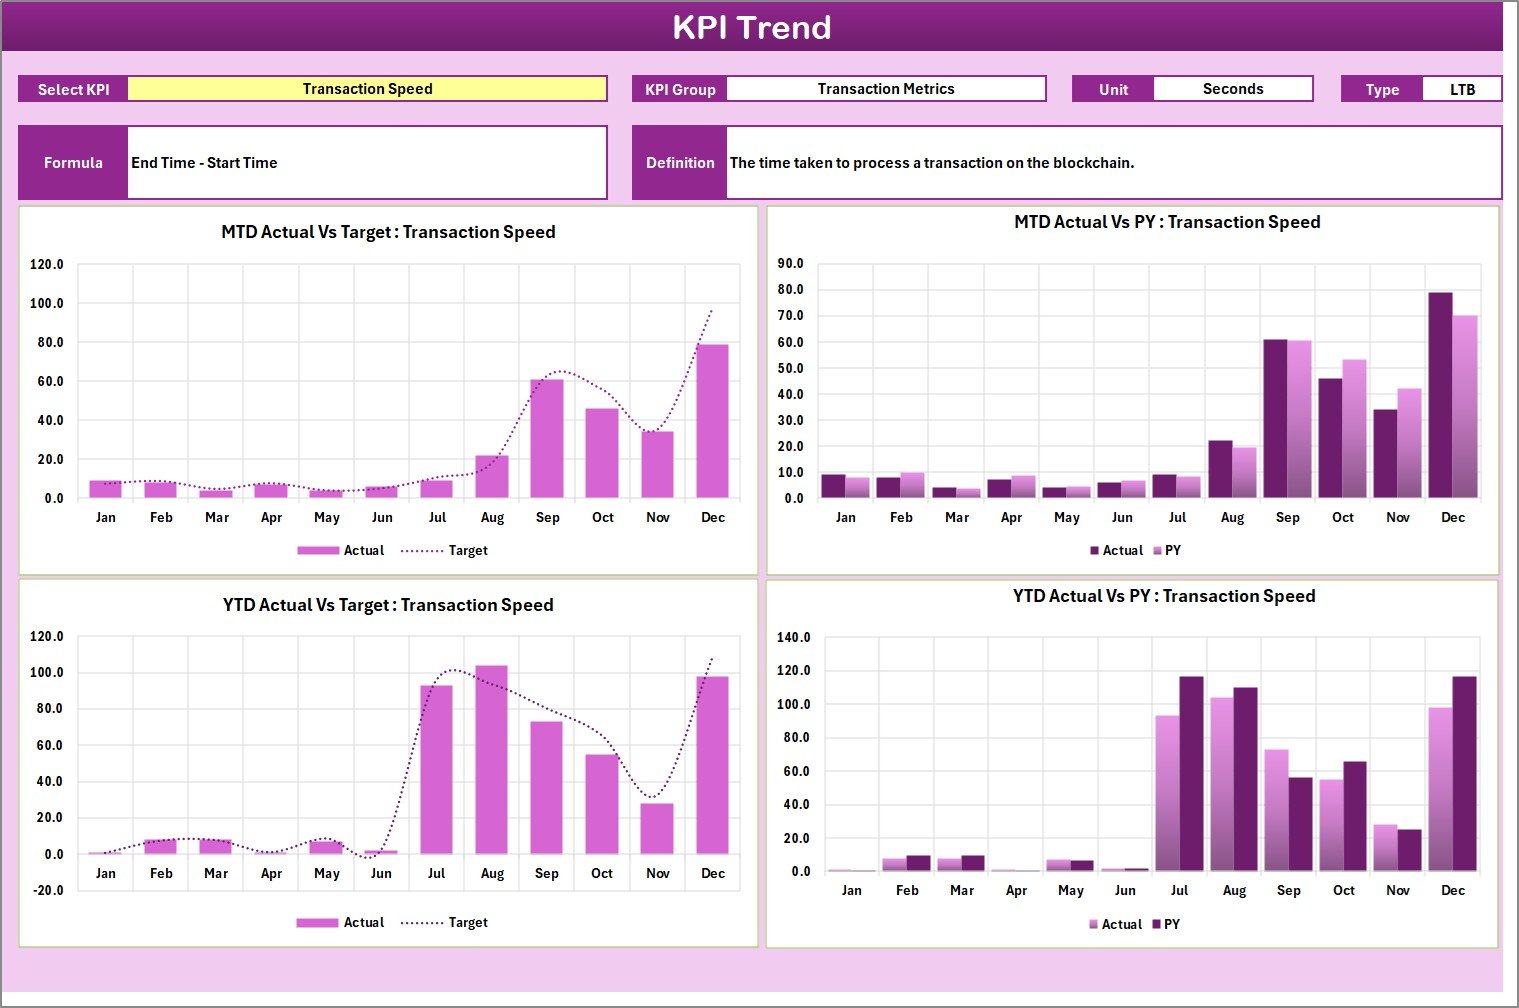
KPI Trend Sheet – How Can You Analyze KPI Performance Over Time?
The KPI Trend Sheet helps users analyze how each KPI performs over time. Instead of looking at static numbers, teams can visualize performance movement clearly.
Key functionalities of the KPI Trend Sheet:
- KPI Selection Dropdown
Choose a KPI from the dropdown at range C3
KPI Details Display
KPI Group
Unit of KPI
KPI Type (Lower the Better or Upper the Better)
KPI Formula
KPI Definition
Trend Charts
MTD trend for Actual, Target, and Previous Year
YTD trend for Actual, Target, and Previous Year
Because trend analysis reveals patterns, teams can forecast risks and opportunities more accurately.
Click to buy Blockchain & Cryptocurrency KPI Scorecard In Excel
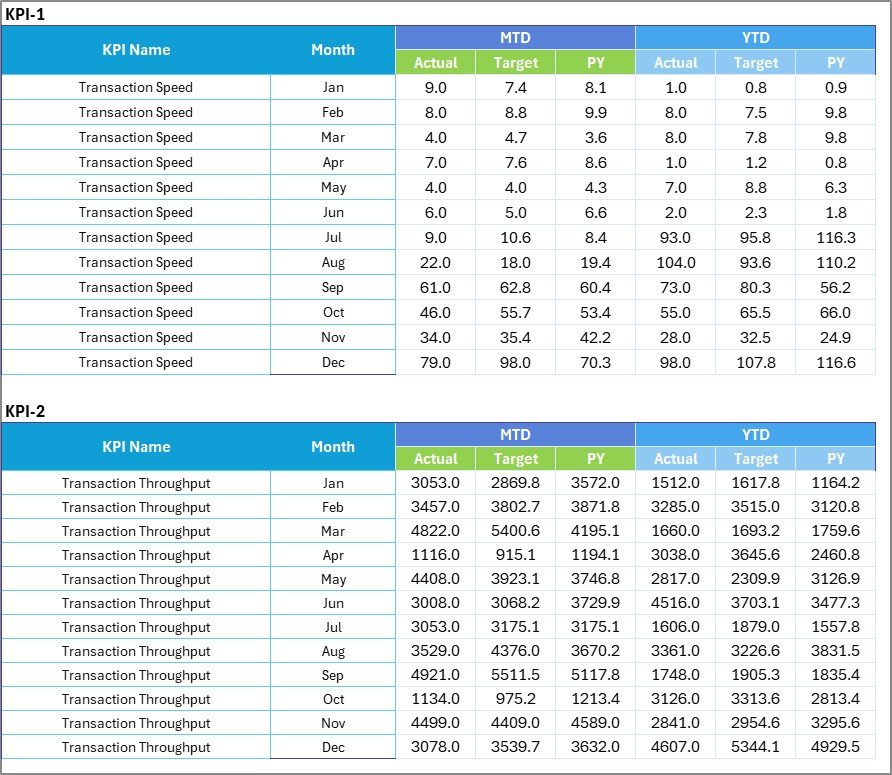
Input Data Sheet – Where Do You Enter KPI Data?
The Input Data Sheet acts as the backbone of the entire scorecard. All KPI calculations and visuals depend on this data.
Key features of the Input Data Sheet:
- Centralized Data Entry
Enter actual values for each KPI
Enter monthly targets and PY data
Easy Updates
Update data as soon as new results arrive
Keep the scorecard always current
Flexible Structure
Add new months or KPIs easily
Adapt the scorecard as operations evolve
Because data entry stays simple and structured, even non-technical users can maintain the scorecard confidently.
Click to buy Blockchain & Cryptocurrency KPI Scorecard In Excel
KPI Definition Sheet – How Do You Standardize KPI Meaning?
The KPI Definition Sheet ensures clarity and consistency across the organization. It defines what each KPI means and how it is calculated.
Key elements included in this sheet:
- KPI Name
- KPI Group
- Unit of Measurement
- KPI Formula
- KPI Definition
Because definitions remain visible and standardized, everyone interprets KPIs the same way.

Click to buy Blockchain & Cryptocurrency KPI Scorecard In Excel
What Are Common Blockchain & Cryptocurrency KPIs Tracked in the Scorecard?
A Blockchain & Cryptocurrency KPI Scorecard in Excel can track various KPIs depending on business needs. However, some commonly used KPIs include:
Network Performance KPIs
- Transaction Throughput
- Average Transaction Fee
- Network Uptime %
- Block Confirmation Time
Market and Trading KPIs
- Trading Volume
- Liquidity Ratio
- Price Volatility
- Market Capitalization Growth
User and Adoption KPIs
- Active Wallets
- New User Growth
- Transaction Count per User
- Retention Rate
Operational KPIs
- Mining Hash Rate
- Energy Efficiency
- Node Availability
- Security Incident Count
Because Excel remains flexible, teams can customize KPIs easily.
Advantages of Blockchain & Cryptocurrency KPI Scorecard in Excel
Using a KPI Scorecard in Excel offers several practical benefits for blockchain and crypto professionals.
Key advantages include:
Centralized Performance Monitoring
Track all KPIs in one file
Improved Decision-Making
Clear visuals support faster actions
Cost-Effective Solution
No expensive software licenses required
High Flexibility
Customize KPIs and targets easily
Easy Adoption
Excel remains familiar to most users
Historical Comparison
Analyze trends using MTD, YTD, and PY data
Transparency and Accountability
Everyone sees the same performance data
As a result, teams achieve better control and strategic clarity.
Who Can Use a Blockchain & Cryptocurrency KPI Scorecard in Excel?
This KPI Scorecard suits a wide range of users across the crypto ecosystem.
Typical users include:
- Cryptocurrency exchanges
- Blockchain startups
- DeFi platform teams
- Crypto traders and analysts
- Mining operation managers
- Web3 product managers
- Investors and portfolio managers
Because Excel supports scalability, both small teams and large organizations can use this scorecard effectively.
Best Practices for the Blockchain & Cryptocurrency KPI Scorecard in Excel
Following best practices ensures that the KPI Scorecard delivers maximum value.
Best practices include:
- Select Relevant KPIs
Focus only on KPIs aligned with business goals
Define Clear Targets
Set realistic and measurable targets
Update Data Regularly
Maintain data accuracy and freshness
Use Consistent Definitions
Avoid confusion across teams
Review Trends Frequently
Analyze patterns instead of single-month values
Limit KPI Count
Track quality KPIs instead of too many metrics
Use Visual Indicators Wisely
Keep colors simple and meaningful
When teams follow these practices, the scorecard becomes a reliable decision-support tool.
How Does This KPI Scorecard Support Strategic Decision-Making?
Strategic decisions require accurate, timely, and structured data. This KPI Scorecard provides exactly that.
- Leaders identify underperforming areas quickly
- Teams measure progress against targets consistently
- Managers track improvement over time
- Risks become visible before they escalate
Therefore, the scorecard transforms raw blockchain data into actionable insights.
Conclusion
A Blockchain & Cryptocurrency KPI Scorecard in Excel provides a simple yet powerful way to track performance in a fast-moving digital ecosystem. Instead of managing scattered data or complex dashboards, teams gain a centralized, visual, and structured performance tracking system.
With its four well-designed worksheets—Scorecard, KPI Trend, Input Data, and KPI Definition—this ready-to-use Excel template supports accurate monitoring, trend analysis, and strategic decision-making. Moreover, its flexibility, affordability, and ease of use make it suitable for both beginners and advanced professionals.
If you want better visibility, stronger control, and smarter decisions in blockchain and cryptocurrency operations, this KPI Scorecard in Excel becomes an essential tool.
Frequently Asked Questions (FAQs)
What is the main purpose of a Blockchain & Cryptocurrency KPI Scorecard in Excel?
The main purpose is to track, analyze, and visualize blockchain and crypto KPIs in one centralized Excel-based scorecard.
Can beginners use this KPI Scorecard easily?
Yes, beginners can use it easily because the template uses simple Excel features like dropdowns, tables, and charts.
How many KPIs can this scorecard track?
The scorecard displays 10 KPIs in one view. However, users can customize and expand it as needed.
Does this scorecard support MTD and YTD analysis?
Yes, it supports Month-to-Date and Year-to-Date analysis along with Previous Year comparisons.
Can users customize KPIs and targets?
Yes, users can fully customize KPI names, definitions, units, formulas, and targets.
Is Excel suitable for blockchain performance tracking?
Yes, Excel works well for KPI tracking, trend analysis, and reporting when used with a structured scorecard.
Does this scorecard support trend charts?
Yes, the KPI Trend sheet shows MTD and YTD trend charts for Actual, Target, and PY values.
Who should use this KPI Scorecard?
Crypto exchanges, blockchain startups, DeFi teams, traders, analysts, and investors can all benefit from this scorecard.
Visit our YouTube channel to learn step-by-step video tutorials
Watch the step-by-step video tutorial:
Click to buy Blockchain & Cryptocurrency KPI Scorecard In Excel