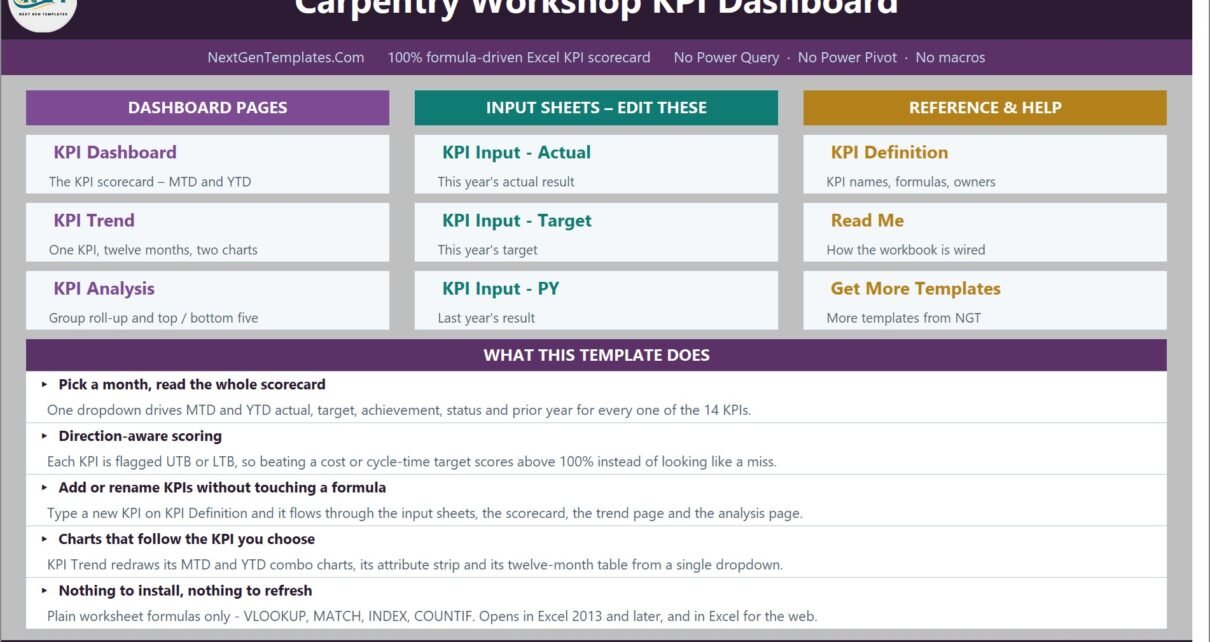
The Carpentry Workshop KPI Dashboard in Excel scores 14 joinery KPIs across 6 KPI groups on 10 worksheets, comparing every metric against a target and against last year. Pick a month from a single dropdown and the whole scorecard re-reads itself: MTD and YTD actual, target, achievement percentage, traffic-light status, prior year and year-on-year movement. Every number is a plain worksheet formula — there is no Power Query, no data model, no macro and no add-in — and the workbook is wired for 22 KPIs with 14 already filled in.
Most small joinery shops measure the wrong thing at the wrong time. Board-foot yield lives in one spreadsheet, rework sits in the foreman’s head, and gross margin only surfaces when the accountant closes the quarter. This template pulls timber yield, machine utilisation, rework, safety, delivery and margin onto one page that a workshop manager can update in ten minutes and hand to the directors the same afternoon.
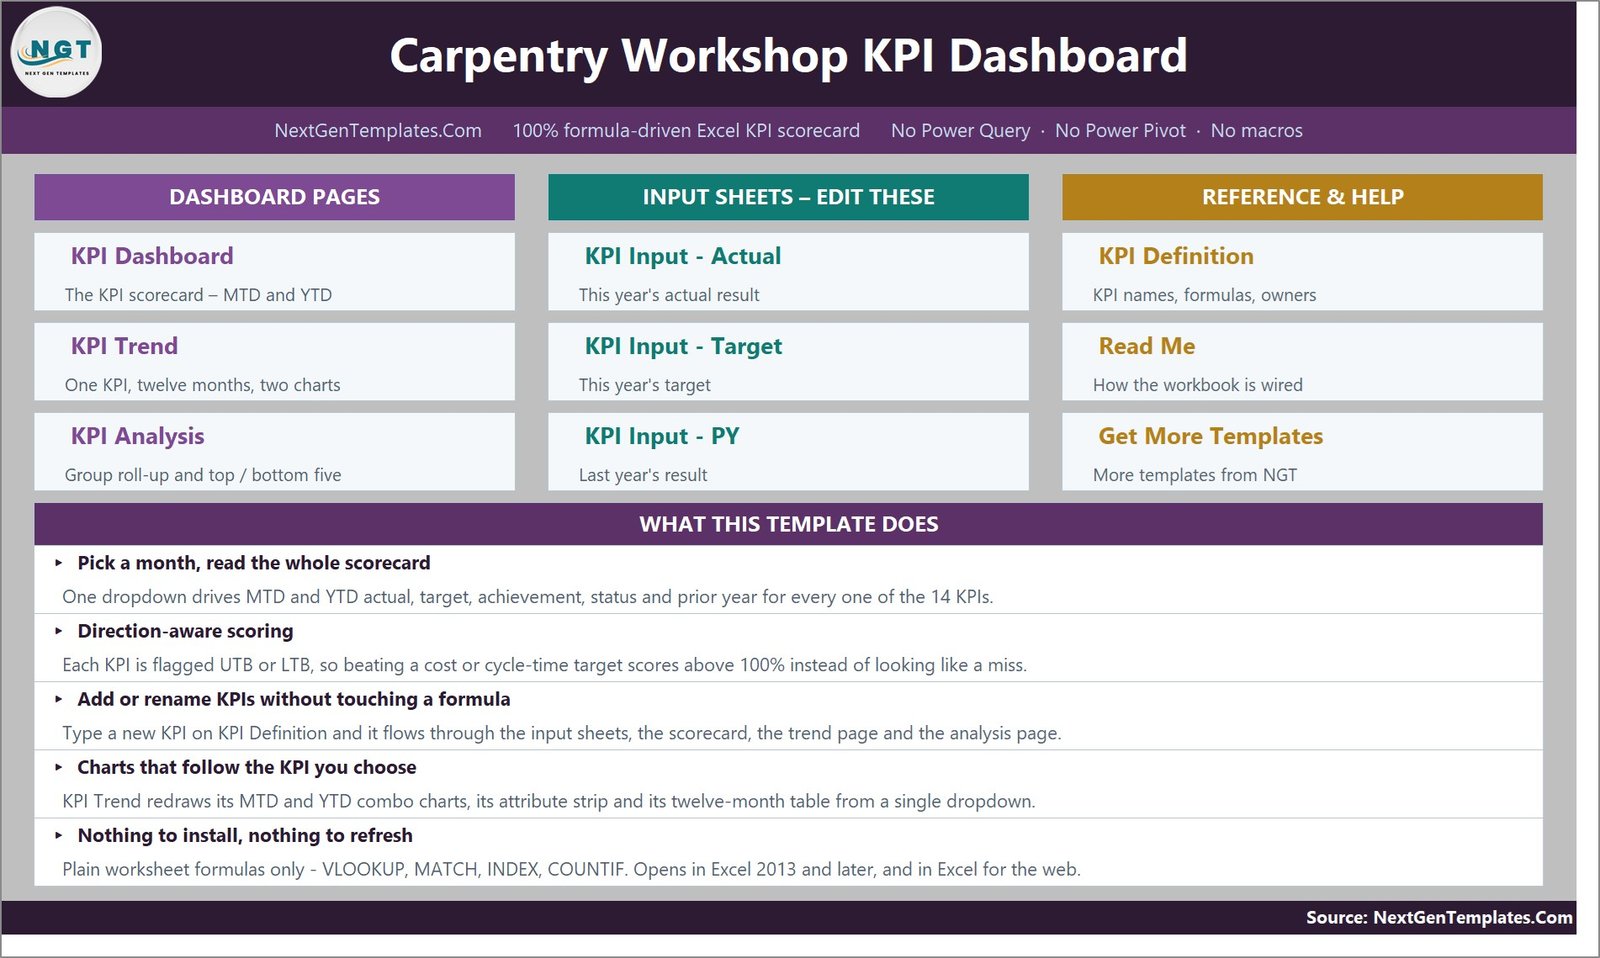
Which Template Is This?
NextGenTemplates publishes several similarly named carpentry products, and they are genuinely different builds. This one is the KPI Dashboard: a month-picker scorecard with a 14-row traffic-light grid, a dedicated KPI Trend page and a KPI Analysis page, fed by three typed input sheets. The Carpentry Workshop KPI Scorecard in Excel is the lighter, single-page card-style scorecard. Buy the one that matches how you report, not the one whose name you saw first.
Key Features of the Carpentry Workshop KPI Dashboard in Excel
- 14 carpentry KPIs in 6 groups — Material & Yield, Production & Throughput, Quality & Finish, Compliance & Safety, Delivery & Service and Cost & Margin.
- One dropdown drives everything — cell D6 on the KPI Dashboard sheet picks the month, and the seven summary cards, all 14 KPI rows and the entire KPI Analysis page follow it.
- Direction-aware scoring — each KPI is flagged UTB (Upper The Better) or LTB (Lower The Better). Achievement is Actual ÷ Target for UTB and Target ÷ Actual for LTB, so cutting Order Lead Time below target scores above 100% instead of reading as a miss.
- Traffic lights you control — On Target from 100%, At Risk 95% to 99%, Missed below 95%. The thresholds live in formulas in columns L and U and you can edit them.
- MTD and YTD side by side — actual, target, achievement, status, prior year and vs PY for both periods, on one row per KPI.
- Add or rename a KPI without touching a formula — type it on KPI Definition and it flows through the three input sheets, the scorecard, the trend page and the analysis page.
- Owner, priority and frequency per KPI — Workshop Manager, Purchasing Manager, Production Manager, Head of Joinery, QA Lead, Installations Manager, Health & Safety Officer and Commercial Manager are named on KPI Definition, so every metric has a person against it.
- A full year of sample data — 2025 actuals, targets and prior-year figures are already typed in, so the workbook works the moment you open it.
The 14 KPIs it ships with
Material & Yield: Timber Yield (Board Foot Utilisation), Offcut & Sawdust Waste Rate, Material Cost Variance vs Standard. Production & Throughput: CNC & Panel Saw Utilisation, Cabinet Units Produced, Labour Hours per Cabinet Unit. Quality & Finish: Rework Rate (Fit & Finish), Snagging Callbacks per 100 Installs. Compliance & Safety: Moisture Content Compliance, Recordable Safety Incidents per 100k Hours. Delivery & Service: On-Time Delivery to Site, Order Lead Time. Cost & Margin: Production Cost per Cabinet Unit, Gross Margin per Job.
Dashboard Pages Explanation
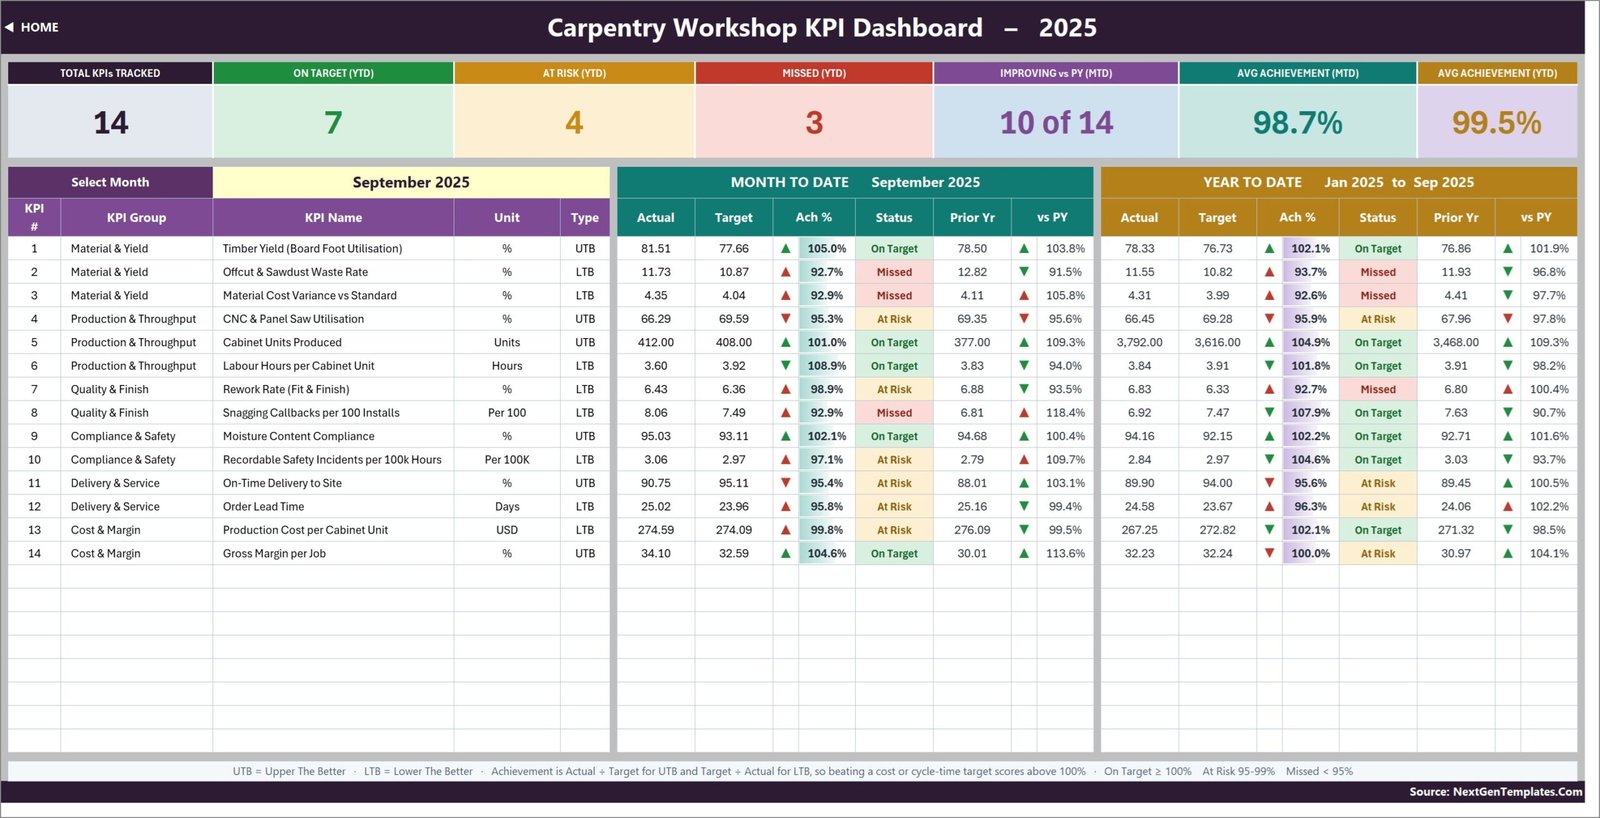
KPI Dashboard — the scorecard
Seven summary cards (Total KPIs Tracked, On Target, At Risk, Missed, Improving vs PY, Avg Achievement MTD and Avg Achievement YTD) sit above a 14-row grid split into a Month to Date block and a Year to Date block. Each row carries Actual, Target, Achievement %, Status, Prior Yr and vs PY.
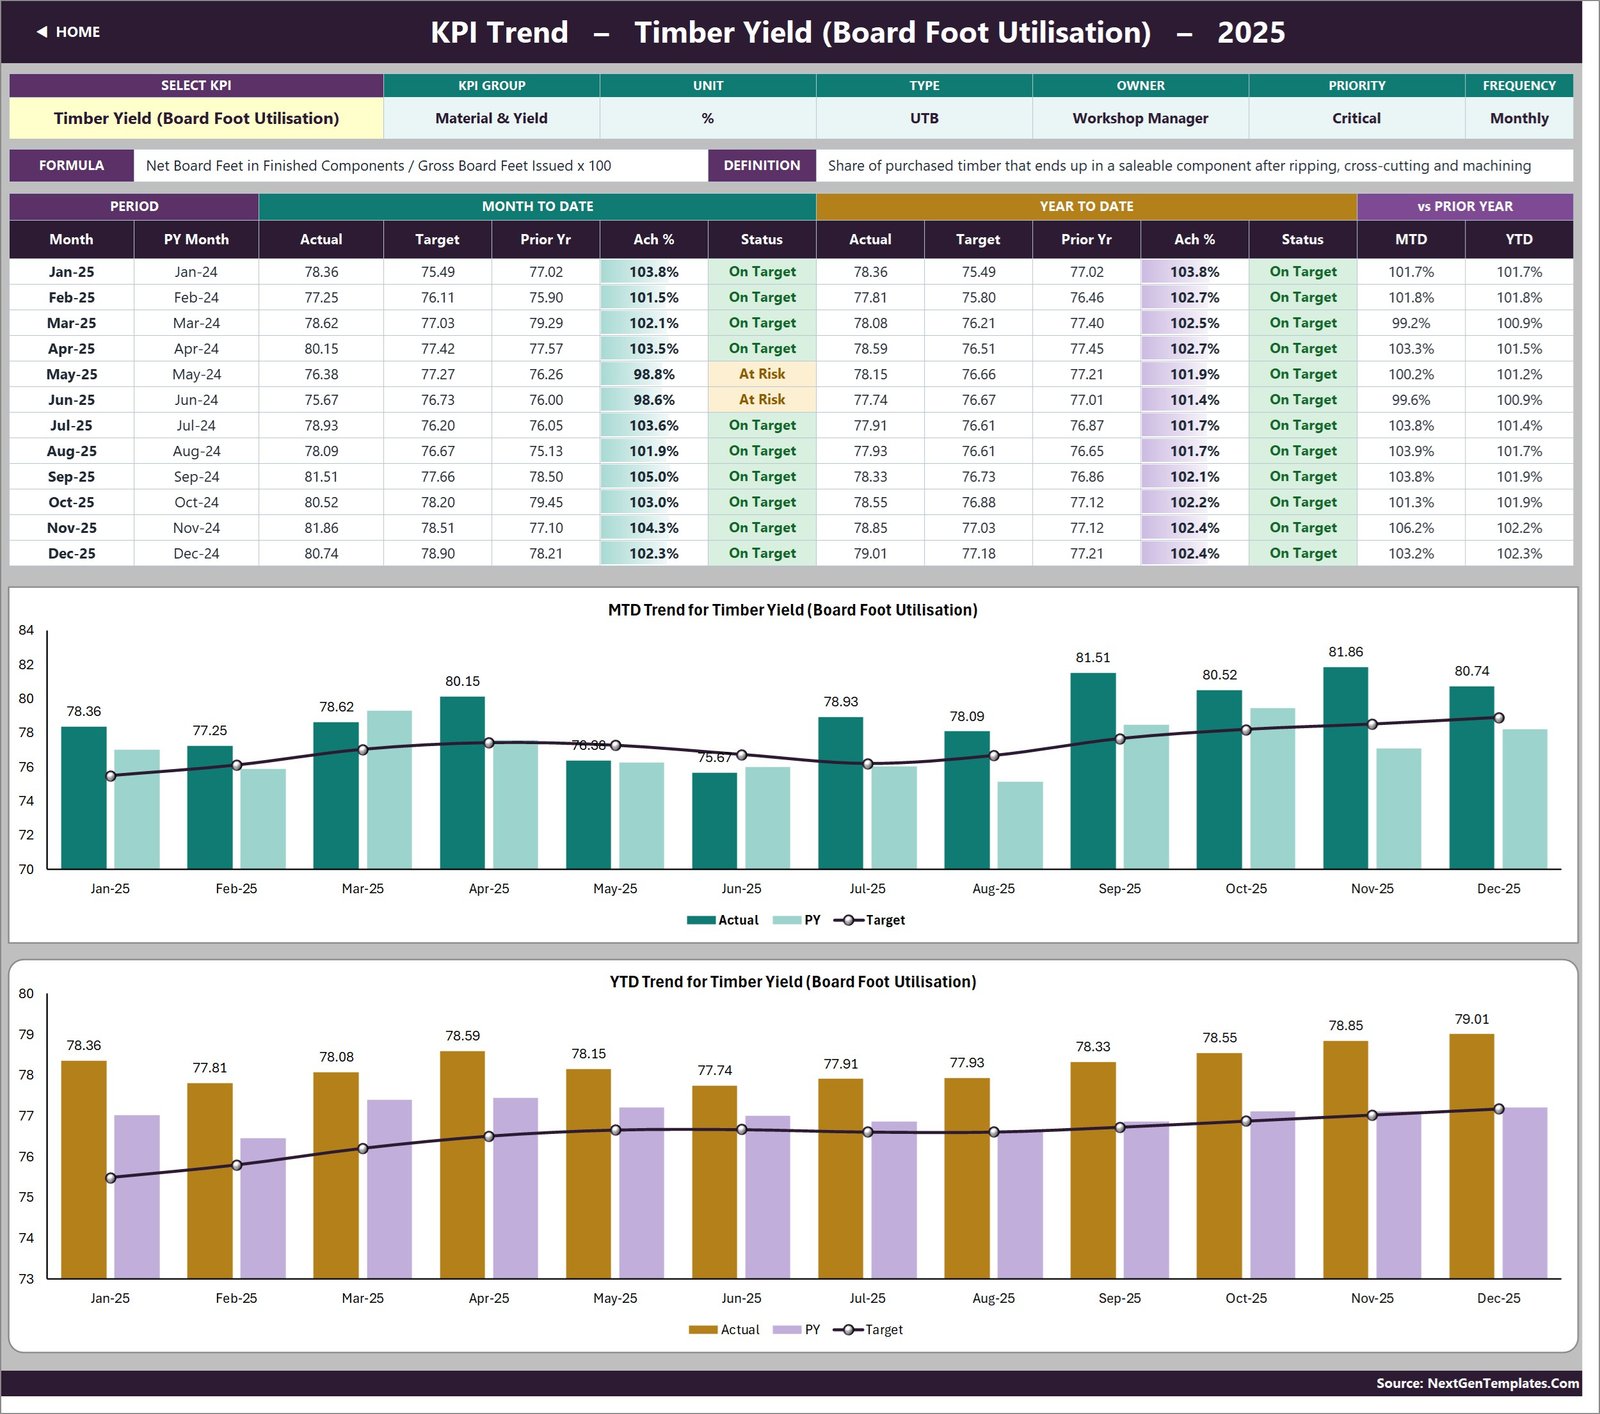
KPI Trend — one KPI, twelve months
Choose any KPI from a dropdown and the attribute strip, formula, definition and twelve-month table redraw. Charts include Timber Yield by Month and Year to Date Timber Yield by Month, each plotting actual and prior-year columns against a target line.
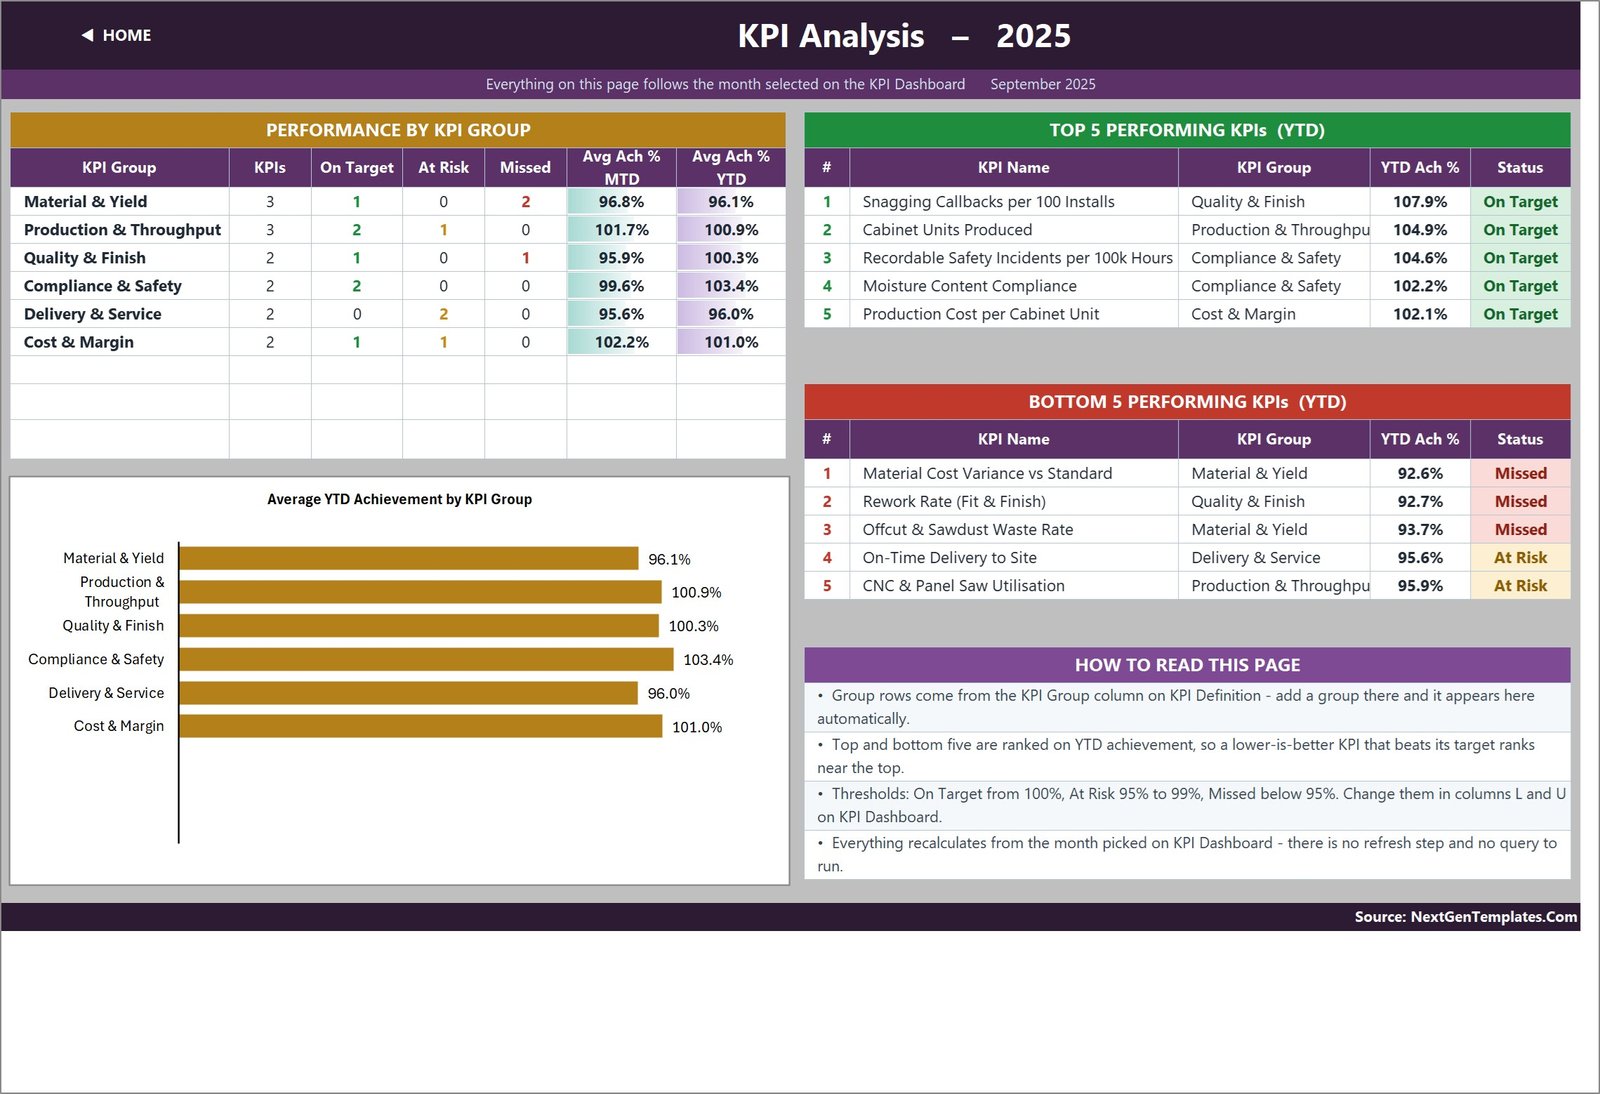
KPI Analysis — group roll-up and rankings
Performance by KPI Group counts On Target, At Risk and Missed per group alongside average achievement for MTD and YTD. Top 5 and Bottom 5 Performing KPIs rank the year to date, and the chart shows Average YTD Achievement by KPI Group.
KPI Input — Actual, Target and Prior Year
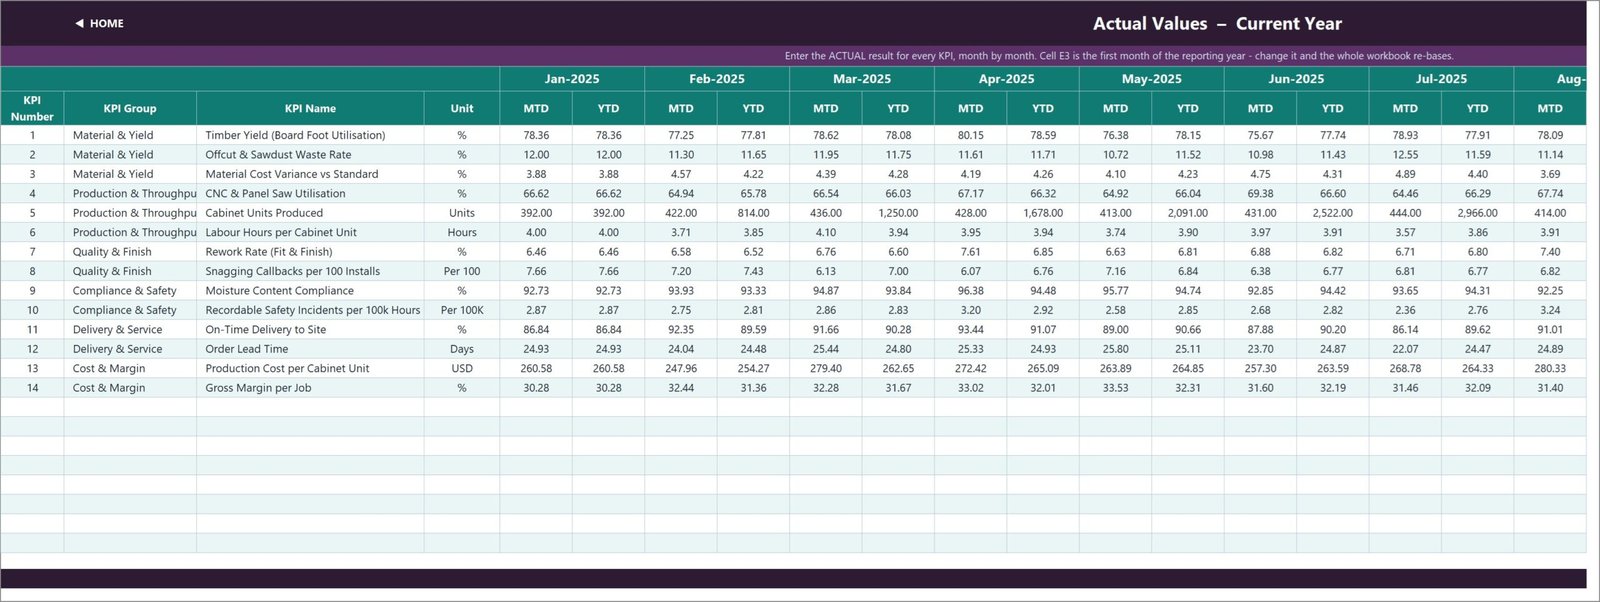
The three sheets you type in. Each holds an MTD and a YTD column for every month, and the KPI rows are driven by KPI Definition so all three always line up. Cell E3 on the Actual sheet sets the first month of the reporting year, and the Target sheet, the Prior Year sheet, the month dropdown and every sheet title re-base automatically.
KPI Definition — the master list
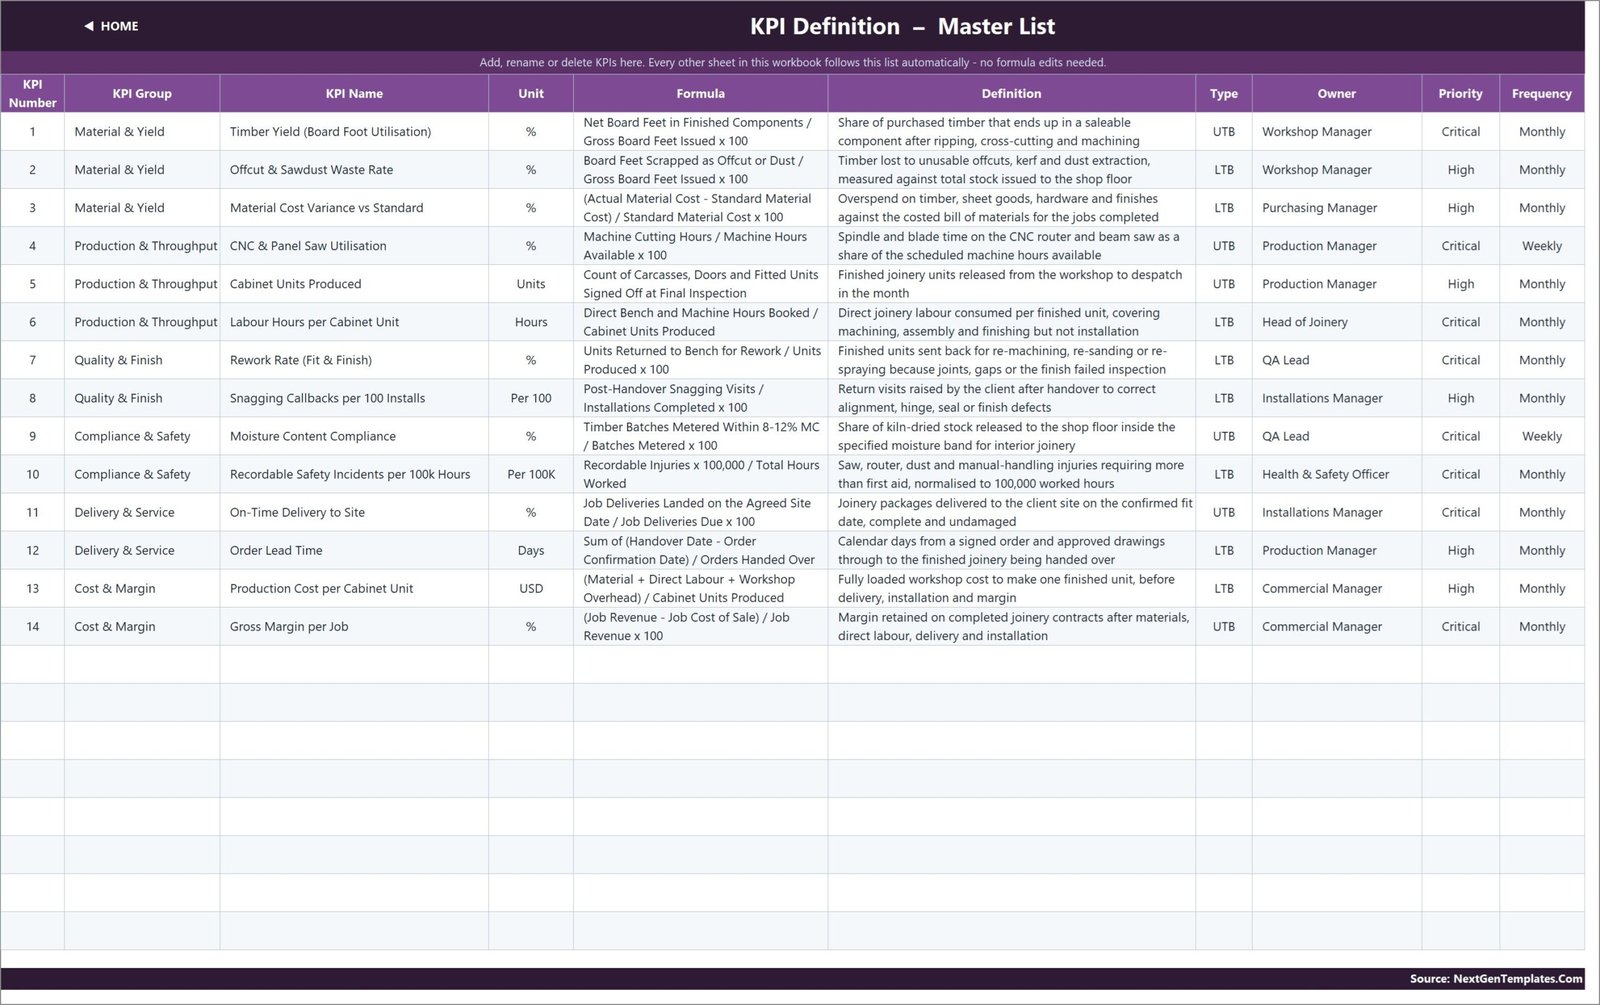
Every KPI with its group, unit, calculation formula, plain-English definition, UTB/LTB type, owner, priority and reporting frequency. This is the only sheet you edit to add, rename or remove a KPI — everything else follows it.
Read Me and Get More Templates
Read Me documents how the workbook is wired — the MTD and YTD rules, cumulative versus average YTD, the achievement maths, the status bands, the arrow logic and the sheet map. Get More Templates links back to the wider catalogue.
Carpentry Workshop KPI Dashboard in Excel vs. Google Sheets vs. Paid Workshop MRP — Feature Comparison
| Feature | Carpentry Workshop KPI Dashboard in Excel | Google Sheets equivalent | Katana MRP / MRPeasy |
|---|---|---|---|
| Cost | $12.99 one-time ✅ | $8-12 one-time | $99-359 / month |
| Platform | Excel 2013+ and Excel for the web | Browser only | Cloud only |
| Setup time | Under 10 minutes ✅ | Under 10 minutes ✅ | 2-6 weeks onboarding |
| Works offline | Yes ✅ | No | No |
| Real-time team collaboration | Via OneDrive / SharePoint | Yes ✅ | Yes ✅ |
| Customisable KPIs | Yes — 22 rows wired, no formula edits ✅ | Yes | Fixed metric set |
| UTB / LTB direction-aware scoring | Yes, per KPI ✅ | Yes | Partial |
| Formulas you can read and trace | Yes — nothing locked or hidden ✅ | Yes | No |
| Year-1 cost at 5 users | $12.99 ✅ | $8-12 | $1,188-4,308 |
For a joinery shop that wants board-foot yield, rework and margin on one page without a six-week MRP rollout, the Carpentry Workshop KPI Dashboard in Excel sits in the sweet spot.
Who Should Use This Template
Perfect for:
- Workshop and production managers at bespoke joinery, cabinet and furniture shops with 5-100 staff
- Owner-operators who need a monthly management pack for the bank, the board or a client review
- QA and health & safety leads tracking moisture-content compliance and recordable incidents per 100k hours
- Commercial managers watching gross margin per job and production cost per cabinet unit
Not a fit if:
- You want live machine-level data — this reads monthly figures you enter, it does not connect to a CNC controller or an ERP
- You need job costing, quoting, cut lists or nesting — this is a KPI scorecard, not a production planning system
- You need row-level user permissions or an audit trail; it is a workbook, not a governed application
Real-World Use Cases
Daniel runs a 22-bench bespoke kitchen workshop. He enters board feet issued and scrapped each month and watches Timber Yield and Offcut & Sawdust Waste Rate together. When yield slipped two points in May, the KPI Trend page showed it was a single month rather than a trend, so he held off re-quoting his timber supplier and saved a supply relationship he had spent four years building.
Priya is QA lead at a commercial joinery firm. She reports Moisture Content Compliance and Rework Rate (Fit & Finish) at the monthly production meeting. Because both sit in the same scorecard as Snagging Callbacks per 100 Installs, she can show the directors that tightening the kiln-dried release band cut post-handover callbacks the following quarter — a link that was invisible while the three numbers lived in three separate files.
Marcus is commercial manager at a shopfitting company. He uses the KPI Analysis page’s Bottom 5 Performing KPIs to pick one problem per quarter, and reports Gross Margin per Job and Production Cost per Cabinet Unit to the board — without paying for a cloud MRP the shop would only half-use.
Advantages of the Carpentry Workshop KPI Dashboard in Excel
- It costs once. $12.99 against $1,188 to $4,308 for a year of small-shop MRP at five seats.
- It is readable. Plain VLOOKUP, MATCH, INDEX and COUNTIF formulas — nothing is locked, hidden or compiled, so you can trace any number back to its input cell.
- It scores lower-is-better metrics honestly. Waste, lead time, rework and cost per unit are rewarded for falling, which is the single most common thing homemade KPI spreadsheets get wrong.
- It survives a change of reporting year. One cell re-bases twelve months of headers across three input sheets.
- It opens anywhere. Excel 2013 and later, Microsoft 365, and Excel for the web — no add-ins to install and nothing for IT to approve.
Opportunities for Improvement
In fairness, there are things this workbook does not do. It has no data connection — you type or paste your monthly figures, so a shop already running a live MES will find the manual step redundant. The charts are fixed to the KPI you select rather than showing several KPIs at once, which means comparing two metrics side by side takes two screenshots. The status bands are a single global rule, so a KPI that genuinely needs a tighter tolerance has to be handled by editing its own formula. And because it is a workbook rather than an application, two people editing the same copy at the same time need OneDrive co-authoring to avoid stepping on each other.
None of these are defects for the audience it is built for, but they are worth knowing before you buy.
Best Practices
- Set the reporting year first. Change cell E3 on KPI Input – Actual before you type anything else, or you will enter numbers against the wrong month headers.
- Fill the Prior Year sheet. The vs PY columns and the “Improving vs PY” card are the most persuasive part of a board pack, and they are empty until you populate last year.
- Decide cumulative versus average YTD deliberately. Counts such as Cabinet Units Produced accumulate; rates, ratios and per-unit costs should be running averages. A compliance percentage that reaches 1,100% by December is the classic sign of a KPI pack nobody checked.
- Name an owner for every KPI. The Owner column on KPI Definition is what turns a report into an action list.
- Review the Bottom 5 monthly, not the whole grid. Fourteen KPIs is too many to act on at once; the ranking page exists to narrow it to one or two.
- Keep the sample year in a spare copy so you always have a working reference to compare against if a formula gets overwritten.
If you are new to this style of reporting, Microsoft’s own guide to drop-down lists is a useful primer on how the month and KPI pickers work.
Explore Relevant Templates
Also available as: a Power BI edition of this same dashboard, the Carpentry Workshop KPI Dashboard in Power BI, is being prepared and will be listed alongside this one.
- Carpentry Workshop KPI Scorecard in Excel — the lighter single-page scorecard for the same trade.
- Carpentry Workshop KPI Scorecard in Google Sheets — the browser-based edition.
- Masonry Contractor KPI Dashboard in Excel — the same month-picker build for a masonry crew.
- Flooring Installation KPI Dashboard in Excel — yield, callbacks and margin for floor fitters.
- Job Work Order Data Entry System in Excel — capture the job data that feeds these KPIs.
You can also browse the full range of Excel Dashboard Templates on NextGenTemplates.
Frequently Asked Questions
What KPIs does the Carpentry Workshop KPI Dashboard in Excel track?
It tracks 14 KPIs: Timber Yield, Offcut & Sawdust Waste Rate, Material Cost Variance vs Standard, CNC & Panel Saw Utilisation, Cabinet Units Produced, Labour Hours per Cabinet Unit, Rework Rate, Snagging Callbacks per 100 Installs, Moisture Content Compliance, Recordable Safety Incidents per 100k Hours, On-Time Delivery to Site, Order Lead Time, Production Cost per Cabinet Unit and Gross Margin per Job.
How long does setup take?
Under 10 minutes. Open the Carpentry Workshop KPI Dashboard in Excel, set the reporting-year start month in cell E3, and paste your monthly actual, target and prior-year figures into the three input sheets. There is no refresh step, no query and no data model to rebuild.
Does it handle lower-is-better KPIs like waste and lead time correctly?
Yes. Each KPI carries a UTB or LTB flag on the KPI Definition sheet. For an LTB KPI such as Offcut & Sawdust Waste Rate or Order Lead Time, achievement is Target ÷ Actual, so beating the target scores above 100% and the traffic light turns green.
Can I add my own KPIs?
Yes. The Carpentry Workshop KPI Dashboard in Excel is wired for 22 KPIs and 14 are filled in. Fill the next empty row on KPI Definition and the new KPI appears on all three input sheets, the scorecard, the trend page and the analysis page with no formula work at all.
How does this compare to Katana MRP or MRPeasy?
Those are full manufacturing systems at $99-359 per month with a multi-week rollout. The Carpentry Workshop KPI Dashboard in Excel is a $12.99 one-time reporting layer. It will not schedule your shop floor, but it will give directors a monthly KPI pack the same week you buy it.
Do I need macros, Power Query or Power Pivot?
No. The Carpentry Workshop KPI Dashboard in Excel is 100% formula-driven — VLOOKUP, MATCH, INDEX and COUNTIF only. It opens in Excel 2013 and later and works in Excel for the web, with no add-ins and nothing to enable.
Is this the same as the Carpentry Workshop KPI Scorecard?
No. The Carpentry Workshop KPI Dashboard in Excel is the larger product, adding a dedicated KPI Trend page and a KPI Analysis page with group roll-ups and top and bottom five rankings. The scorecard is the lighter single-page edition of the same subject.
About the Author
Built by PK — Microsoft Certified Professional with 15+ years of Excel, Google Sheets and Power BI experience. Founder of NextGenTemplates, reaching 300K+ subscribers across YouTube channels. Every template is hand-built and tested before release.
Conclusion
A carpentry workshop does not fail because nobody measured anything. It fails because the six numbers that matter live in six places and nobody sees them together on the same morning. The Carpentry Workshop KPI Dashboard in Excel puts timber yield, machine utilisation, rework, safety, delivery and margin on one page, scores each one in the direction it should be scored, and compares it to both a target and last year.
👉 Click here to Purchase the Carpentry Workshop KPI Dashboard in Excel
✅ Instant download · One-time payment · No subscription · Lifetime access
🎥 For step-by-step video tutorials, visit Youtube.com/@PK-AnExcelExpert
Last updated: August 2026