PKComments Off on 
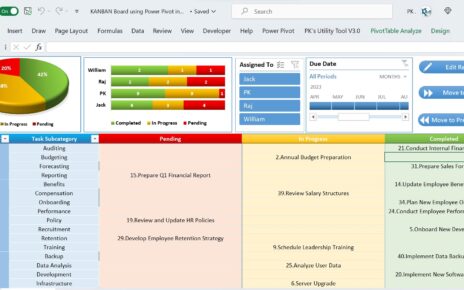
KANBAN Board with Power Pivot and VBA for Project Management
In today's fast-paced business environment, effective project management is essential for achieving success. One tool that has gained significant popularity in recent years is the KANBAN board. In this comprehensive
PKComments Off on Excel Magic: Stunning Animated Progress Circle Charts for Project Tracking
Managing projects can often be a daunting task, particularly when it comes to keeping track of progress and presenting it in a visually engaging way. This is where animated progress
PKComments Off on Dynamic KPI indicator with SEQUENCE and CEILING Function in Excel
In the competitive landscape of today's business world, tracking and analyzing key performance indicators (KPIs) is vital for assessing and improving your organization's performance. Microsoft Excel provides various functions to
PKComments Off on Mastering VStack and HStack Functions in Excel
Microsoft Excel has always been an indispensable tool for data manipulation and analysis. You can combine the data with the help of VStack and HStack functions. VStack and HStack help
PKComments Off on Highlight Sales Figures with Custom Number Formatting in Excel
When working with sales data, it can be helpful to quickly identify which sales figures are doing well and which ones need improvement. Custom number formatting in Excel allows you
PKComments Off on Enhance Your Power BI Experience with On-Object Interaction
In this article, we will discover the benefits of using on-object interaction in Power BI, learn how to enable this feature, and understand the limitations and known issues. What is
PKComments Off on Quick Dynamic Sales by Employees chart with Slicer in Excel
Excel is a powerful tool which can be used for a wide range of business applications, for analyzing data, creating charts and graphs etc. One useful feature in Excel is
PKComments Off on Half Circle KPI Charts in Excel using Doughnut Charts
Key Performance Indicators (KPIs) are metrics used to measure the success of a company or a particular project. KPIs can help businesses make informed decisions based on data, improve efficiency,
PKComments Off on Waffle chart with Football Icon in Excel
Data visualization is important part of data analysis. It enables us to better understand the data, identify trends, and make informed decisions. There are several types of charts and graphs
PKComments Off on Personal Tool Bar (PTB) in Excel Ribbon Display Options
Microsoft Excel is one of the most powerful tools available for data analysis, visualization, and management. To make the most of Excel, users need to have quick access to frequently
This website uses cookies to improve your user experience, analyze site traffic and serve targeted ads in accordance with our Privacy PolicyACCEPT
Privacy & Cookies Policy
Privacy Overview
This website uses cookies to improve your experience while you navigate through the website. Out of these cookies, the cookies that are categorized as necessary are stored on your browser as they are essential for the working of basic functionalities of the website. We also use third-party cookies that help us analyze and understand how you use this website. These cookies will be stored in your browser only with your consent. You also have the option to opt-out of these cookies. But opting out of some of these cookies may have an effect on your browsing experience.
Necessary cookies are absolutely essential for the website to function properly. This category only includes cookies that ensures basic functionalities and security features of the website. These cookies do not store any personal information.
Any cookies that may not be particularly necessary for the website to function and is used specifically to collect user personal data via analytics, ads, other embedded contents are termed as non-necessary cookies. It is mandatory to procure user consent prior to running these cookies on your website.