Managing clinic contracts has become more complex than ever. Clinics now handle multiple vendor contracts, service agreements, maintenance contracts, and outsourcing arrangements at the same time. As costs rise and compliance requirements increase, clinics need better visibility, faster insights, and stronger control. Therefore, relying on scattered spreadsheets and manual reports no longer works.
That is exactly why a Clinic Contract KPI Dashboard in Excel plays a critical role. This dashboard transforms raw contract data into clear, visual, and actionable insights. Moreover, it helps clinics track performance, control costs, ensure compliance, and make confident decisions—using a familiar and cost-effective tool like Microsoft Excel.
In this in-depth and SEO-friendly article, you will learn everything about the Clinic Contract KPI Dashboard in Excel. Additionally, you will understand how it works, its worksheet structure, advantages, best practices, and common questions. By the end, you will clearly see why this dashboard has become an essential tool for modern clinics.
Click to buy Clinic Contract KPI Dashboard in Excel
What Is a Clinic Contract KPI Dashboard in Excel?
A Clinic Contract KPI Dashboard in Excel is a structured and interactive Excel-based reporting tool designed to track, analyze, and monitor key performance indicators related to clinic contracts.
Clinics usually manage contracts such as:
- Medical equipment contracts
- Pharmaceutical supply agreements
- Facility maintenance contracts
- IT and software service contracts
- Outsourced clinical and non-clinical services
Because these contracts directly affect costs, service quality, and compliance, clinics must monitor performance continuously. Instead of managing multiple Excel files, this dashboard consolidates all contract KPIs into one centralized workbook.
As a result, decision-makers gain clarity, speed, and control without investing in expensive BI tools.
Why Do Clinics Need a Contract KPI Dashboard?
Clinic contracts involve money, risk, and accountability. However, many clinics still face challenges such as:
- No single view of contract performance
- Delayed identification of cost overruns
- Poor visibility into vendor compliance
- Manual KPI calculations and reporting errors
- Difficulty comparing current performance with targets and previous years
Therefore, clinics need a solution that simplifies monitoring and improves decision-making. A Clinic Contract KPI Dashboard in Excel solves these problems by providing:
- Centralized KPI tracking
- Automated calculations
- Visual performance indicators
- Month-to-Date (MTD) and Year-to-Date (YTD) analysis
- Target and Previous Year comparisons
How Does a Clinic Contract KPI Dashboard in Excel Work?
This dashboard works on a simple yet powerful principle: input once, analyze everywhere.
You enter actual values, targets, and previous-year data in structured input sheets. Then, Excel formulas, pivots, and charts automatically update the dashboard and trends. As a result, you always see the latest performance without manual effort.
Moreover, the dashboard allows month selection using drop-downs. Therefore, users can instantly analyze any period with just one click.
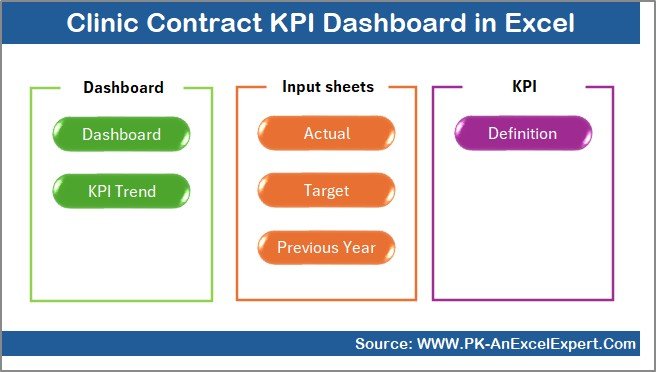
What Are the Key Features of the Clinic Contract KPI Dashboard in Excel?
This KPI dashboard includes 7 well-structured worksheets, each designed for a specific purpose. Together, they create a complete contract performance monitoring system.
Summary Page
The Summary Page works as an index or navigation hub.
Key Highlights of the Summary Page
- Acts as the landing page of the dashboard
- Contains 6 navigation buttons
- Allows users to jump directly to any worksheet
- Improves usability and saves time
Because of this structure, even non-technical users can navigate the dashboard with ease.
Click to buy Clinic Contract KPI Dashboard in Excel
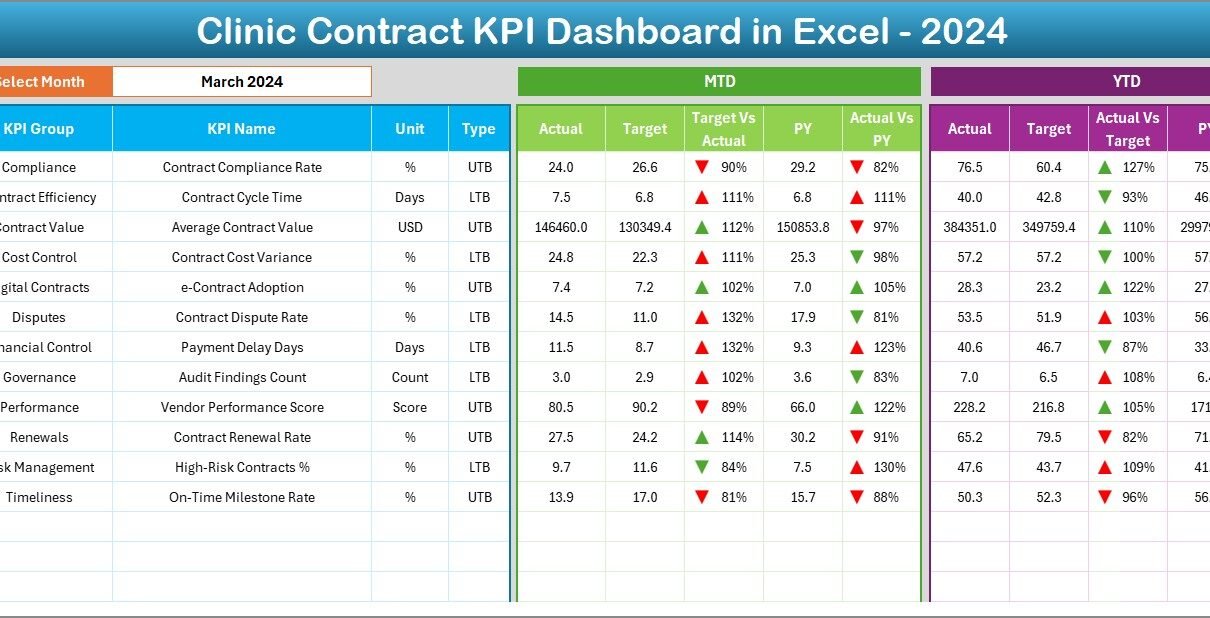
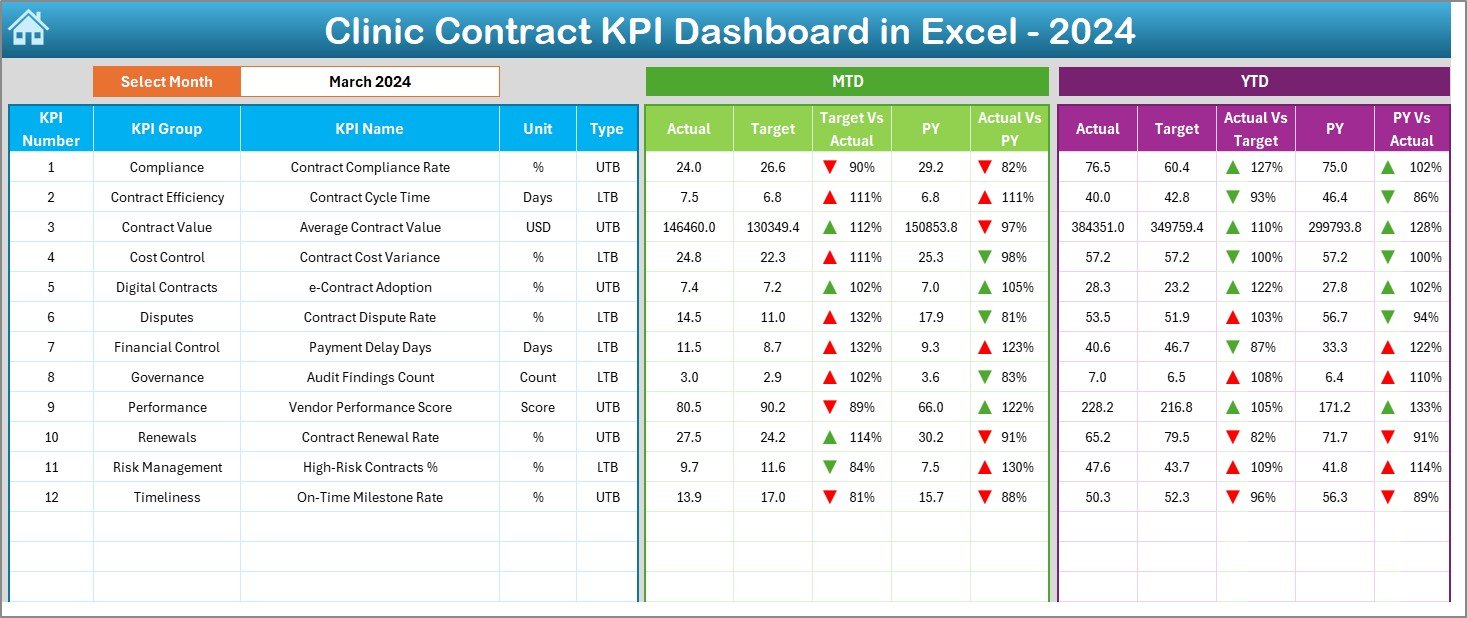
Dashboard Sheet
The Dashboard Sheet is the heart of the Clinic Contract KPI Dashboard in Excel.
Key Functionalities of the Dashboard Sheet
- Displays all KPIs in one consolidated view
- Allows month selection using a drop-down in cell D3
- Automatically updates all KPIs based on selected month
KPIs Displayed on the Dashboard
- MTD Actual, Target, and Previous Year
- Target vs Actual variance
- Previous Year vs Actual variance
- YTD Actual, Target, and Previous Year
- Visual indicators with conditional formatting arrows
Because of these visuals, users can instantly identify:
- Overperforming contracts
- Underperforming vendors
- Cost overruns or savings
- Compliance gaps
Click to buy Clinic Contract KPI Dashboard in Excel
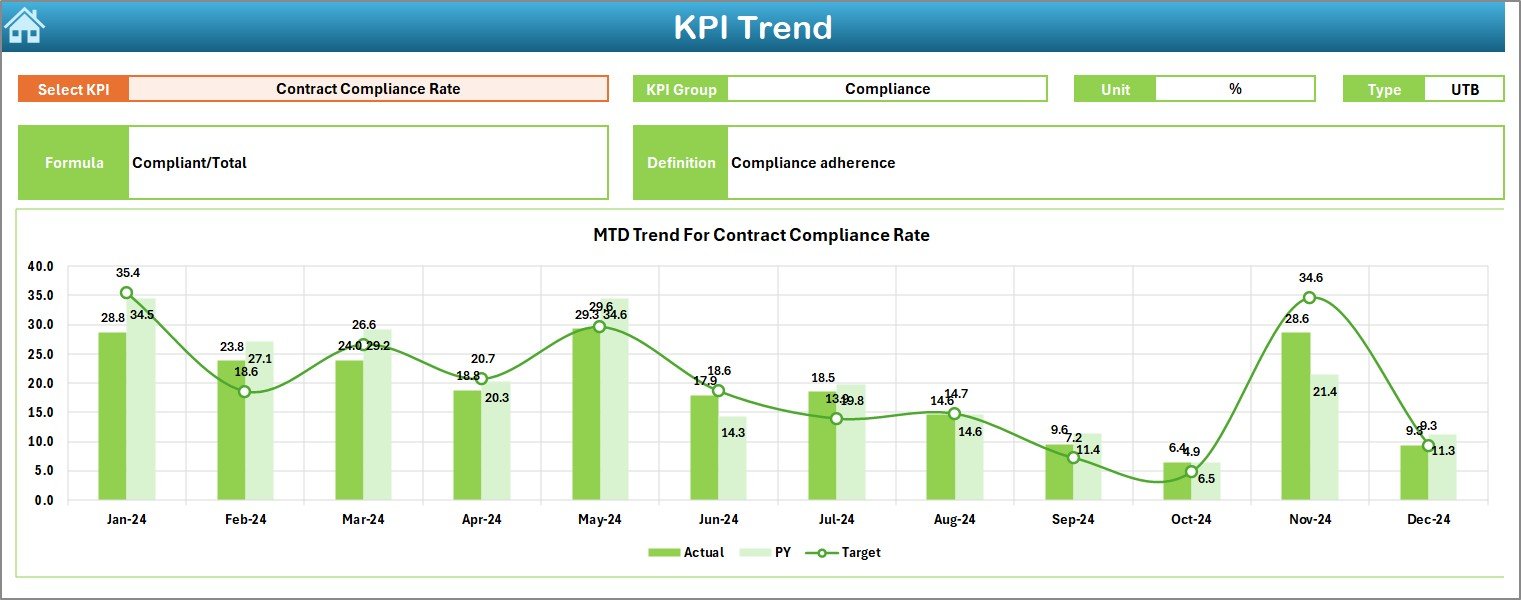
Trend Sheet
The Trend Sheet focuses on deeper KPI analysis over time.
Key Features of the Trend Sheet
- KPI selection drop-down in cell C3
Displays:
KPI Group
Unit of KPI
KPI Type (Lower the Better or Upper the Better)
KPI Formula
KPI Definition
Visual Trend Analysis
Shows MTD trend charts for Actual, Target, and Previous Year
- Shows YTD trend charts for Actual, Target, and Previous Year
Therefore, users can easily analyze patterns, improvements, or declines across months.
Click to buy Clinic Contract KPI Dashboard in Excel
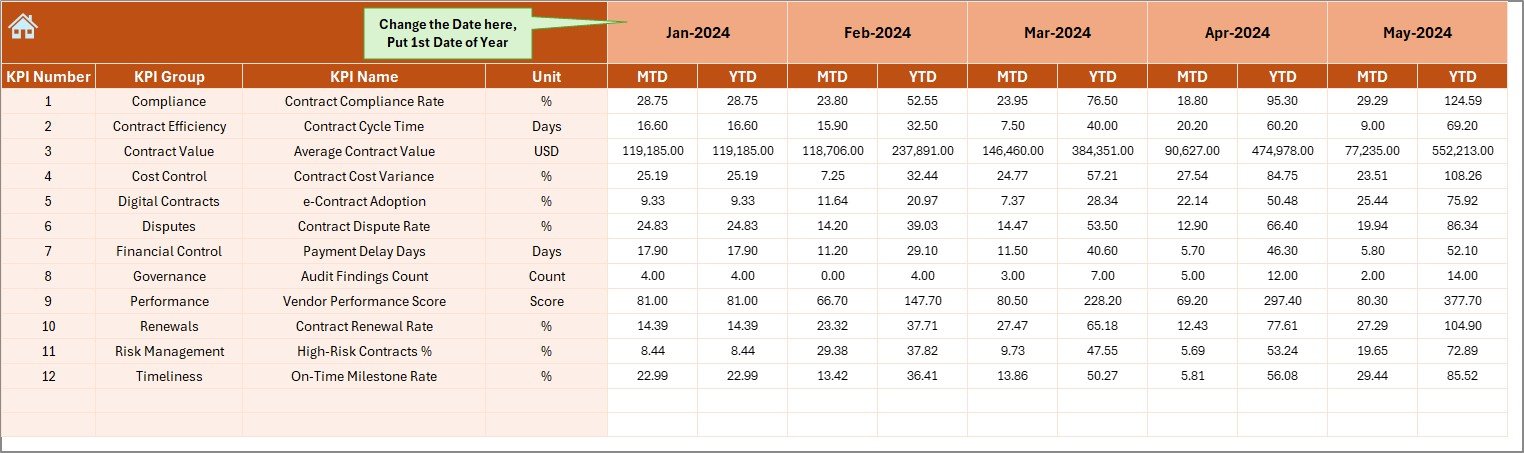
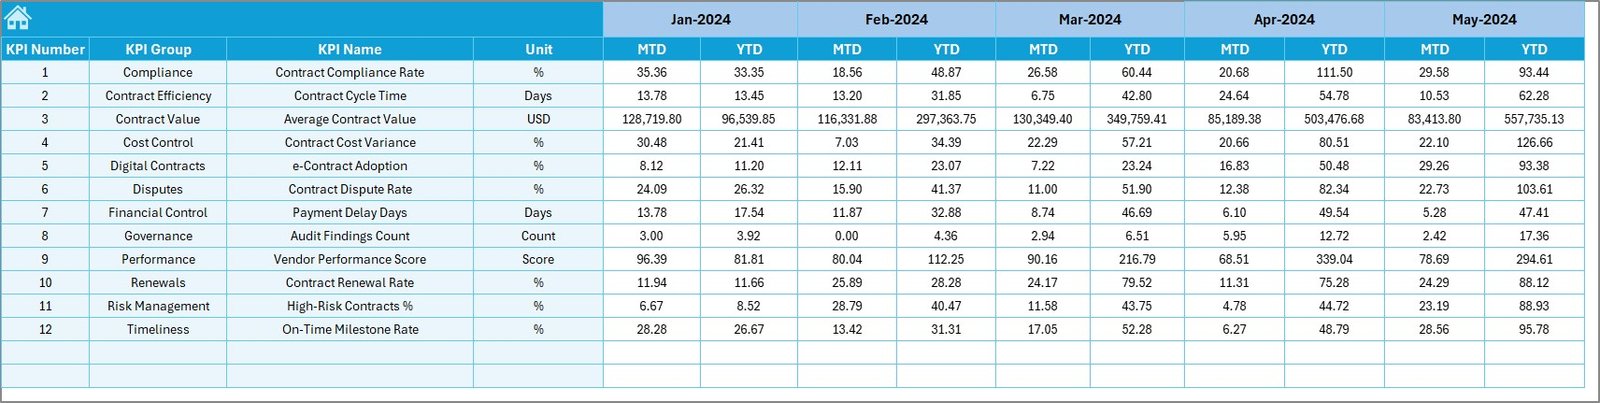
Actual Numbers Input Sheet
The Actual Numbers Input Sheet captures real performance data.
How This Sheet Works
- Enter MTD and YTD actual values for each KPI
- Change the month from cell E1
- Input the first month of the year once, and Excel handles the rest
Because this sheet separates data entry from analysis, it reduces errors and improves data integrity.
Click to buy Clinic Contract KPI Dashboard in Excel
Target Sheet Important
The Target Sheet defines performance expectations.
Key Benefits of the Target Sheet
- Enter monthly MTD and YTD targets for each KPI
- Enables automated Target vs Actual analysis
- Helps clinics set clear goals and benchmarks
As a result, clinics can align contract performance with strategic objectives.
Click to buy Clinic Contract KPI Dashboard in Excel
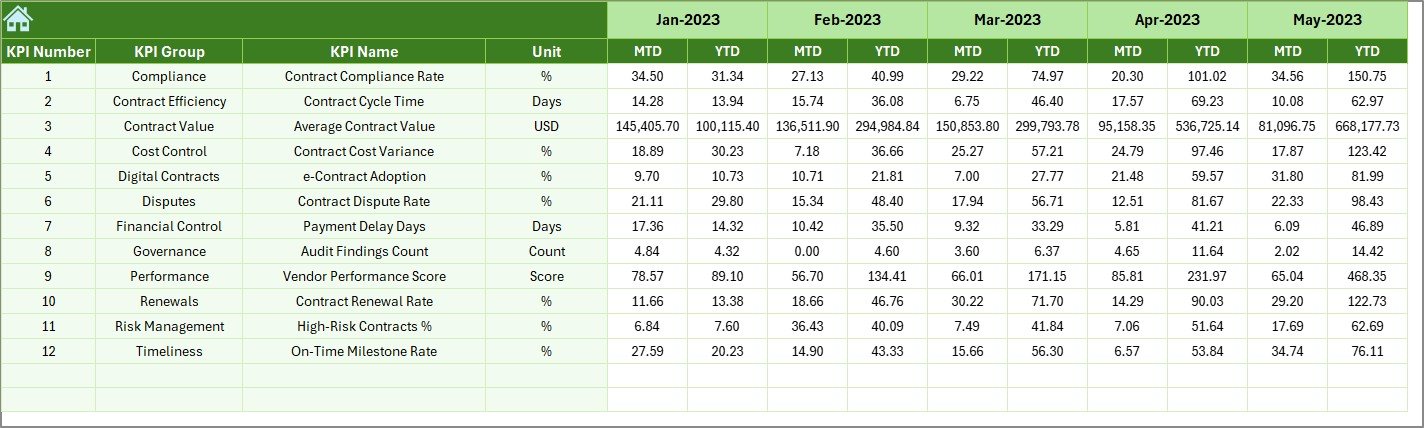
Previous Year Numbers Sheet
The Previous Year Numbers Sheet enables historical comparison.
Why This Sheet Matters
- Enter last year’s MTD and YTD values
- Enables year-over-year performance analysis
- Helps identify improvement, decline, or stability
Because of this comparison, clinics can measure long-term contract effectiveness.
Click to buy Clinic Contract KPI Dashboard in Excel
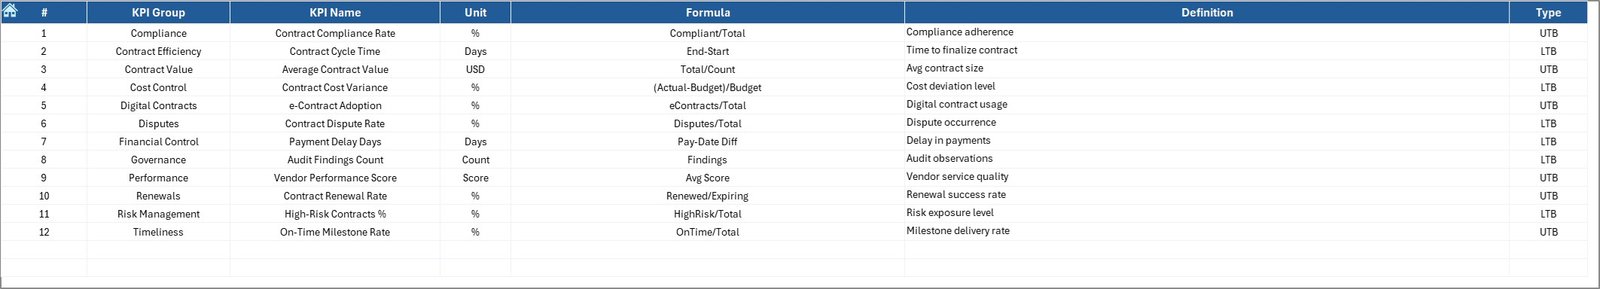
KPI Definition Sheet
The KPI Definition Sheet acts as a reference guide.
Information Stored in This Sheet
- KPI Name
- KPI Group
- Unit
- Formula
- KPI Definition
This sheet ensures clarity and consistency across teams. Moreover, it helps new users understand KPIs quickly.
Click to buy Clinic Contract KPI Dashboard in Excel
Advantages of the Clinic Contract KPI Dashboard in Excel
Using a Clinic Contract KPI Dashboard in Excel delivers multiple benefits.
Key Advantages
- Centralized Contract Monitoring
Track all contract KPIs in one structured dashboard. - Time Savings
Eliminate manual reporting and repetitive calculations. - Clear Performance Visibility
Instantly identify gaps using visual indicators. - MTD and YTD Analysis
Monitor short-term and long-term performance together. - Historical Comparison
Compare current performance with previous years. - Cost Control
Detect overruns early and take corrective action. - No Advanced Tools Required
Works entirely in Excel, without BI software.
Who Can Use a Clinic Contract KPI Dashboard?
This dashboard suits many healthcare roles.
Ideal Users Include
- Clinic administrators
- Contract managers
- Finance and procurement teams
- Operations managers
- Compliance officers
Because Excel is widely used, teams can adopt this dashboard quickly.
Best Practices for the Clinic Contract KPI Dashboard in Excel
To get the maximum value, clinics should follow proven best practices.
- Define Clear KPIs
Always select KPIs that directly link to contract goals, costs, and compliance.
- Keep Data Entry Consistent
Use standardized units and formats across all input sheets.
- Update Data Regularly
Enter actuals, targets, and previous-year data on a fixed schedule.
- Use MTD and YTD Together
Analyze short-term performance while keeping long-term goals in focus.
- Review Trends Monthly
Use the Trend Sheet to identify patterns before issues grow.
- Train Users Properly
Ensure all users understand KPI definitions and dashboard navigation.
Common KPIs Used in Clinic Contract Dashboards
Although KPIs vary by clinic, common examples include:
- Contract compliance rate
- Cost variance percentage
- Vendor performance score
- Contract renewal success rate
- Service-level agreement (SLA) adherence
- Contract cycle time
Selecting the right KPIs ensures meaningful insights.
How Does This Dashboard Improve Decision-Making?
This dashboard converts numbers into insights. Instead of guessing, managers rely on data. Therefore, decisions become faster, clearer, and more confident.
Moreover, visual cues help stakeholders understand performance instantly. As a result, clinics act proactively rather than reactively.
Conclusion: Why the Clinic Contract KPI Dashboard in Excel Matters
A Clinic Contract KPI Dashboard in Excel offers a powerful yet simple way to manage contract performance. It centralizes data, automates analysis, and provides actionable insights. Furthermore, it improves cost control, compliance, and vendor accountability.
Because it runs entirely in Excel, clinics avoid costly software while gaining professional-level analytics. Therefore, this dashboard becomes an essential tool for any clinic that wants clarity, control, and confidence in contract management.
Frequently Asked Questions (FAQs)
What is a Clinic Contract KPI Dashboard in Excel?
It is an Excel-based tool that tracks and analyzes clinic contract performance using KPIs.
Can small clinics use this dashboard?
Yes, small clinics benefit greatly because Excel keeps costs low and usability high.
Does this dashboard require advanced Excel skills?
No, basic Excel knowledge is enough to use and maintain it.
Can I customize KPIs in the dashboard?
Yes, the KPI Definition Sheet allows full customization.
How often should data be updaated?
Clinics should update data monthly for accurate MTD and YTD analysis.
Is this dashboard suitable for audits?
Yes, it improves transparency and supports audit readiness.
Visit our YouTube channel to learn step-by-step video tutorials
Watch the step-by-step video tutorial:
Click to buy Clinic Contract KPI Dashboard in Excel