The co-working industry has transformed the way individuals, startups, and businesses operate. Flexible working environments, cost savings, and collaboration opportunities have fueled rapid growth in this sector. However, with increasing demand comes the need for efficient operations and measurable insights. This is where a Co-working Space KPI Dashboard in Power BI becomes essential.
A well-structured dashboard offers managers a clear view of performance indicators such as occupancy, revenue, customer satisfaction, and operational efficiency. Instead of relying on fragmented reports, decision-makers can track everything in one place, ensuring smarter and faster decisions.
Click to Purchases Co-working Space KPI Dashboard in Power BI
In this article, we will explore the structure, features, advantages, and best practices of a Co-working Space KPI Dashboard in Power BI, along with practical guidance on implementation.
What Is a Co-working Space KPI Dashboard?
A KPI Dashboard for Co-working Spaces is a visual tool that consolidates critical performance data into an easy-to-understand format. It helps operators monitor space utilization, revenue streams, customer engagement, and service quality.
Power BI, Microsoft’s powerful business intelligence tool, provides interactive visuals, drill-through analysis, and automated updates, making it the ideal platform for creating such dashboards.
The dashboard typically connects to data sources like Excel, booking systems, or CRMs, ensuring real-time performance monitoring.
Key Features of the Co-working Space KPI Dashboard
The Co-working Space KPI Dashboard in Power BI has three main pages and integrates seamlessly with an Excel data source. Each page provides unique insights tailored to different levels of analysis.
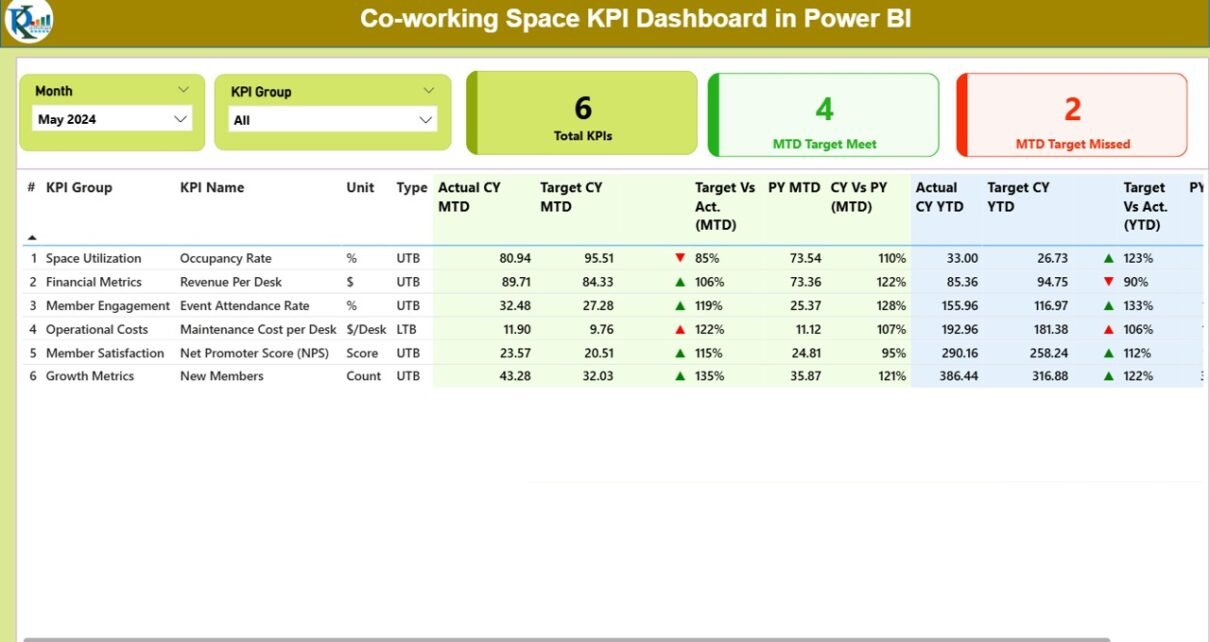
Summary Page
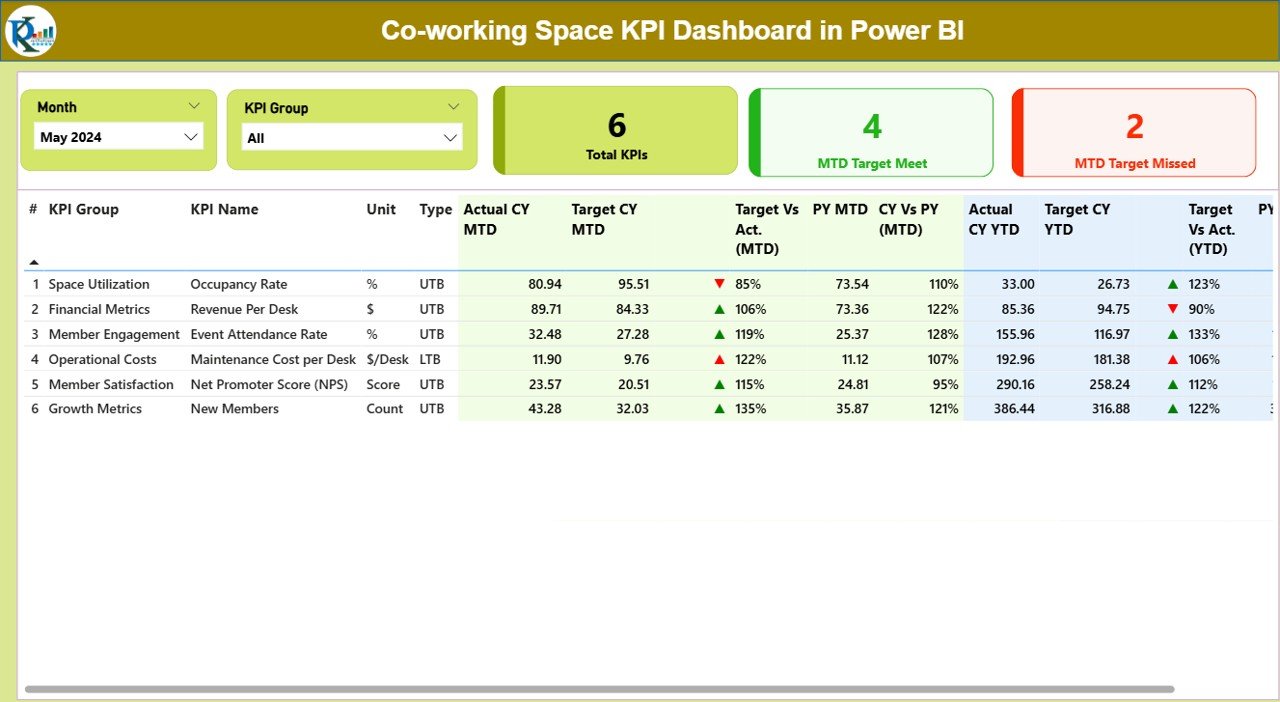
The Summary Page acts as the central hub of the dashboard. It includes:
-
Slicers for Month and KPI Group: Easily filter the data by time period or performance category.
Cards for Quick Metrics:
- Total KPIs Count
- MTD (Month-to-Date) Target Met
- MTD Target Missed
Detailed KPI Table with:
- KPI Number – Sequential identification of each KPI.
- KPI Group – Category or department associated with the KPI.
- KPI Name – Clear title of the metric.
- Unit – Measurement unit (%, $, hrs, etc.).
- Type – LTB (Lower the Better) or UTB (Upper the Better).
- Actual vs Target Values – For both MTD and YTD.
- Icons (▲/▼) – Indicating whether the KPI is on track.
- Year-over-Year Comparisons – To measure growth against the previous year.
This page provides decision-makers with a quick snapshot of overall performance.
Click to Purchases Co-working Space KPI Dashboard in Power BI
KPI Trend Page
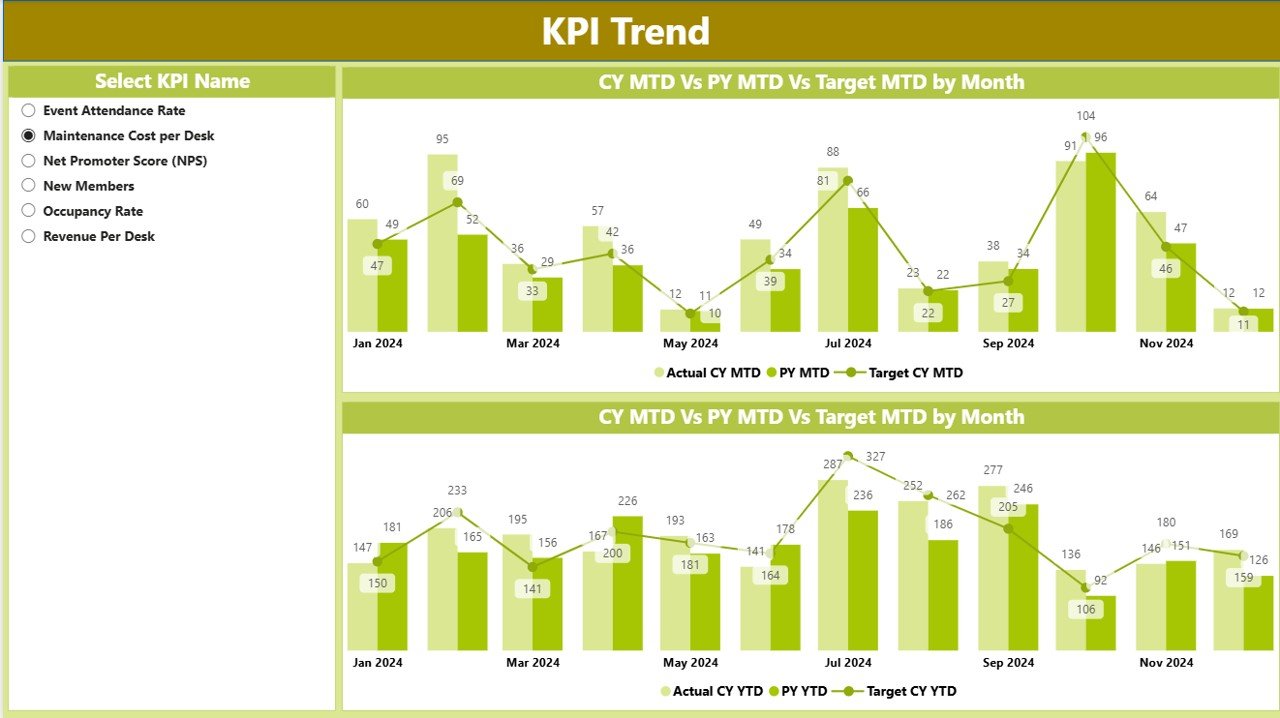
The KPI Trend Page focuses on visualizing progress over time. Key highlights include:
-
Combo Charts displaying Actuals, Targets, and Previous Year values for both MTD and YTD.
-
KPI Selector Slicer allowing users to analyze a specific KPI in depth.
This page makes it easy to identify seasonal patterns, growth trajectories, or warning signals.
KPI Definition Page
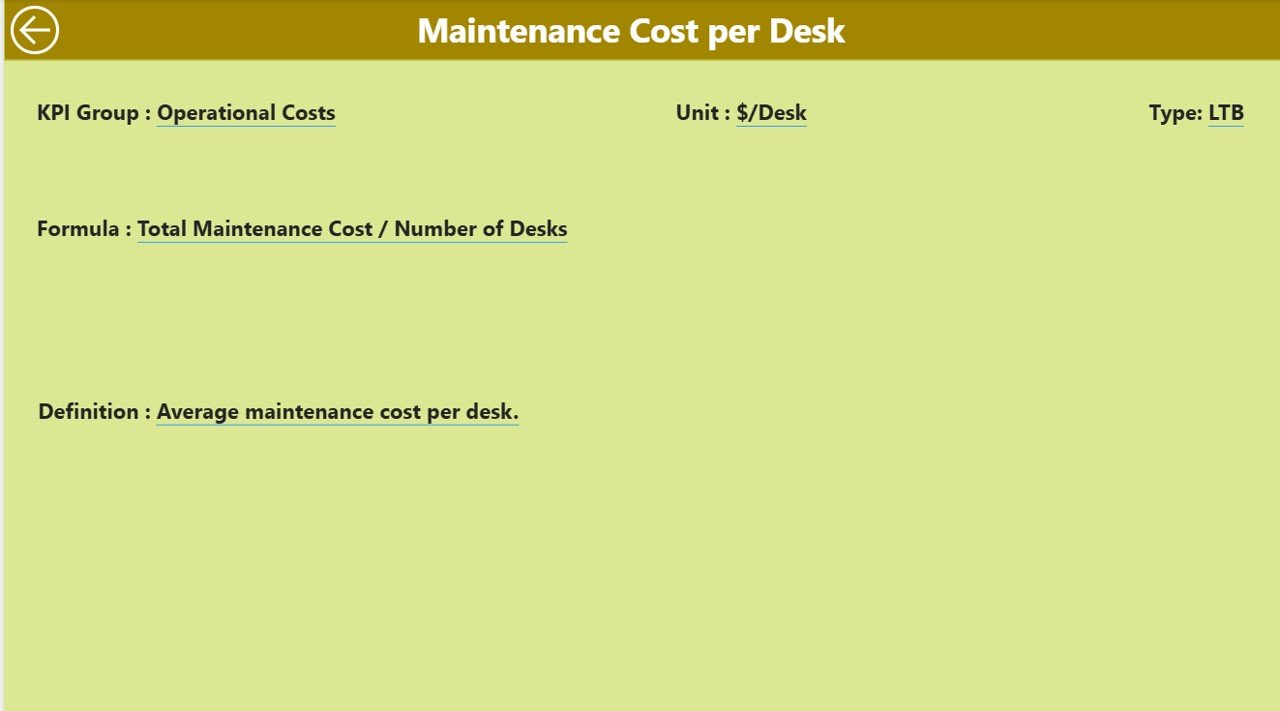
The KPI Definition Page serves as a reference sheet and is available through drill-through navigation. It provides:
-
Formula Details – The exact calculation used for each KPI.
-
KPI Definitions – Clear explanations for context.
Users can return to the summary with a single click on the back button.
Data Source: Excel Integration
The dashboard uses Excel as its primary data source, making it flexible and user-friendly.
Input Sheets:
-
Input_Actual: Records KPI name, month (first date of the month), MTD numbers, and YTD numbers.
-
Input_Target: Captures monthly and yearly targets for each KPI.
-
KPI Definition: Includes KPI Number, Group, Name, Unit, Formula, Definition, and Type (LTB/UTB).
This structure ensures that users only need to update the Excel file for the dashboard to refresh automatically in Power BI.
Why Co-working Spaces Need KPI Dashboards
Co-working businesses operate in highly competitive environments. Tracking performance metrics ensures sustainability and growth. Without a dashboard, managers may struggle with:
-
Fragmented Reports spread across departments.
-
Manual Updates prone to errors.
-
Lack of Real-time Insights leading to delayed decisions.
A KPI Dashboard centralizes data and ensures proactive management.
Advantages of Co-working Space KPI Dashboard
Implementing a KPI dashboard in Power BI brings several advantages:
✅ Real-Time Monitoring – Stay updated with the latest performance data.
✅ Enhanced Decision-Making – Quick access to insights allows data-driven actions.
✅ Increased Efficiency – Save time by avoiding manual report consolidation.
✅ Year-over-Year Comparison – Understand long-term growth patterns.
✅ Visualization of Trends – Identify occupancy cycles or customer churn.
✅ Better Resource Allocation – Allocate space and services where needed most.
✅ Goal Tracking – Measure actual results against targets for accountability.
Best Practices for the Co-working Space KPI Dashboard
To maximize the benefits of your dashboard, follow these best practices:
1. Define Clear KPIs
Ensure every KPI is directly linked to business objectives such as occupancy, revenue growth, or member satisfaction. Avoid vanity metrics.
2. Keep the Dashboard Simple
Do not overload the dashboard with too many visuals. Focus on clarity and relevance.
3. Use Slicers Effectively
Allow users to filter data by month, location, or service type for flexible analysis.
4. Standardize Data Entry
Maintain consistent naming conventions and data formats in Excel to avoid errors.
5. Automate Updates
Leverage Power BI’s refresh schedule so the dashboard always shows the latest data.
6. Encourage User Training
Provide training sessions so team members understand how to read and interpret dashboard insights.
7. Regularly Review KPIs
Business priorities evolve, so update KPIs regularly to stay aligned with organizational goals.
How to Implement the Dashboard
-
Identify Business Objectives – Define what success looks like (e.g., 90% occupancy, 20% revenue growth).
-
List KPIs – Finalize the metrics you want to track.
-
Prepare Excel Data – Populate Actual, Target, and Definition sheets.
-
Build Power BI Dashboard – Import data, design visuals, and apply filters.
-
Validate Accuracy – Cross-check numbers against source systems.
-
Deploy and Train – Roll out the dashboard and train stakeholders.
Real-world Applications
Co-working operators can use the dashboard for:
-
Occupancy Monitoring – Track desk, cabin, and meeting room utilization.
-
Revenue Management – Compare actual revenue with targets.
-
Customer Insights – Analyze member satisfaction survey KPIs.
-
Operational Performance – Measure staff responsiveness and facility management.
-
Growth Strategy – Evaluate expansion plans based on historical trends.
Opportunities for Improvement
Even with a powerful dashboard, continuous improvement is necessary. Some areas include:
-
Expanding data sources beyond Excel to include CRM or booking systems.
-
Adding predictive analytics to forecast occupancy and revenue.
-
Incorporating customer feedback sentiment analysis.
-
Creating mobile-friendly versions for on-the-go access.
Conclusion
The Co-working Space KPI Dashboard in Power BI is more than just a reporting tool. It empowers businesses to make smarter decisions, streamline operations, and enhance customer experiences. By consolidating critical data into interactive visuals, managers can shift from reactive problem-solving to proactive strategy execution.
Adopting such dashboards ensures co-working spaces remain competitive, profitable, and future-ready.
Frequently Asked Questions (FAQs)
1. What is a KPI dashboard in Power BI?
A KPI dashboard in Power BI is a visual reporting tool that displays key performance metrics in an interactive format, helping businesses track progress toward goals.
2. Why do co-working spaces need KPI dashboards?
They need KPI dashboards to monitor occupancy, revenue, and customer satisfaction efficiently, ensuring business growth and sustainability.
3. Can I customize the Co-working Space KPI Dashboard?
Yes. You can add, remove, or modify KPIs, visuals, and filters to suit your business requirements.
4. How does Excel integrate with Power BI for this dashboard?
Excel acts as the data source. When you update numbers in Excel, Power BI refreshes automatically to reflect the latest data.
5. What are common KPIs for co-working spaces?
Common KPIs include occupancy rate, revenue per seat, customer satisfaction score, churn rate, and facility utilization.
6. Is Power BI suitable for small co-working businesses?
Yes. Power BI is cost-effective and scalable, making it ideal for both small and large co-working operators.
7. Can this dashboard handle multiple locations?
Yes. By structuring your data correctly, you can track KPIs across multiple co-working locations.
Visit our YouTube channel to learn step-by-step video tutorials