Cold chain logistics plays a critical role in industries such as pharmaceuticals, food & beverages, agriculture, chemicals, and biotechnology. These industries depend on strict temperature control to protect product quality, safety, and compliance. However, managing cold chain operations without a structured analytics system quickly leads to delays, losses, and profit erosion.
That is exactly why a Cold Chain Logistics Dashboard in Excel becomes an essential business tool.
In this in-depth, SEO-optimized guide, you will learn what a Cold Chain Logistics Dashboard in Excel is, why it matters, how it works, its page structure, key features, advantages, best practices, and frequently asked questions. Moreover, this article explains how a ready-to-use Excel dashboard helps logistics teams gain real-time visibility, reduce delays, and improve profitability.
Click to Purchases Cold Chain Logistics Dashboard in Excel
What Is a Cold Chain Logistics Dashboard in Excel?
A Cold Chain Logistics Dashboard in Excel is a centralized, visual, and data-driven reporting system designed to track, monitor, and analyze cold chain logistics performance using Microsoft Excel.
Instead of managing scattered spreadsheets, manual reports, and disconnected data files, this dashboard consolidates all logistics metrics into a single interactive Excel workbook. As a result, decision-makers gain instant insights into shipments, carriers, routes, costs, revenue, delays, and profit margins.
Because the dashboard runs entirely in Excel, teams can update data easily without complex systems or advanced technical skills.
Why Is Cold Chain Logistics Monitoring So Important?
Cold chain logistics operates under strict constraints. Even a small delay or temperature deviation can result in product spoilage, regulatory violations, or customer dissatisfaction.
Without proper monitoring, organizations often face:
-
Increased delayed shipments
-
Higher logistics costs
-
Reduced profit margins
-
Limited visibility across carriers and routes
-
Difficulty identifying performance issues
-
Reactive decision-making
Therefore, companies must track logistics performance continuously. A Cold Chain Logistics Dashboard in Excel provides that visibility while remaining flexible and cost-effective.
How Does a Cold Chain Logistics Dashboard in Excel Work?
The dashboard works by pulling structured logistics data from a data sheet and converting it into visual insights across multiple analytical pages.
Data Flow Explained
-
Data Entry
Logistics data such as shipment dates, origin country, destination country, product type, carrier name, cost, revenue, profit, transit days, and shipment status gets stored in a dedicated data sheet. -
Data Processing
Excel formulas, pivot tables, and calculated fields process the raw data into meaningful KPIs. -
Visualization
Charts, KPI cards, and slicers transform data into easy-to-understand visuals. -
Interactive Filtering
Right-side slicers allow users to filter results dynamically by month, product type, carrier, or country.
As a result, users explore insights instantly without manual recalculation.
What Are the Key Features of the Cold Chain Logistics Dashboard in Excel?
This ready-to-use Cold Chain Logistics Dashboard in Excel comes with a structured layout and powerful analytics.
Page Navigator for Seamless Navigation
A page navigator located on the left side allows users to move effortlessly between analytical pages. This feature improves usability and ensures smooth navigation across the dashboard.
How Is the Dashboard Structured? (Page-Wise Breakdown)
The dashboard includes five analytical pages, each designed for a specific performance view.
What Does the Overview Page Show?
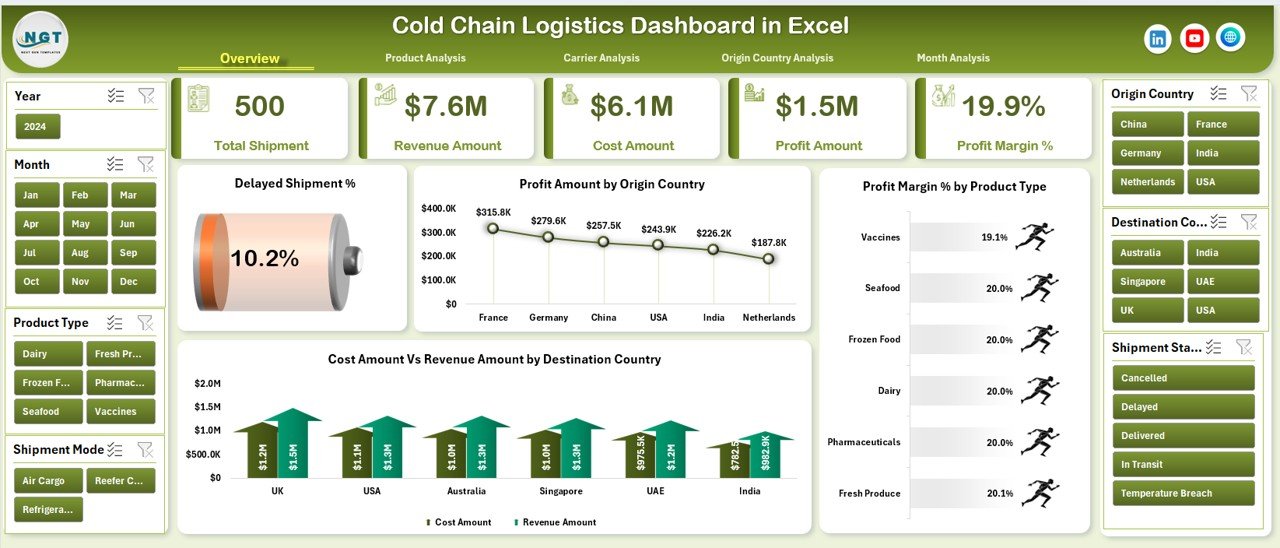
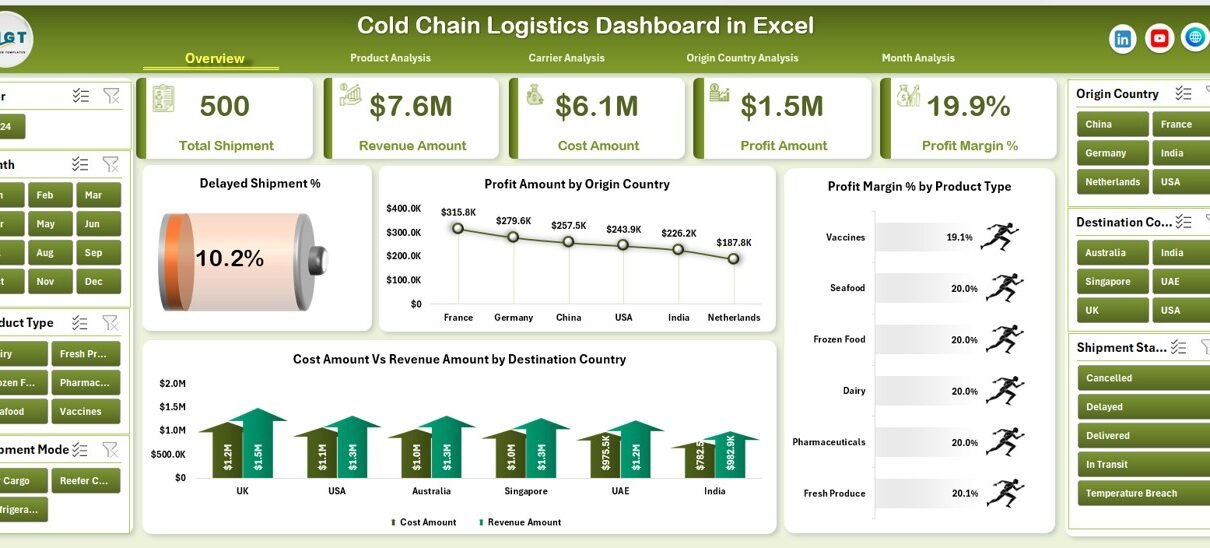
The Overview Page acts as the executive summary of cold chain performance.
Key Elements of the Overview Page
-
Right-side slicer for dynamic filtering
-
Four KPI cards for quick performance highlights
-
Four interactive charts
Charts on the Overview Page
-
Delayed Shipment %
Shows the percentage of shipments delivered late. -
Profit Amount by Origin Country
Highlights which origin countries generate higher profits. -
Profit Margin % by Product Type
Compares profitability across different cold chain products. -
Cost Amount vs Revenue Amount by Destination Country
Displays cost-to-revenue efficiency across destination regions.
This page enables leadership teams to assess performance at a glance.
How Does the Product Analysis Page Help Decision-Making?
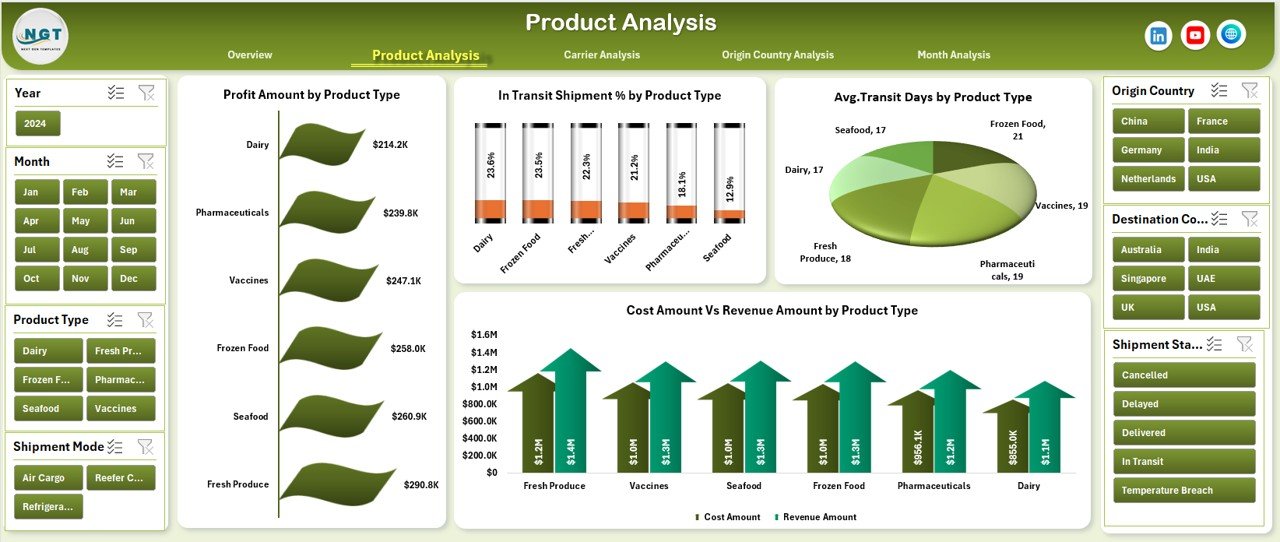
The Product Analysis Page focuses on performance by product type.
Key Insights from the Product Analysis Page
-
Right-side slicer for filtering
-
Four product-focused charts
Charts Included
-
Profit Amount by Product Type
-
In-Transit Shipment % by Product Type
-
Average Transit Days by Product Type
-
Cost Amount vs Revenue Amount by Product Type
With these visuals, teams quickly identify which products face higher delays, longer transit times, or lower margins.
Why Is Carrier Analysis Critical in Cold Chain Logistics?
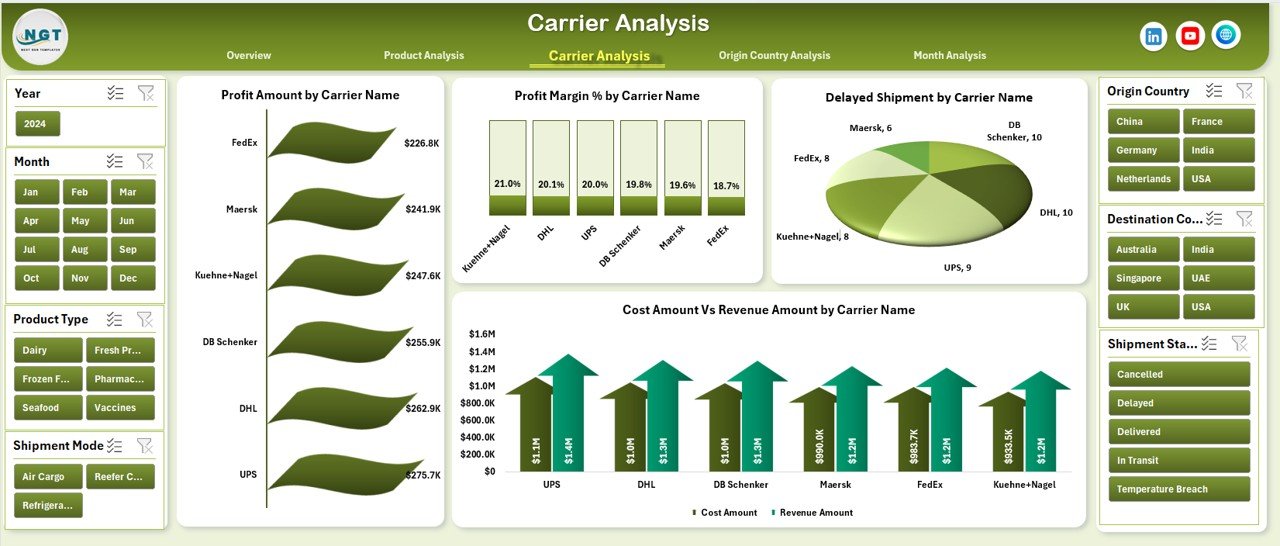
Carriers play a major role in cold chain success. Therefore, the Carrier Analysis Page helps evaluate carrier performance accurately.
Key Features of the Carrier Analysis Page
-
Right-side slicer
-
Four carrier-specific charts
Charts Included
-
Profit Amount by Carrier Name
-
Profit Margin % by Carrier Name
-
Delayed Shipment by Carrier Name
-
Cost Amount vs Revenue Amount by Carrier Name
This page enables logistics managers to compare carriers and negotiate contracts based on data rather than assumptions.
Click to Purchases Cold Chain Logistics Dashboard in Excel
What Insights Does the Origin Country Analysis Provide?
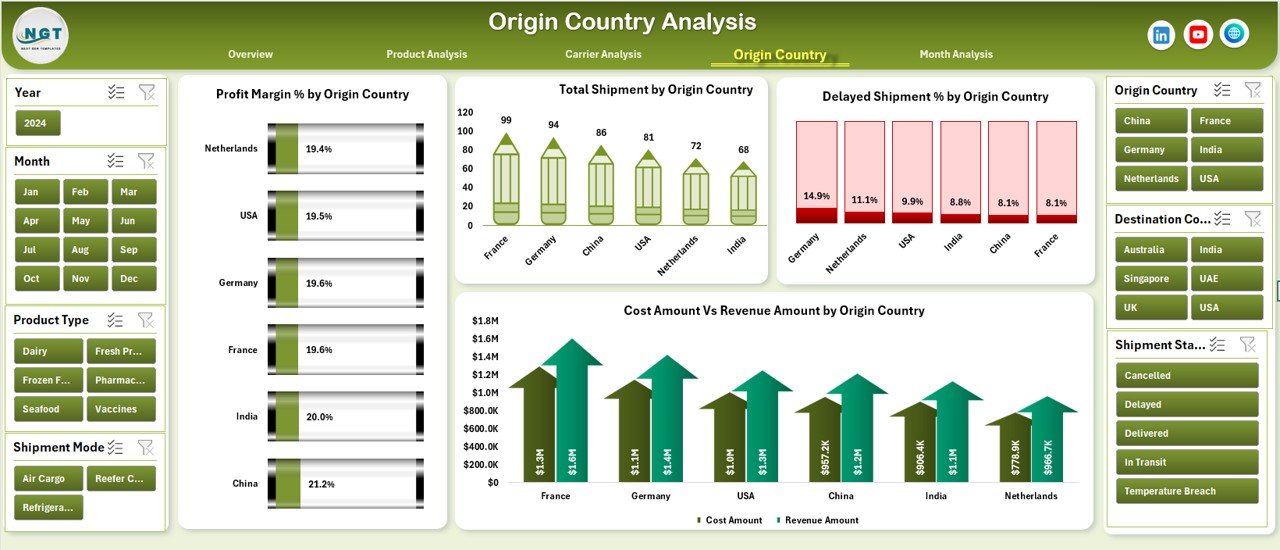
The Origin Country Analysis Page focuses on shipment performance at the source level.
Charts on the Origin Country Analysis Page
-
Profit Margin % by Origin Country
-
Total Shipment by Origin Country
-
Delayed Shipment by Origin Country
-
Cost Amount vs Revenue Amount by Origin Country
By analyzing origin-level performance, businesses identify high-risk regions, optimize routes, and improve planning.
Why Is Month Analysis Important in Cold Chain Logistics?
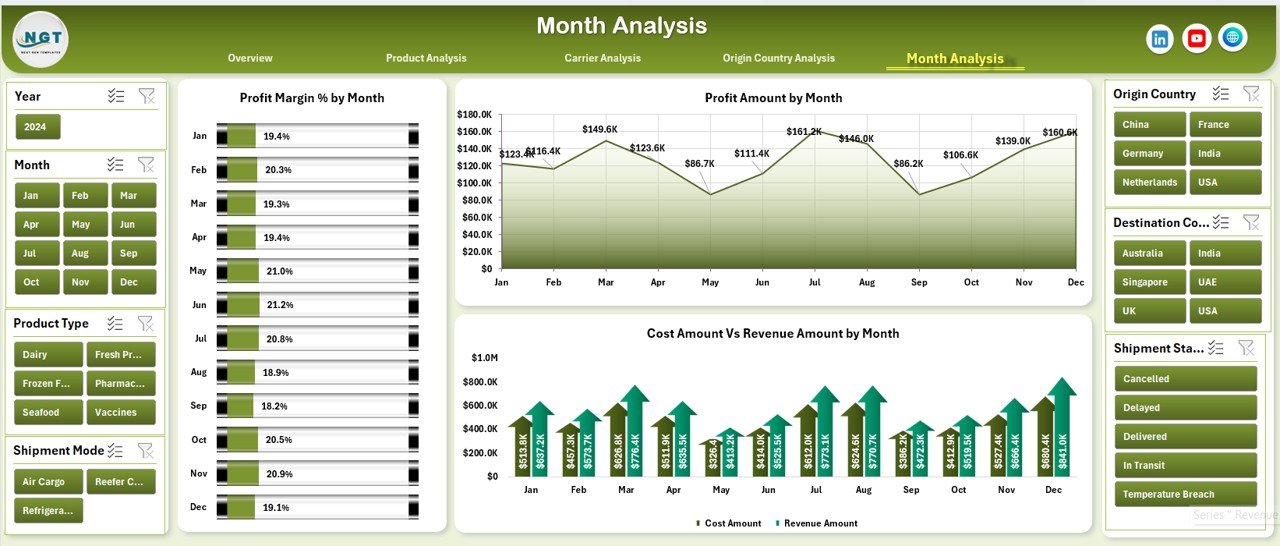
Seasonality affects cold chain logistics significantly. Therefore, the Month Analysis Page helps track trends over time.
Charts on the Month Analysis Page
-
Profit Margin % by Month
-
Profit Amount by Month
-
Cost Amount vs Revenue Amount by Month
These insights help teams forecast demand, control seasonal cost spikes, and plan capacity efficiently.
What Supporting Sheets Power the Dashboard?
Behind the scenes, the dashboard uses structured support sheets to maintain accuracy and scalability.
Data Sheet
-
Stores raw logistics data
-
Acts as the single source of truth
-
Supports easy updates and expansion
Support Sheet
-
Handles calculations and data preparation
-
Ensures clean and consistent visuals
This separation keeps the dashboard organized and reliable.
Advantages of a Cold Chain Logistics Dashboard in Excel
Using a Cold Chain Logistics Dashboard in Excel offers several business advantages.
Key Benefits
-
Centralized performance monitoring
-
Reduced manual reporting effort
-
Improved visibility across shipments and carriers
-
Faster decision-making
-
Better cost and margin control
-
Easy adoption without complex software
-
Scalable and customizable structure
Because Excel remains widely used, teams adopt this dashboard quickly.
Who Should Use a Cold Chain Logistics Dashboard in Excel?
This dashboard suits multiple roles and industries.
Ideal Users
-
Cold chain logistics managers
-
Supply chain analysts
-
Operations heads
-
Procurement teams
-
Finance and cost controllers
-
Pharmaceutical and food logistics teams
Any organization managing temperature-sensitive logistics benefits from this solution.
How Does This Dashboard Improve Profitability?
Profitability improves when companies control costs, reduce delays, and select the right carriers and routes.
This dashboard supports profitability by:
-
Identifying high-cost routes
-
Highlighting low-margin products
-
Comparing carrier efficiency
-
Reducing delayed shipments
-
Supporting data-driven negotiations
As a result, logistics performance improves consistently.
Best Practices for the Cold Chain Logistics Dashboard in Excel
Click to Purchases Cold Chain Logistics Dashboard in Excel
Following best practices ensures maximum value from the dashboard.
Best Practices You Should Follow
-
Keep the data sheet clean and standardized
-
Update data regularly for accurate insights
-
Use consistent product and carrier naming
-
Review delayed shipment trends weekly
-
Compare cost vs revenue monthly
-
Share dashboard insights with stakeholders
-
Customize charts based on business needs
When teams follow these practices, the dashboard delivers long-term benefits.
How Is Excel Better Than Manual Reporting for Cold Chain Logistics?
Manual reports consume time and increase errors. Excel dashboards automate analysis while remaining flexible.
Excel Dashboard vs Manual Reporting
-
Faster insights
-
Lower error rates
-
Interactive filtering
-
Visual performance tracking
-
Better collaboration
Therefore, Excel dashboards replace manual processes effectively.
Can This Dashboard Be Customized?
Yes, customization remains one of the biggest strengths of Excel dashboards.
You can easily:
-
Add new KPIs
-
Insert more charts
-
Modify slicers
-
Expand data volume
-
Adapt the design
As business needs evolve, the dashboard grows with them.
How Secure Is Data in an Excel Dashboard?
Excel provides multiple security options:
-
File-level password protection
-
Sheet-level locking
-
Controlled access sharing
With proper controls, teams protect sensitive logistics data effectively.
Conclusion: Why You Should Use a Cold Chain Logistics Dashboard in Excel
Cold chain logistics demands precision, visibility, and speed. Without structured analytics, businesses risk delays, losses, and declining margins.
A Cold Chain Logistics Dashboard in Excel transforms raw logistics data into actionable insights across overview, product, carrier, origin country, and monthly performance views. Because it remains easy to use, cost-effective, and scalable, it serves as a powerful analytics solution for modern cold chain operations.
By implementing this dashboard, organizations improve efficiency, enhance decision-making, and protect profitability across the cold chain.
Frequently Asked Questions About Cold Chain Logistics Dashboard in Excel
What Is a Cold Chain Logistics Dashboard in Excel Used For?
It tracks, analyzes, and visualizes cold chain shipment performance, costs, delays, and profitability in Excel.
Who Can Use This Dashboard?
Logistics managers, supply chain analysts, finance teams, and operations leaders can use it easily.
Does This Dashboard Require Advanced Excel Skills?
No. Basic Excel knowledge is enough to use and update the dashboard.
Can I Add More Pages or KPIs?
Yes. Excel allows full customization based on business needs.
How Often Should Data Be Updated?
You should update data daily or weekly to maintain accurate insights.
Is This Dashboard Suitable for Pharmaceuticals?
Yes. It suits pharmaceuticals, food, agriculture, chemicals, and any temperature-controlled logistics.
Does the Dashboard Support Large Data Volumes?
Yes. With proper structuring, it supports large datasets efficiently.
Can This Dashboard Reduce Delayed Shipments?
Yes. By identifying delay patterns, teams can take corrective actions quickly.
Is Excel a Cost-Effective Option for Cold Chain Analytics?
Yes. Excel eliminates the need for expensive BI tools while delivering strong analytics.
Can This Dashboard Be Shared Across Teams?
Yes. You can share it securely within the organization.
Visit our YouTube channel to learn step-by-step video tutorials