Community development projects focus on improving lives, strengthening social systems, and creating long-term impact. However, measuring progress in community programs often becomes challenging because data remains scattered across reports, registers, and spreadsheets. As a result, project teams struggle to track performance, compare results, and explain impact clearly to stakeholders.
Community Development KPI Dashboard in Excel That is exactly why a Community Development KPI Dashboard in Excel becomes an essential management and reporting tool.
In this detailed blog post, you will learn everything about the Community Development KPI Dashboard in Excel, including how it works, its worksheet structure, key features, advantages, best practices, and frequently asked questions. Moreover, the language remains simple, practical, and action-oriented so that NGOs, government bodies, and social organizations can use it confidently.
Click to Purchases Community Development KPI Dashboard in Excel
What Is a Community Development KPI Dashboard in Excel?
A Community Development KPI Dashboard in Excel is a ready-to-use performance tracking system designed to monitor key indicators related to community programs, social initiatives, and development projects. It helps organizations track progress against targets using MTD (Month-to-Date) and YTD (Year-to-Date) metrics.
Instead of reviewing multiple files, teams can view all KPIs in one structured dashboard built in Microsoft Excel. As a result, reporting becomes faster, clearer, and more consistent.
Why Do Community Development Projects Need a KPI Dashboard?
Community development initiatives often involve multiple programs, locations, and stakeholders. Without structured tracking, it becomes difficult to measure real impact.
A KPI dashboard helps because it:
-
Centralizes all performance metrics
-
Reduces manual reporting effort
-
Improves transparency and accountability
-
Highlights gaps and achievements clearly
-
Supports data-driven decision-making
Therefore, a KPI dashboard transforms raw data into meaningful insights.
How Does the Community Development KPI Dashboard in Excel Work?
This dashboard works on a simple and effective framework:
-
You enter Actual, Target, and Previous Year data in dedicated sheets
-
Excel formulas calculate MTD and YTD values automatically
-
Conditional formatting highlights performance status
-
Trend charts visualize progress over time
As a result, even non-technical users can understand program performance easily.
What Worksheets Are Included in the Community Development KPI Dashboard?
The Community Development KPI Dashboard in Excel includes seven well-structured worksheets, each designed for a specific purpose.
Click to Purchases Community Development KPI Dashboard in Excel
What Is the Home Sheet and Why Is It Important?
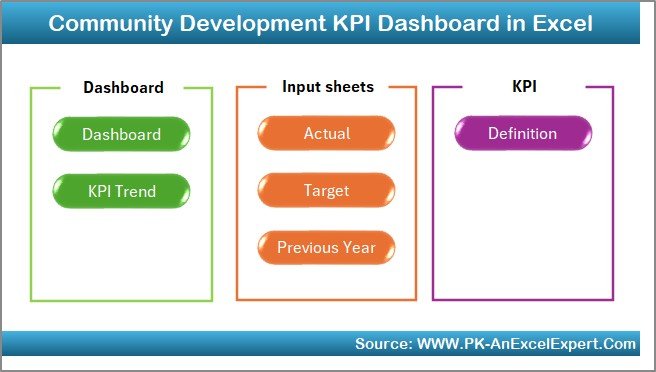
The Home Sheet acts as the index or navigation page of the dashboard.
Key Features of the Home Sheet
-
Serves as a central entry point
-
Includes six navigation buttons
-
Allows quick access to all important sheets
Because of this design, users move through the dashboard smoothly and efficiently.
What Is the Dashboard Sheet and What Does It Show?

The Dashboard Sheet is the main analysis page where all KPIs appear together.
Key Highlights of the Dashboard Sheet
-
Month selection drop-down on cell D3
-
Automatic update of all KPIs based on the selected month
-
Clear separation of MTD and YTD performance
As a result, this sheet provides a complete snapshot of community development performance.
What MTD Metrics Are Displayed on the Dashboard?
For Month-to-Date analysis, the dashboard displays:
-
MTD Actual
-
MTD Target
-
MTD Previous Year
-
Target vs Actual (MTD)
-
Previous Year vs Actual (MTD)
Conditional formatting with up and down arrows highlights whether performance improves or declines.
Click to Purchases Community Development KPI Dashboard in Excel
How Does the Dashboard Handle YTD Performance?
For long-term performance tracking, the dashboard shows:
-
YTD Actual
-
YTD Target
-
YTD Previous Year
-
Target vs Actual (YTD)
-
Previous Year vs Actual (YTD)
Therefore, teams can evaluate cumulative progress across the year.
What Is the KPI Trend Sheet and Why Is It Useful?
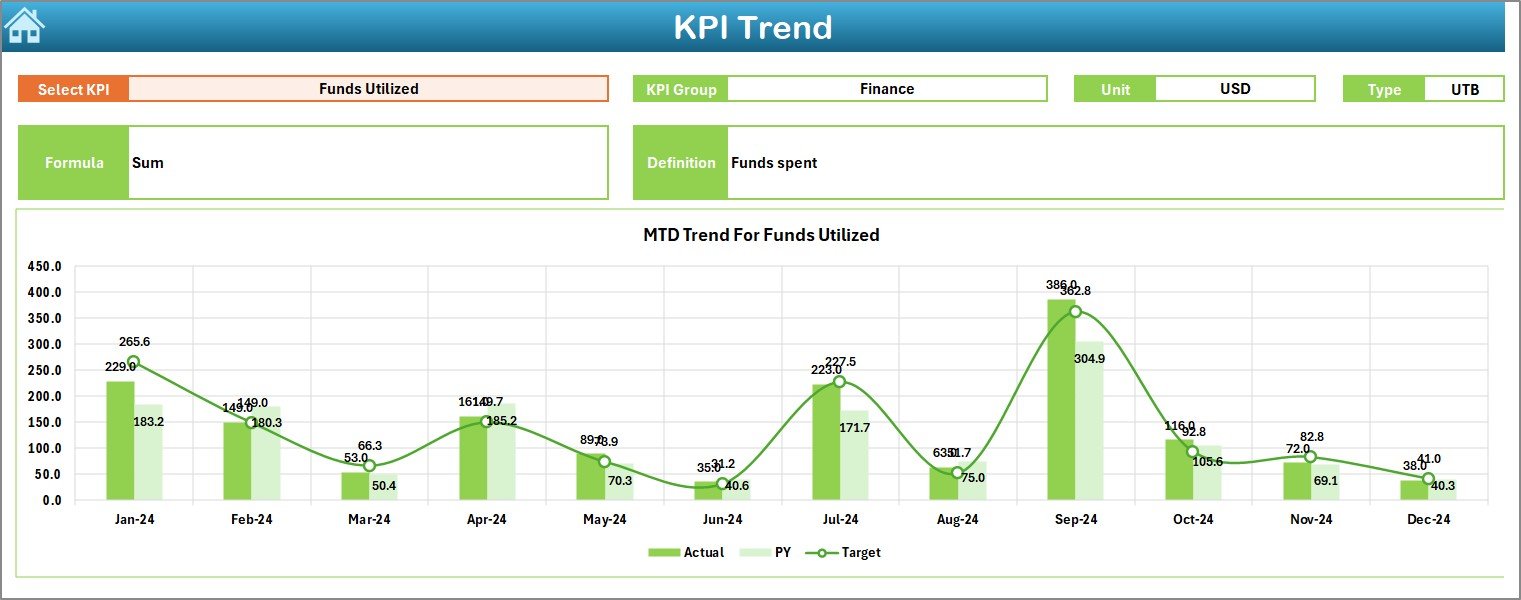
The KPI Trend Sheet supports deep analysis of individual KPIs.
Key Features of the KPI Trend Sheet
-
KPI selection drop-down on cell C3
-
Displays:
-
KPI Group
-
Unit of KPI
-
KPI Type (Lower the Better or Upper the Better)
-
KPI Formula
-
KPI Definition
-
Additionally, the sheet shows:
-
MTD Trend Chart
-
YTD Trend Chart
-
Actual, Target, and Previous Year comparisons
As a result, users can analyze performance patterns clearly.
Why Are Trend Charts Important for Community Development?
Trend charts help organizations:
-
Identify improvement or decline early
-
Track seasonal or regional variations
-
Monitor long-term program effectiveness
-
Support evidence-based reporting
Therefore, trend analysis enables proactive program management.
Click to Purchases Community Development KPI Dashboard in Excel
What Is the Actual Numbers Input Sheet?
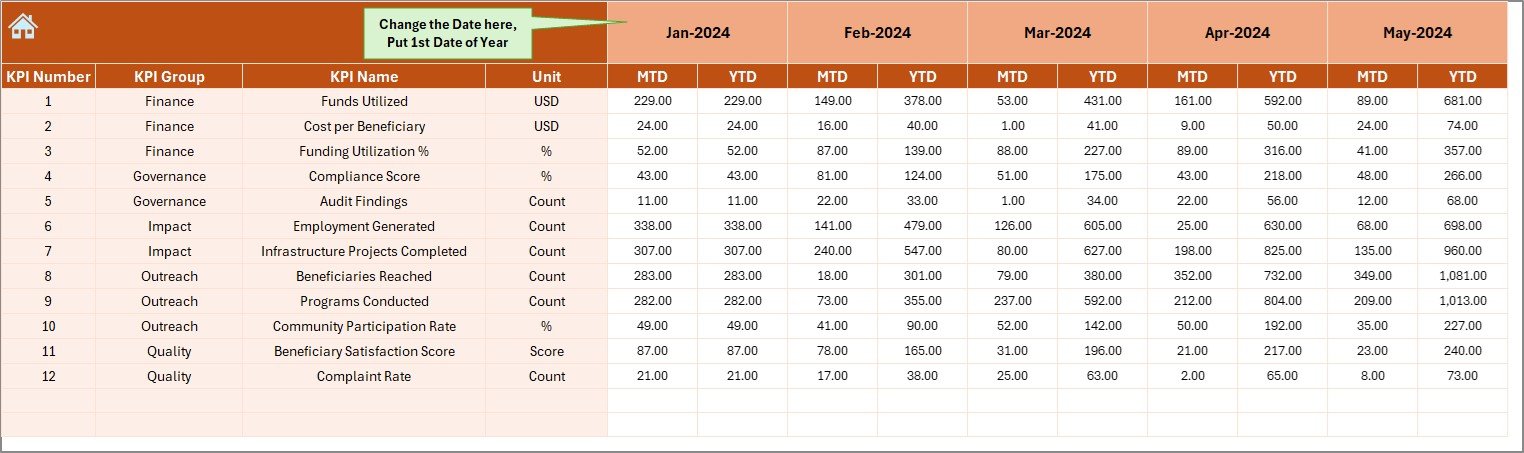
The Actual Numbers Input Sheet captures real performance data.
How to Use This Sheet
-
Enter MTD and YTD actual values
-
Select the reporting month from cell E1
-
Enter the first month of the year in cell E1
This sheet drives all calculations in the dashboard.
What Is the Target Sheet and Why Is It Important?
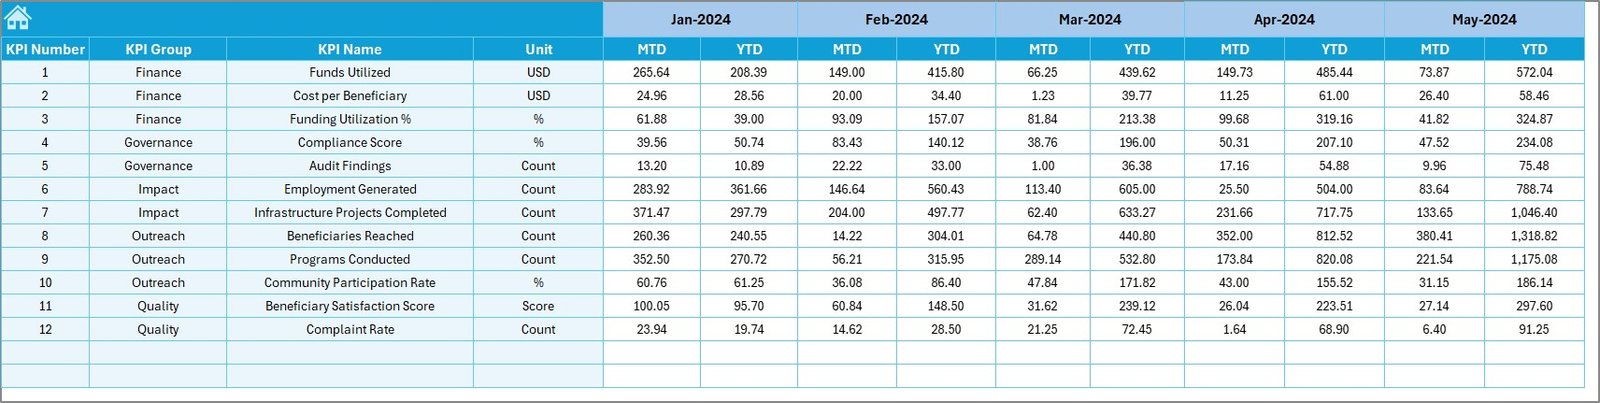
The Target Sheet stores planned performance values.
Purpose of the Target Sheet
-
Enter MTD targets for each KPI
-
Enter YTD targets aligned with project goals
-
Enable gap analysis against actual results
Because of this structure, performance shortfalls become visible instantly.
What Is the Previous Year Number Sheet?
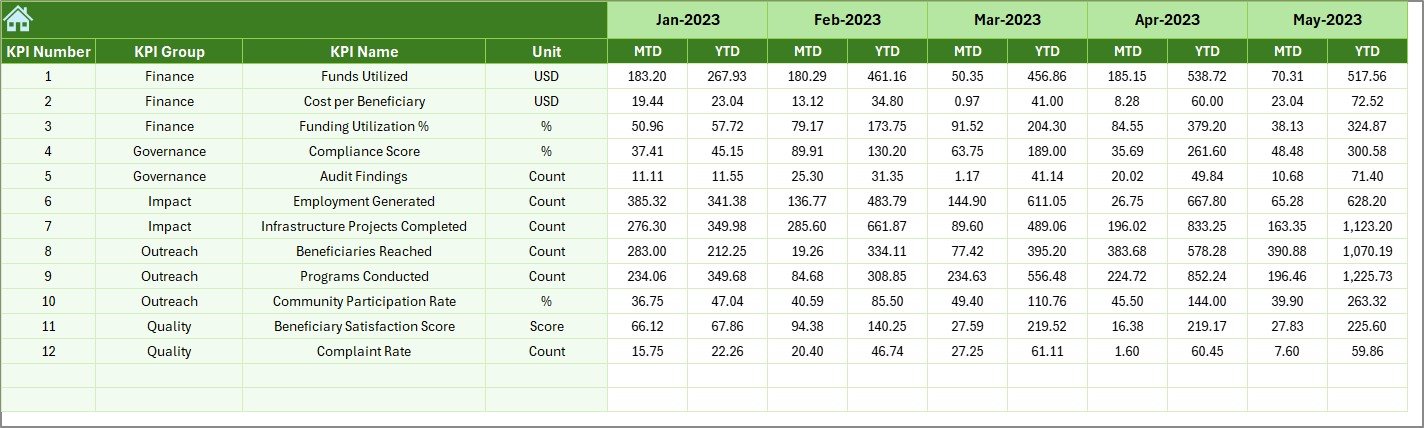
The Previous Year Number Sheet holds historical data.
Benefits of This Sheet
-
Supports year-over-year comparison
-
Highlights growth and improvement trends
-
Adds context to current performance
Therefore, this sheet strengthens impact analysis.
Click to Purchases Community Development KPI Dashboard in Excel
What Is the KPI Definition Sheet?
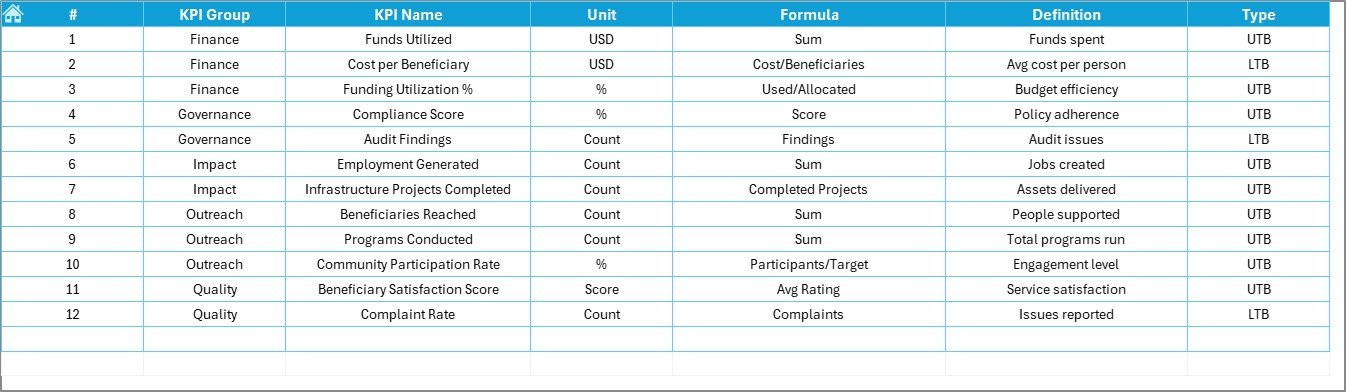
The KPI Definition Sheet ensures clarity and consistency across the organization.
Information Captured in This Sheet
-
KPI Name
-
KPI Group
-
Unit of Measurement
-
KPI Formula
-
KPI Definition
As a result, all stakeholders understand what each KPI measures.
Click to Purchases Community Development KPI Dashboard in Excel
Advantages of Community Development KPI Dashboard in Excel
Using a Community Development KPI Dashboard in Excel provides several practical advantages.
✅ Centralized Impact Tracking
All community development KPIs remain in one structured system.
✅ Easy to Use
Since it runs in Excel, users do not need advanced technical skills.
✅ Time-Saving Reporting
Automation reduces manual calculations and repetitive work.
✅ Clear Performance Visibility
MTD, YTD, and YoY comparisons simplify reporting.
✅ Better Decision-Making
Leaders can act faster based on accurate insights.
✅ Improved Accountability
Clear targets encourage ownership and responsibility.
Who Can Use This Dashboard?
This dashboard benefits:
-
NGOs and non-profit organizations
-
Government and municipal departments
-
CSR and sustainability teams
-
Community project managers
-
Development consultants and researchers
Therefore, it suits both small initiatives and large-scale programs.
Best Practices for the Community Development KPI Dashboard in Excel
To maximize results, follow these best practices.
📌 Define KPIs Clearly
Ensure each KPI has a clear formula and purpose.
📌 Maintain Data Accuracy
Validate inputs regularly to avoid misleading insights.
📌 Update Data Monthly
Timely updates keep performance tracking relevant.
📌 Set Realistic Targets
Align targets with community needs and resources.
📌 Review Trends Frequently
Use trend charts to detect issues early.
📌 Train Team Members
Ensure users understand how to read and interpret the dashboard.
Click to Purchases Community Development KPI Dashboard in Excel
How Does This Dashboard Improve Community Impact Measurement?
This dashboard shifts organizations from activity tracking to impact measurement. Instead of just counting outputs, teams start analyzing outcomes and trends.
As a result:
-
Program effectiveness improves
-
Reporting becomes evidence-based
-
Stakeholder trust increases
-
Funding justification becomes easier
Common Challenges Solved by This Dashboard
Many community development teams face:
-
Disconnected reports
-
Manual Excel work
-
Lack of performance visibility
-
Difficulty in impact reporting
This dashboard solves these challenges through structure, automation, and clarity.
Click to Purchases Community Development KPI Dashboard in Excel
Why Choose Excel for a Community Development KPI Dashboard?
Excel remains popular because it:
-
Is widely available
-
Requires no additional software cost
-
Supports formulas, charts, and automation
-
Allows easy customization
Therefore, Excel-based dashboards remain practical and cost-effective.
Conclusion: Why Every Community Development Program Needs a KPI Dashboard
A Community Development KPI Dashboard in Excel is not just a reporting tool. It is a performance management system that brings clarity, control, and confidence to community initiatives.
With structured worksheets, automated calculations, trend analysis, and clear visuals, this dashboard helps organizations measure impact effectively and improve outcomes consistently. Therefore, it becomes a critical asset for sustainable community development.
Frequently Asked Questions (FAQs)
❓ What is a Community Development KPI Dashboard in Excel?
It is an Excel-based dashboard that tracks community development KPIs using MTD, YTD, and year-over-year metrics.
❓ Do I need advanced Excel skills to use it?
No. Basic Excel knowledge is enough to update and use the dashboard.
❓ Can I customize KPIs in this dashboard?
Yes. You can add or modify KPIs using the KPI Definition sheet.
❓ How often should I update the dashboard?
You should update it monthly for accurate performance tracking.
❓ Is this dashboard suitable for NGOs and government projects?
Yes. It works well for NGOs, CSR teams, and public sector programs.
❓ Does this dashboard support decision-making?
Yes. It provides clear insights that support planning and impact improvement.
Click to Purchases Community Development KPI Dashboard in Excel
Visit our YouTube channel to learn step-by-step video tutorials