In the fast-paced construction and real estate industry, project timelines play a key role in successful project delivery. Even a minor delay can increase costs and damage client trust. For this reason, many project managers now use Project Timeline KPI Dashboards in Excel to monitor all timelines and performance indicators in one centralized location.
In this article, you will learn how a Construction and Real Estate Project Timeline KPI Dashboard works, what makes it so powerful, and how you can build and use it in Excel. You will also discover the key benefits, best practices, and frequently asked questions. Let’s dive in.
Table of Contents
ToggleClick to Purchases Construction and Real Estate Project Timeline KPI Dashboard in Excel
What Is a Construction and Real Estate Project Timeline KPI Dashboard?
A Construction and Real Estate Project Timeline KPI Dashboard in Excel is a visual and interactive reporting tool that captures and displays all key performance indicators (KPIs) related to project progress and scheduled timelines.
It usually includes monthly and yearly timelines, actual vs target performance, previous-year comparisons, and detailed trend charts.
Instead of reviewing multiple reports, project owners and managers get a single dashboard that helps them:
-
Track milestones
-
Adjust resource allocations
-
Detect potential delays
-
Take corrective actions quickly
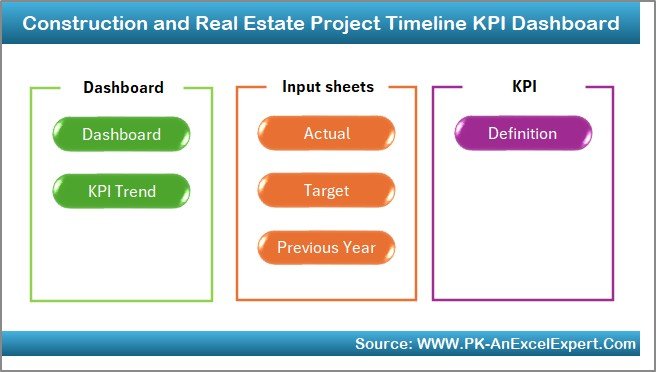
Main Components of the Dashboard
This professional dashboard contains seven worksheet tabs, each playing a specific role in the reporting process:
Home Sheet
The Home tab works as the index page.
It includes 6 easy-to-use buttons that allow users to jump directly to each worksheet in just one click.
This improves navigation and makes the report user-friendly.
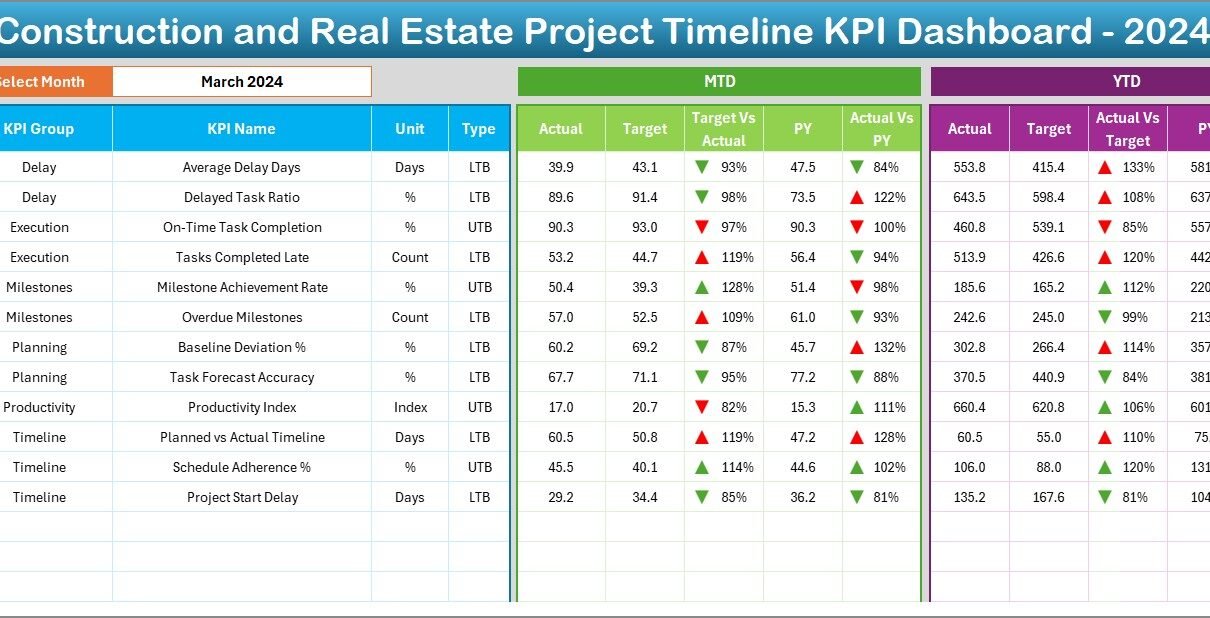
Dashboard Sheet
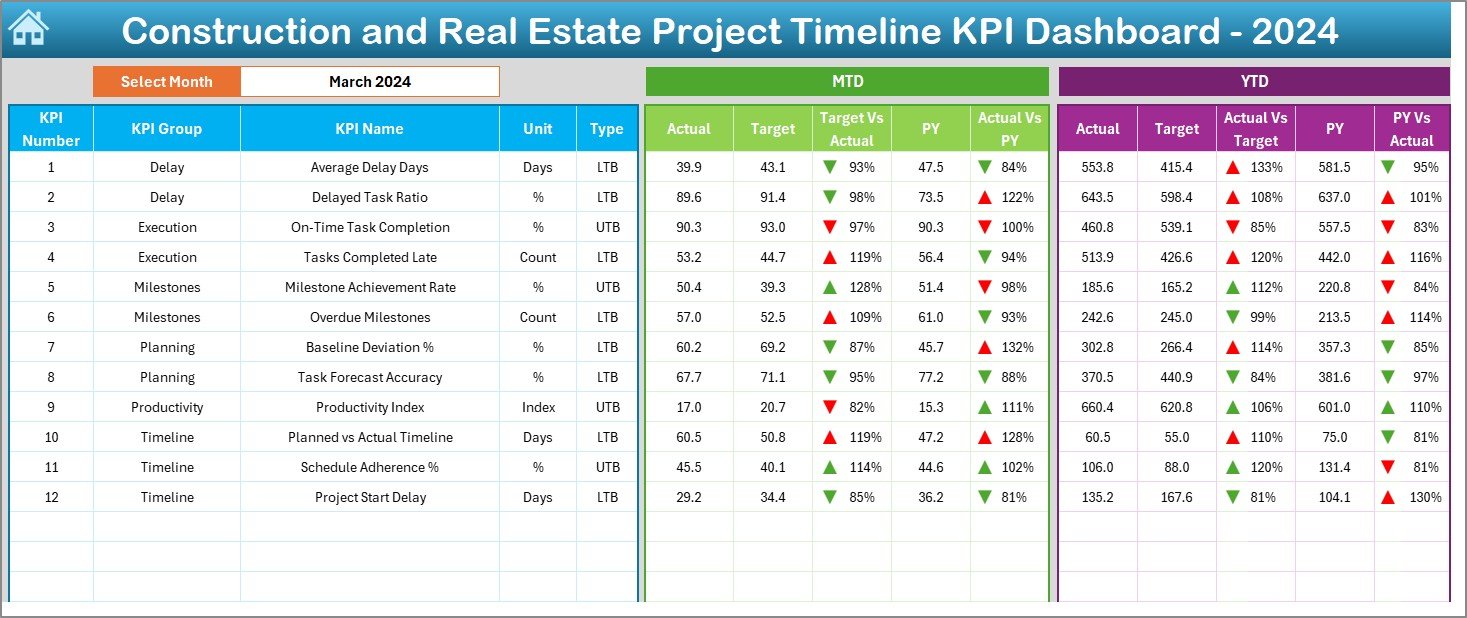
The Dashboard tab is the main page of the file.
It displays high-level KPI details and timeline performance information.
Users can select the month from a drop-down (cell D3), and all visuals in the dashboard update automatically.
✔ It displays:
-
MTD (Month-to-Date) Actual vs Target
-
MTD Actual vs Previous Year
-
YTD (Year-to-Date) Actual vs Target
-
YTD Actual vs Previous Year
All visuals use conditional formatting (up and down arrows) to show where the performance improves or drops.
Click to Purchases Construction and Real Estate Project Timeline KPI Dashboard in Excel
KPI Trend Sheet
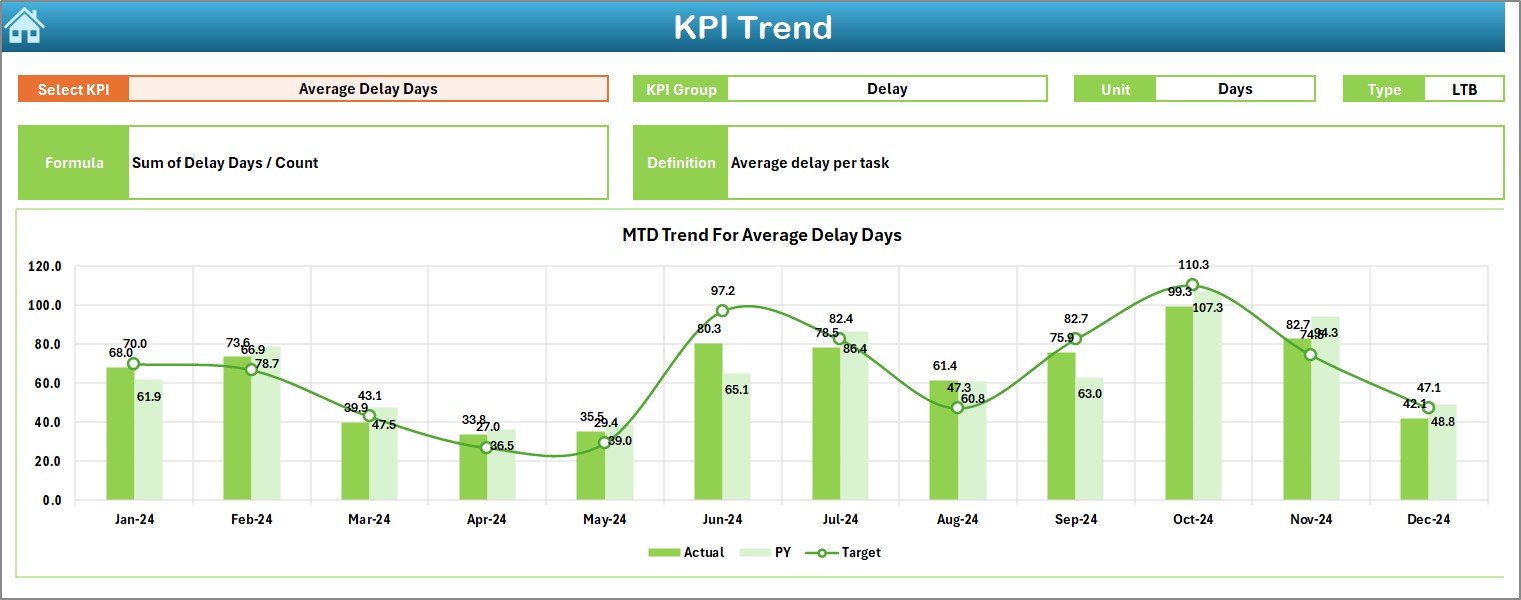
This tab allows users to view the trend of each KPI across multiple months.
The user selects a KPI from the drop-down in cell C3.
The sheet also displays:
-
KPI Group
-
Unit of Measurement
-
KPI Type (LTB = Lower The Better / UTB = Upper The Better)
-
Short Formula
-
Short Definition
Below this, you see trend charts for:
-
MTD Actual, Target, Previous Year
-
YTD Actual, Target, Previous Year
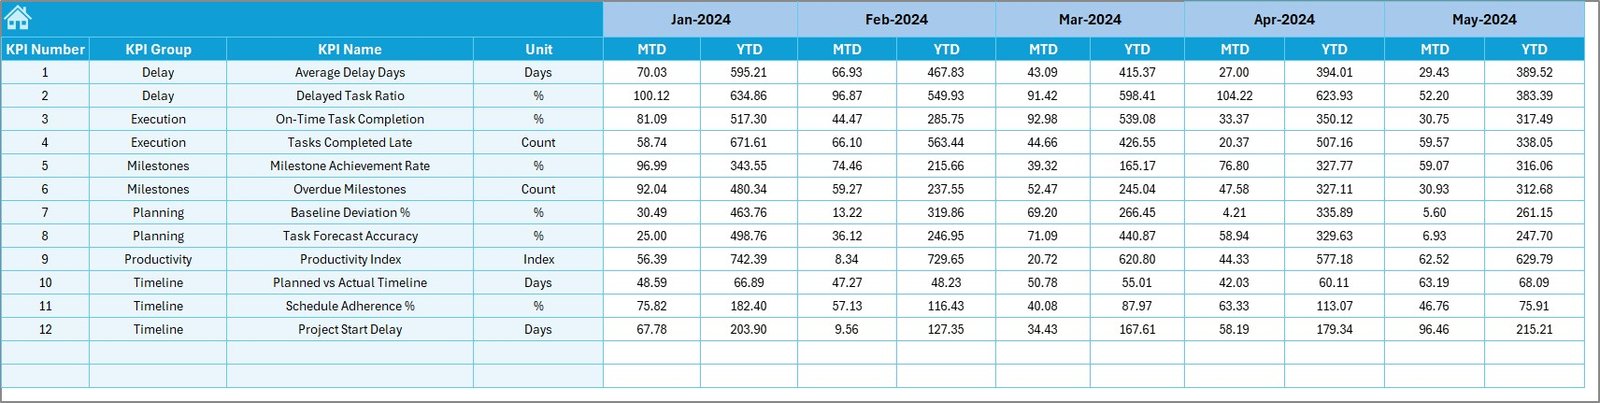
Actual Numbers Input Sheet
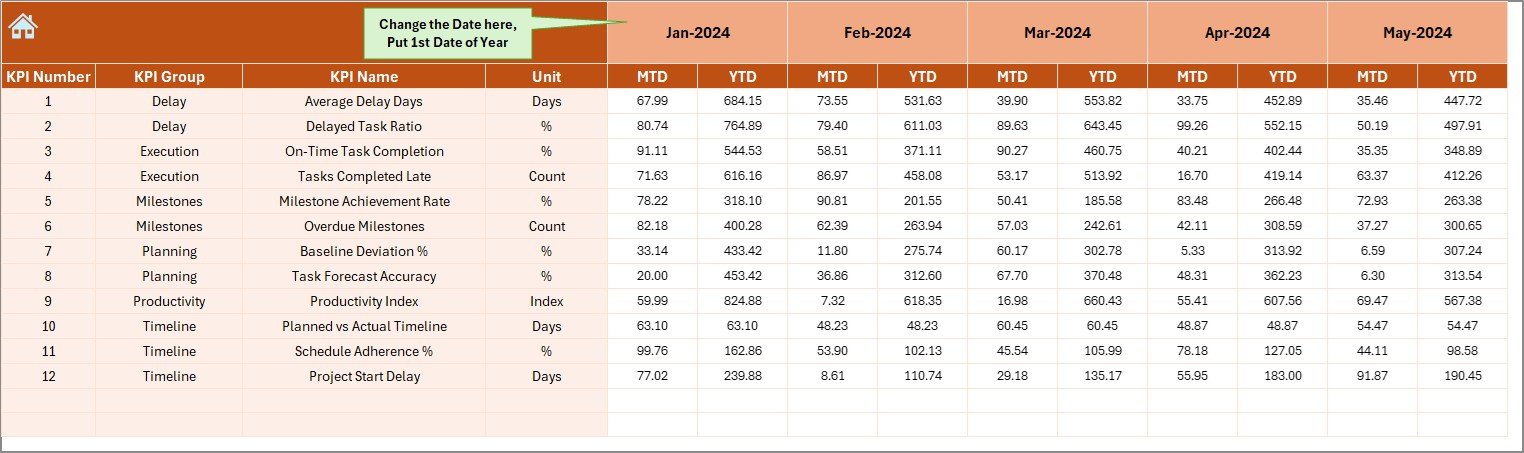
This sheet is used to enter the monthly actual data.
The user chooses the starting month in cell E1 and then inputs MTD and YTD values for each KPI.
Target Sheet
The Target tab allows the user to enter monthly target values for all KPIs.
Both MTD and YTD targets are updated based on project plans.
Previous Year Numbers Sheet
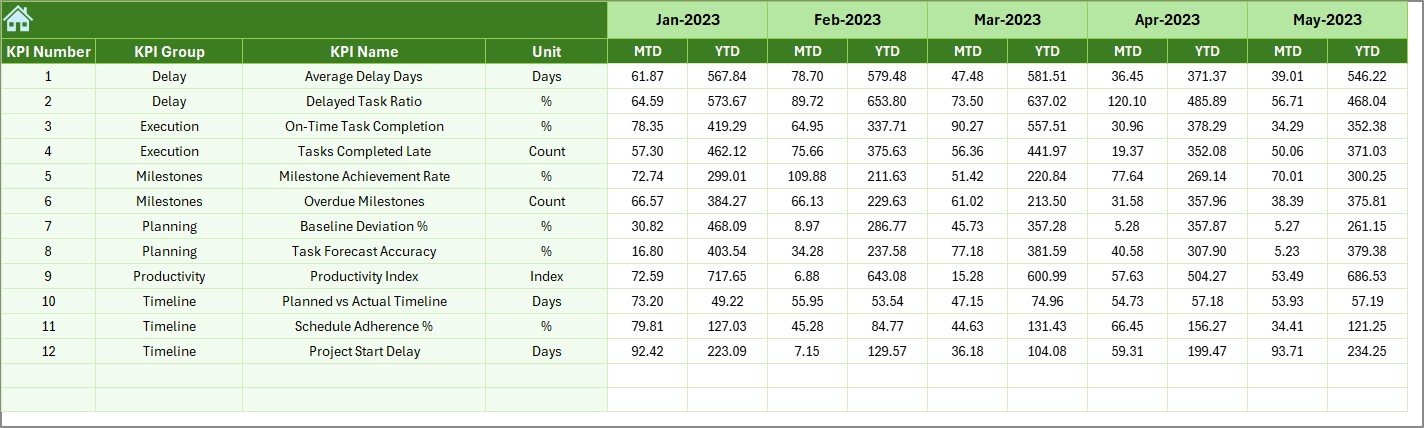
This sheet stores previous year values for all KPIs.
These values are used in the dashboard to compare performance over time.
KPI Definition Sheet
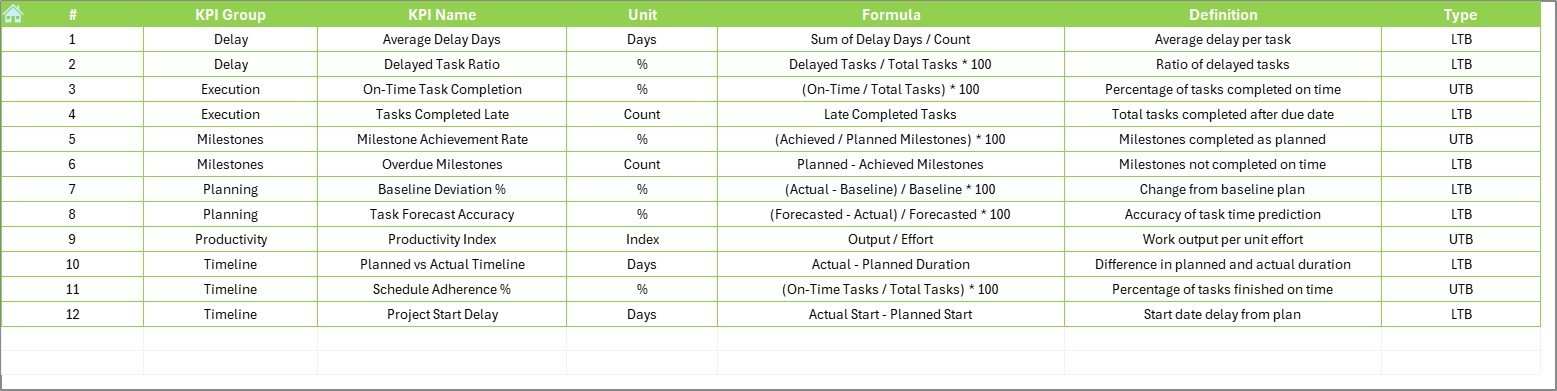
This sheet contains all the required KPI details:
-
KPI Name
-
KPI Group
-
Unit
-
Formula
-
Definition
It acts as a reference list for the dashboard and helps users understand each KPI clearly.
✅ Why Should You Use a Project Timeline KPI Dashboard?
The construction and real estate industry involves complex processes, long timelines, and multiple stakeholders.
A Project Timeline KPI Dashboard simplifies the monitoring process and creates real project value.
Advantages of the Project Timeline KPI Dashboard
-
Improved Visibility – Track each timeline in real-time and identify delays immediately.
-
Better Decision Making – Compare performance vs targets to take fast corrective action.
-
Increased Accountability – Clearly assign KPI ownership to departments or teams.
-
Resource Optimization – Use data to assign manpower and equipment more effectively.
-
Enhanced Communication – Present progress to top management and clients in a clear way.
-
Historical Comparison – Spot patterns and trends by comparing current vs previous year.
-
Customizable – You can fully customize the dashboard layout and KPIs.
Step-by-Step Guide: How to Use the Dashboard
Step 1: Set Up the KPI Definitions
Open the KPI Definition sheet and fill in the KPI Name, Group, Unit, Formula, and Definition.
This step ensures that each KPI is clearly documented.
Step 2: Enter Previous Year Data
Go to the Previous Year Numbers tab and enter all previous year values for each KPI.
Step 3: Enter Target Numbers
Open the Target Sheet and enter:
-
Monthly MTD targets
-
YTD targets
Step 4: Add Actual Values
Navigate to the Actual Numbers Input sheet and enter actual data every month.
Remember to update cell E1 with the first month of the current year.
Step 5: Analyze the Dashboard
Go back to the Dashboard Sheet and select the month from the drop-down.
Use the charts and metrics to check:
-
Target vs Actual performance
-
Previous year comparison
-
Trend movement
Step 6: Review Trends
Open the KPI Trend Sheet and review any negative movement.
Take quick corrective action based on insights.
Best Practices for the Construction and Real Estate Project Timeline KPI Dashboard
-
Use Clear KPI Definitions – Avoid confusing formulas. Use simple and clear KPI descriptions.
-
Update Data Regularly – Update the Actual Numbers sheet on a monthly basis.
-
Monitor Trends Not Snapshots – Always check the KPI Trend sheet for long-term direction.
-
Limit the Number of KPIs – Focus on KPIs that truly affect time and cost.
-
Use Conditional Formatting – Use up/down arrows and red/green icons to highlight performance.
-
Centralize the File – Save the file in a shared location so that all stakeholders can access it.
-
Review with Stakeholders – Discuss the KPI results during project review meetings.
Conclusion
A Construction and Real Estate Project Timeline KPI Dashboard in Excel is one of the most effective tools for monitoring project progress and achieving on-time delivery. It brings all important timelines, targets, and performance indicators into one single page that is both easy to use and easy to understand.
Because the template is fully customizable, project managers can start with a basic version and then expand it as their needs grow over time.
If you want to transform your project tracking process and reduce operational delays, this dashboard is a practical and cost-effective solution that delivers real value.
Frequently Asked Questions (FAQ)
What KPIs should I include in a Project Timeline Dashboard?
You should include KPIs that directly affect time and delivery, such as Project Completion %, Planned vs Actual Days, Milestones Completed, and % Tasks on Schedule.
How often should I update the data in the dashboard?
It is best to update the Actual Numbers sheet every month.
This ensures that charts and reports reflect the current status.
Can I customize the dashboard based on my project?
Yes. All KPI names, formulas, and sheets are fully editable in Excel, so you can modify the template based on your specific project and internal reporting method.
Do I need advanced Excel skills to use the dashboard?
No. The dashboard uses simple drop-downs, pivot tables, and conditional formatting. Even a beginner can use it after a quick review of the sheets.
Can I use this dashboard for multiple projects at the same time?
Yes, but it is better to create a separate file for each project.
This reduces data complexity and keeps reporting clean.