In today’s fast-moving construction and real estate industry, ensuring quality assurance is no longer optional—it’s a necessity. With increasing competition, client expectations, regulatory compliance, and cost pressure, businesses need data-driven tools to monitor, evaluate, and improve project quality consistently.
That’s where the Construction and Real Estate Quality Assurance KPI Dashboard in Excel comes in. This ready-to-use dashboard provides complete visibility into your key quality metrics, helping you stay on top of performance while keeping your projects within scope, time, and budget.
In this article, we will dive deep into:
-
What this dashboard offers
-
How it works
-
The advantages of using it
-
Best practices for quality assurance tracking
-
And some commonly asked questions
Let’s get started.
Click to Purchases Construction and Real Estate Quality Assurance KPI Dashboard in Excel
What is the Construction and Real Estate Quality Assurance KPI Dashboard?
The Construction and Real Estate Quality Assurance KPI Dashboard in Excel is a dynamic and interactive tool that tracks all the critical Key Performance Indicators (KPIs) related to construction project quality. Built using Excel, it helps teams:
-
Monitor Monthly and Year-to-Date (YTD) progress
-
Compare Actual vs Target values
-
Evaluate performance against the previous year
-
Visualize trends and patterns
-
Make data-driven decisions to improve quality
Unlike static spreadsheets, this dashboard comes with built-in dropdowns, slicers, charts, and conditional formatting that allow users to view the data they need with just a few clicks.
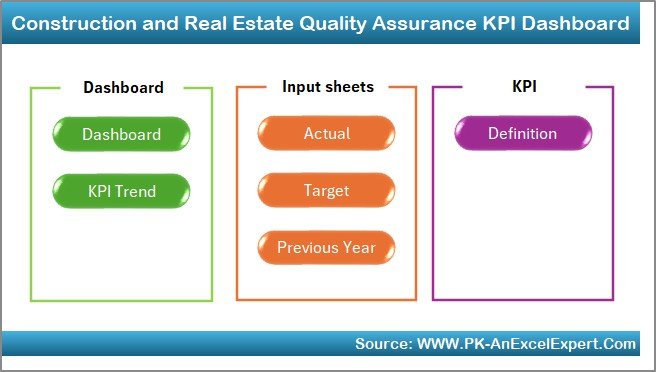
What’s Inside the Dashboard? (Sheet-by-Sheet Breakdown)
This dashboard includes 7 powerful worksheet tabs, each designed to streamline a different part of your quality assurance process.
Home Sheet – Navigation Hub
-
The Home tab is your control panel.
-
It includes six clickable buttons that take you to each functional area of the dashboard.
-
This simplifies navigation and saves time.
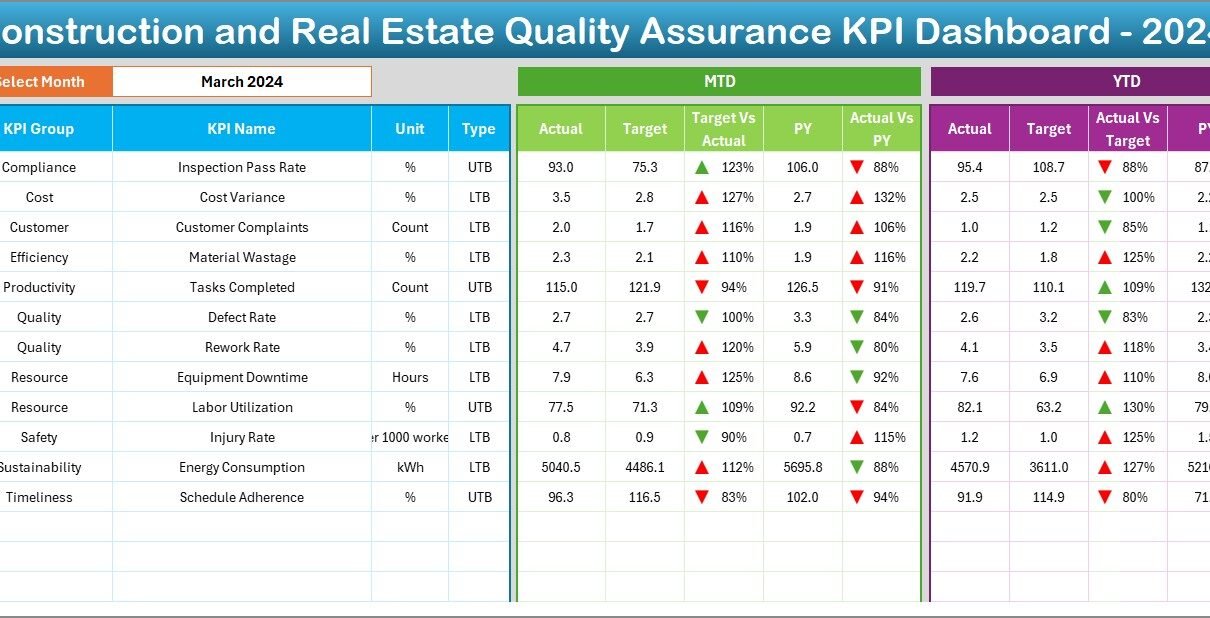
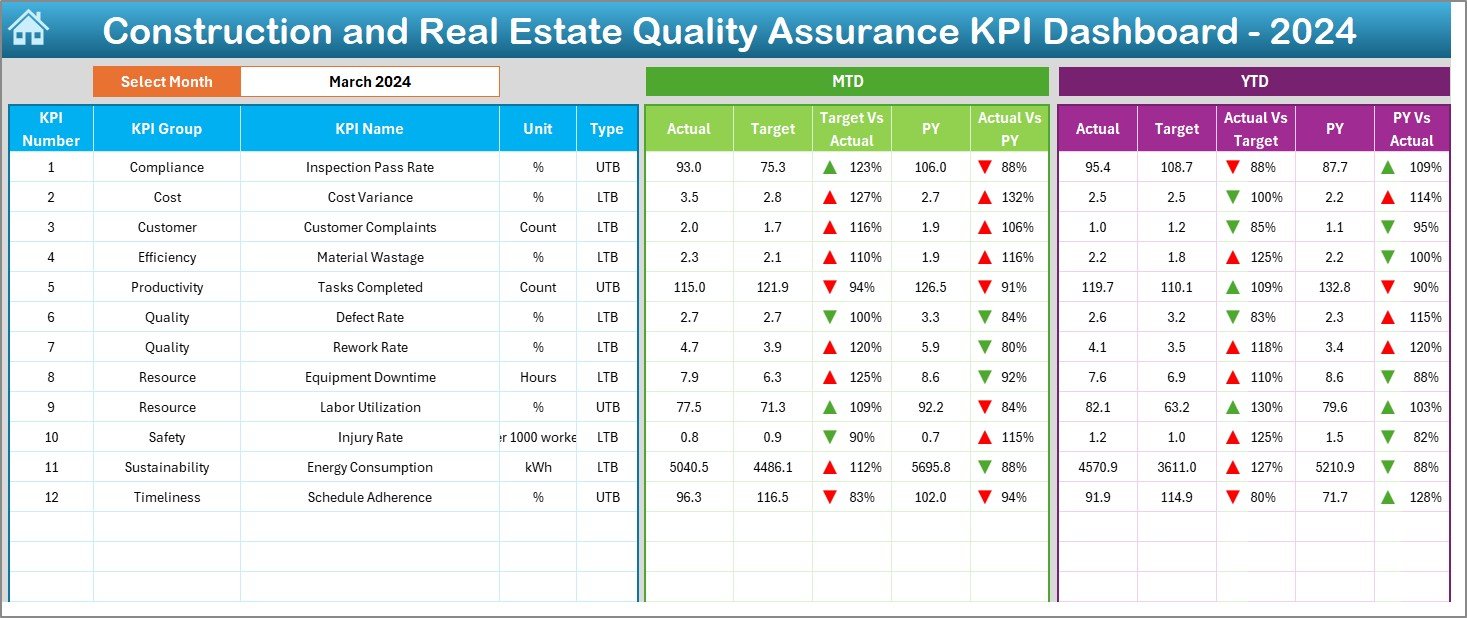
Dashboard Sheet – The Visual Summary
-
This is the main dashboard tab where all key quality KPIs are displayed.
-
It includes MTD (Month-to-Date) and YTD (Year-to-Date) values.
-
You can select the month using the dropdown in cell D3, and the entire dashboard updates automatically.
Includes:
- Actual vs Target (MTD & YTD)
- Actual vs Previous Year (MTD & YTD)
- Conditional formatting using up/down arrows for quick visual comparison
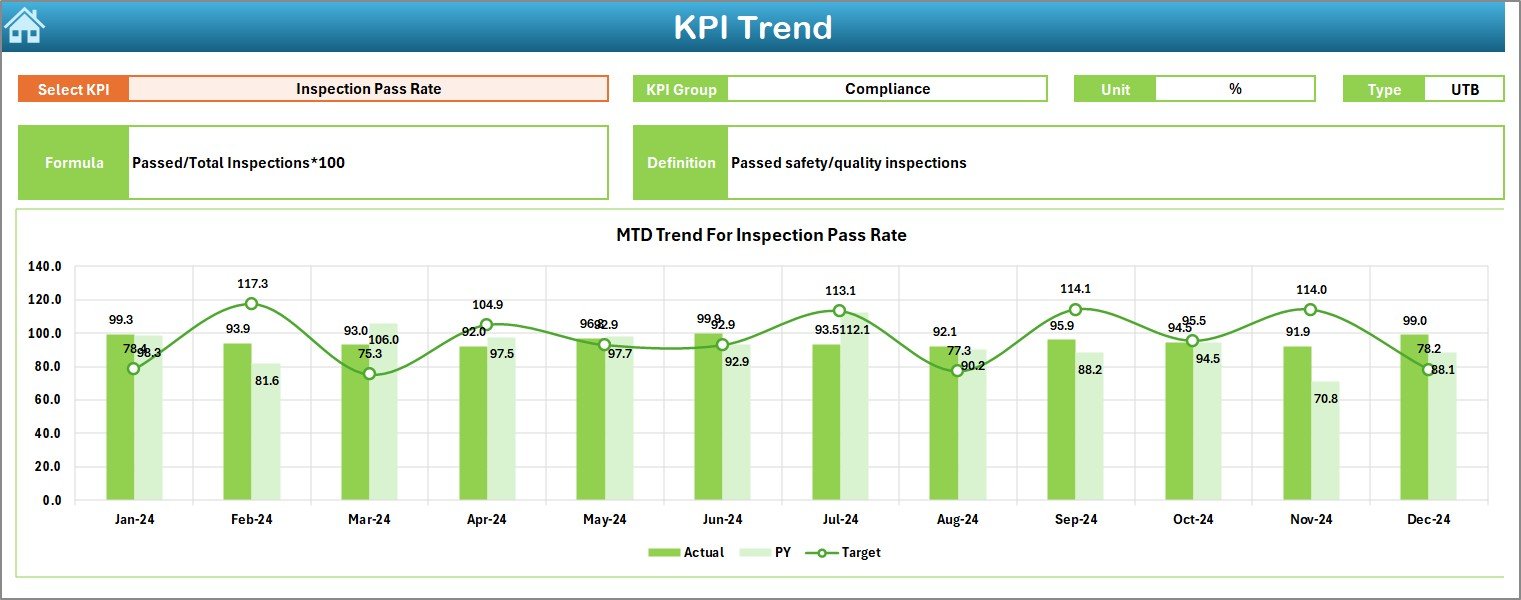
KPI Trend Sheet – Visualize Performance Over Time
-
Choose any KPI from the dropdown in cell C3.
See detailed:
- KPI Name
- KPI Group
- Unit of Measurement
- Type (UTB – Upper the Better / LTB – Lower the Better)
- Formula
- Definition
-
View MTD and YTD charts for Actual, Target, and Previous Year trends.
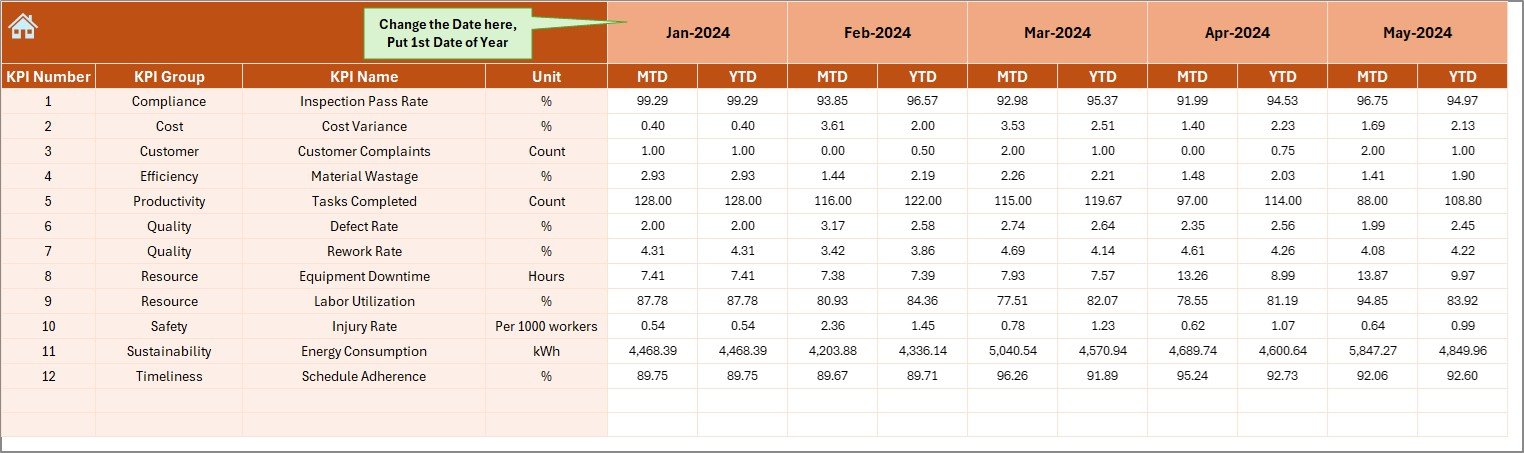
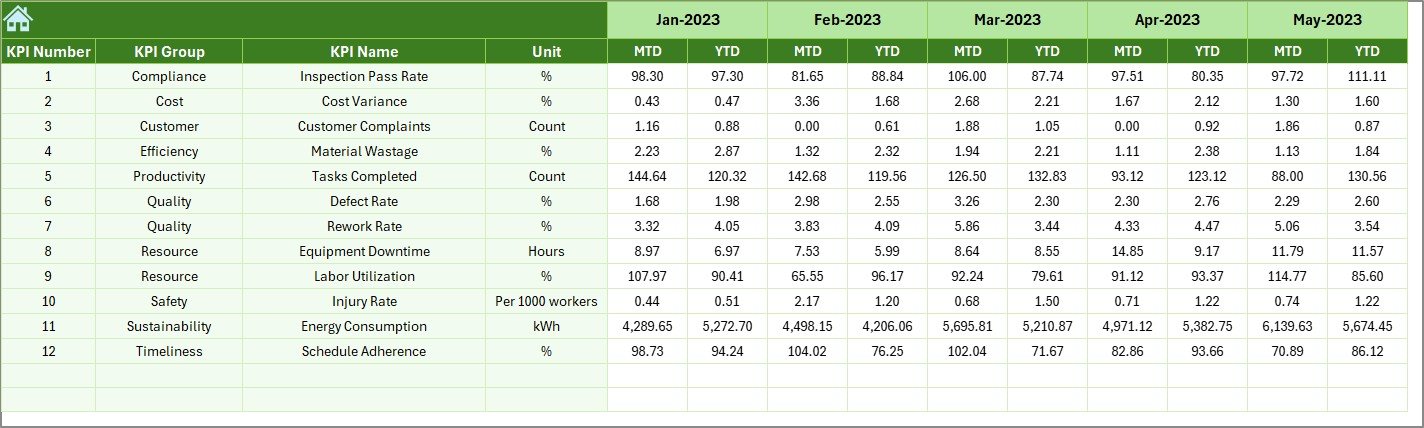
Actual Numbers Input Sheet – Record Real Performance
-
Input actual KPI numbers month-wise.
-
Add both MTD and YTD values.
-
Set the start month using cell E1.
-
Clean structure with proper formatting ensures consistency.
Click to Purchases Construction and Real Estate Quality Assurance KPI Dashboard in Excel
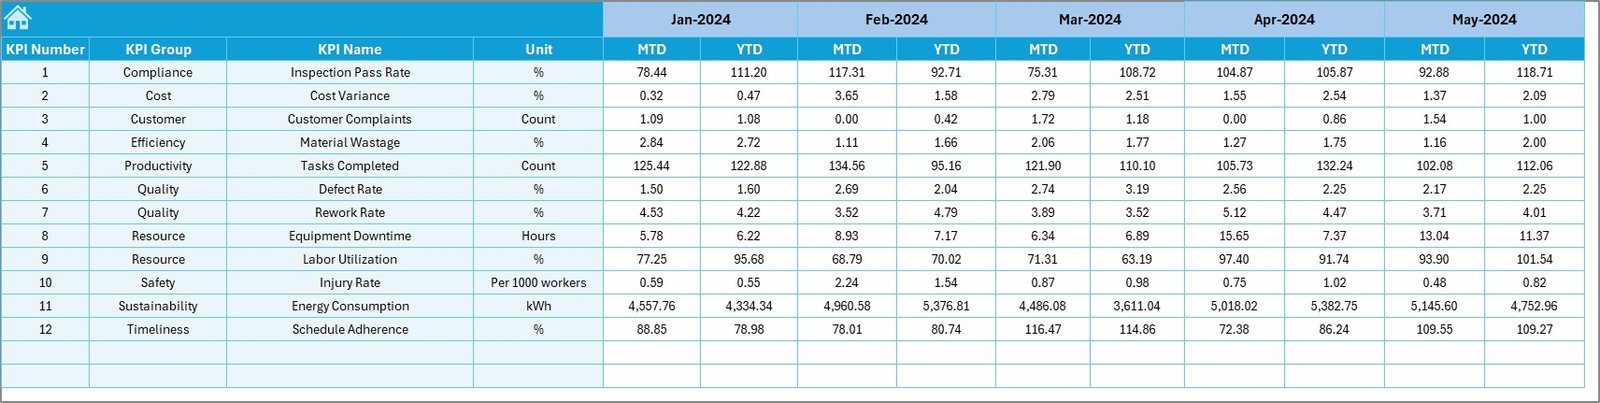
Target Sheet – Set Your Goals
-
Define your monthly targets here.
-
Input both MTD and YTD targets for each KPI.
-
Helps set benchmarks and identify gaps early.
Previous Year Numbers Sheet – Benchmarking
-
Input last year’s actuals for all KPIs.
-
Enables Year-on-Year (YoY) performance comparison.
-
Identifies growth or decline in quality metrics.
KPI Definition Sheet – Your KPI Reference Guide
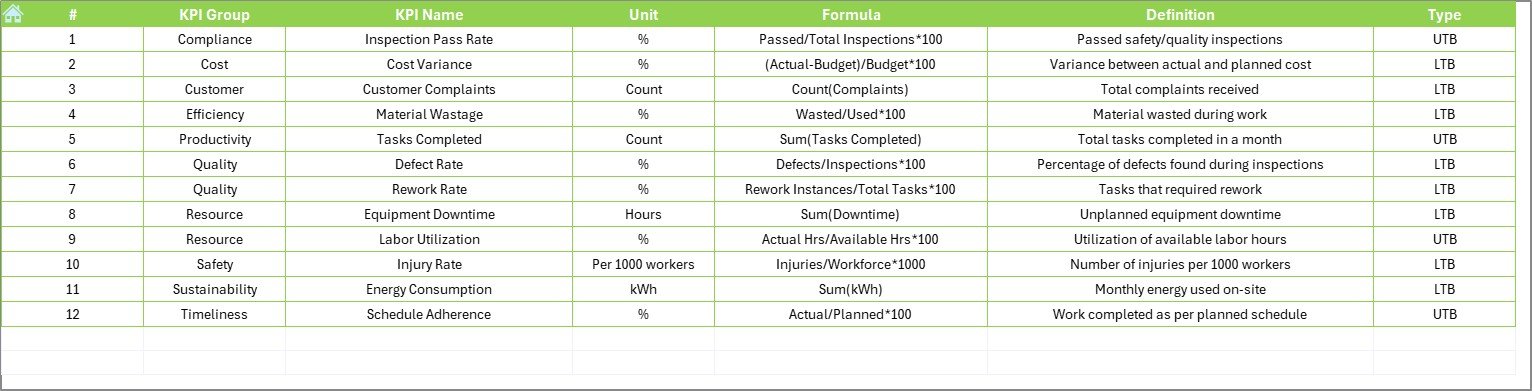
Enter full definitions for each KPI:
- KPI Name
- KPI Group
- Unit
- Formula
- Short Definition
-
Keeps everything transparent and easy to understand for your team.
Advantages of Construction and Real Estate Quality Assurance KPI Dashboard
Here are some of the major benefits you’ll experience by using this Excel dashboard:
-
Real-Time Monitoring
Get up-to-date insights into the quality performance of your construction or real estate projects. -
Informed Decision-Making
With trend charts, comparison visuals, and defined targets, make better decisions based on data. -
Saves Time & Improves Accuracy
No more manual calculations. Everything updates dynamically. -
Team Alignment
Keeps project managers, quality inspectors, and site engineers on the same page. -
Simple and Easy to Use
Built entirely in Excel, no complex tools needed. -
Compliance and Audit Ready
Maintains a historical record of KPI performance, useful for audits and regulatory compliance.
How to Use This Dashboard Effectively?
Using the dashboard is easy, but getting the most out of it takes good planning. Here’s how to use it step-by-step:
-
Set Your Start Month
Go to the Actual Numbers Input tab and set your fiscal start month. -
Define Targets
Use the Target Sheet to establish benchmarks for each KPI. -
Enter Actuals Monthly
As projects progress, update the MTD and YTD values. -
Enter Previous Year Data
This will allow you to track year-over-year progress. -
Review Dashboard Monthly
Use the Dashboard tab to review your performance. Use dropdowns to filter the month. -
Check Trends
Use the KPI Trend sheet to analyze upward or downward movement over time. -
Keep KPI Definitions Clear
Make sure your team understands what each KPI measures and why it matters.
Best Practices for Construction Quality Assurance Tracking
Here are some proven best practices to improve quality assurance using KPI dashboards:
✅ Define Clear KPI Ownership
Assign a responsible person or department for each KPI.
✅ Keep KPI Definitions Consistent
Ensure everyone understands the calculation and relevance of each metric.
✅ Update Data Regularly
Keep your Actuals, Targets, and Previous Year data up-to-date.
✅ Review Monthly with Team
Hold regular performance review meetings using the dashboard.
✅ Use Visuals for Quick Interpretation
Leverage color coding, arrows, and charts to highlight performance.
✅ Align KPIs with Business Goals
Ensure that each KPI reflects what matters most to your organization.
✅ Encourage Continuous Improvement
Use trends and data insights to launch quality improvement initiatives.
Who Should Use This Dashboard?
This dashboard is ideal for:
-
Construction Project Managers
-
Real Estate Developers
-
Quality Assurance Teams
-
Site Engineers
-
Safety Officers
-
Internal Auditors
-
Facility Managers
Anyone who wants to monitor and improve the quality performance of construction and real estate projects will benefit from this tool.
Conclusion
The Construction and Real Estate Quality Assurance KPI Dashboard in Excel is a practical and powerful solution to one of the industry’s biggest challenges—maintaining consistent quality across multiple projects.
From tracking defects and safety violations to monitoring compliance and audit results, this dashboard gives you full control. It is user-friendly, data-rich, and completely customizable.
Whether you’re a small contractor or a large real estate developer, you can use this dashboard to drive better results, reduce rework, and deliver higher-quality outcomes.
Frequently Asked Questions (FAQs)
Q1. Can I use this dashboard for multiple projects?
Yes, you can use this dashboard to track KPIs across multiple projects by adding additional identifiers (such as project name or ID) in your data sheets.
Q2. Is this Excel dashboard beginner-friendly?
Absolutely. It’s designed for ease of use, with dropdowns, simple input fields, and automated calculations.
Q3. Can I customize the KPIs in the dashboard?
Yes, you can easily add or modify KPIs by updating the KPI Definition, Target, and Actual sheets accordingly.
Q4. Does it support Year-over-Year analysis?
Yes. By entering Previous Year data, you can compare current performance with the same period from the previous year.
Q5. Do I need Excel VBA to run this dashboard?
No. This dashboard is built using only Excel formulas and built-in features. No macros or VBA required.
Q6. Can I use it for other departments like Safety or Procurement?
Yes. While designed for quality assurance, you can adapt this structure to track KPIs in safety, procurement, finance, or operations.
Visit our YouTube channel to learn step-by-step video tutorials
Click to Purchases Construction and Real Estate Quality Assurance KPI Dashboard in Excel