
In today’s competitive digital marketing landscape, data-driven decisions are paramount. A Content Marketing KPI Dashboard in Power BI offers marketers and businesses an efficient and visual way to track, analyze, and optimize their content strategies. Whether you’re managing a blog, social media, or an entire content marketing campaign, a well-structured dashboard can help keep your efforts aligned with business goals.
What is a Content Marketing KPI Dashboard in Power BI?
A Content Marketing KPI Dashboard in Power BI is a visual reporting tool that aggregates and tracks key performance indicators (KPIs) related to content marketing efforts. It allows teams to monitor the performance of their content marketing campaigns in real time, offering insights that can help refine strategies and achieve better results.
Click to Purchases Content Marketing KPI Dashboard in Power BI
Key Features of a Content Marketing KPI Dashboard in Power BI
Summary Page: The Heart of Your Content Marketing Dashboard
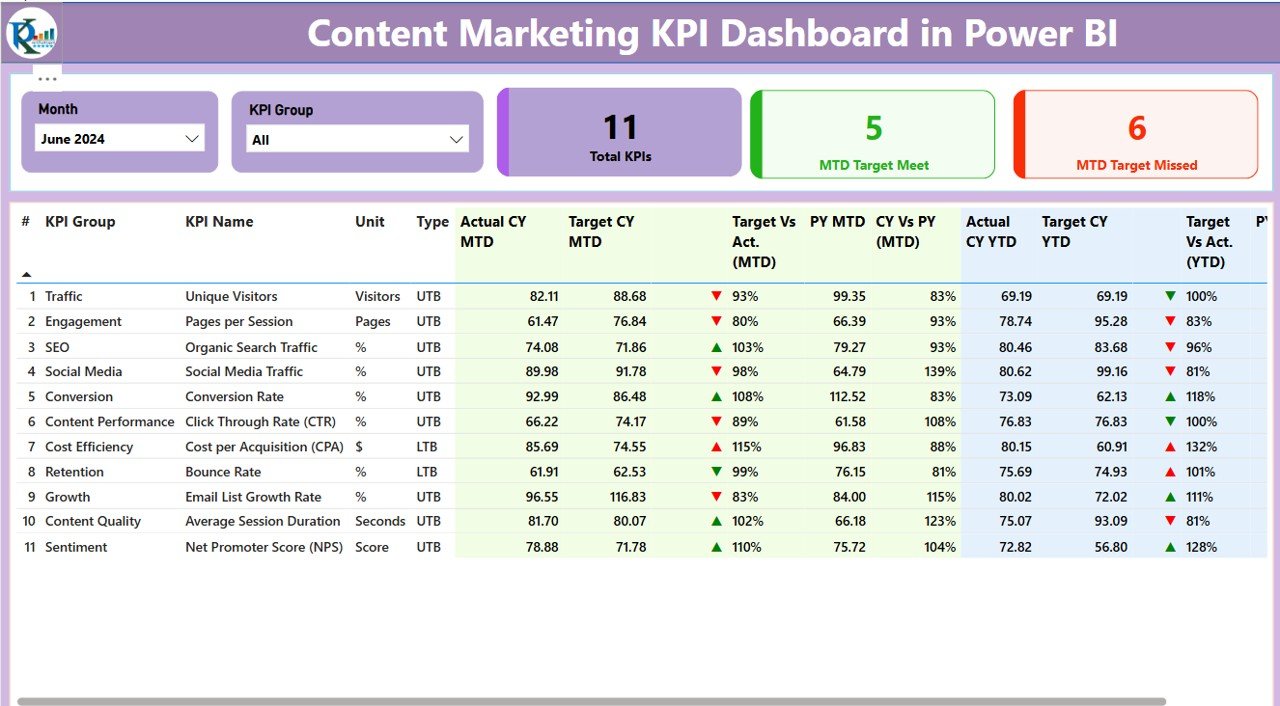
The Summary Page is the main page of the Power BI dashboard, where most of the crucial insights are presented. It helps content marketers monitor KPIs effectively by offering a quick overview of the content performance across various dimensions.
-
Slicers: The slicers for “Month” and “KPI Group” allow users to filter data easily.
-
KPIs Displayed: Three cards showcase the total KPIs count, MTD (Month-To-Date) Target Meet count, and MTD Target Missed count.
KPI Table: A detailed table below displays the following:
-
KPI Number: The sequence number of the KPI.
-
KPI Group: The category of the KPI.
-
KPI Name: The name of the KPI.
-
Unit: The unit of measurement (e.g., conversions, engagement).
-
Type: Defines whether the KPI is LTB (Lower the Better) or UTB (Upper the Better).
-
Actual CY MTD: Current year MTD performance.
-
Target CY MTD: The target value for the current month.
-
MTD Icon: A color-coded icon (red or green) indicating the performance status.
-
Target vs Actual (MTD): The percentage difference between the target and the actual for MTD.
In addition, the table displays YTD (Year-to-Date) performance and comparisons between current and previous year’s MTD and YTD data.
KPI Trend Page: Visualizing Progress Over Time
The KPI Trend page is an essential part of the dashboard. It includes:
-
Combo Charts: These display the trends for both MTD and YTD performance, comparing the actual numbers for the current year and previous year against set targets.
-
KPI Selector: A slicer on the left allows you to filter KPIs and visualize trends across various metrics.
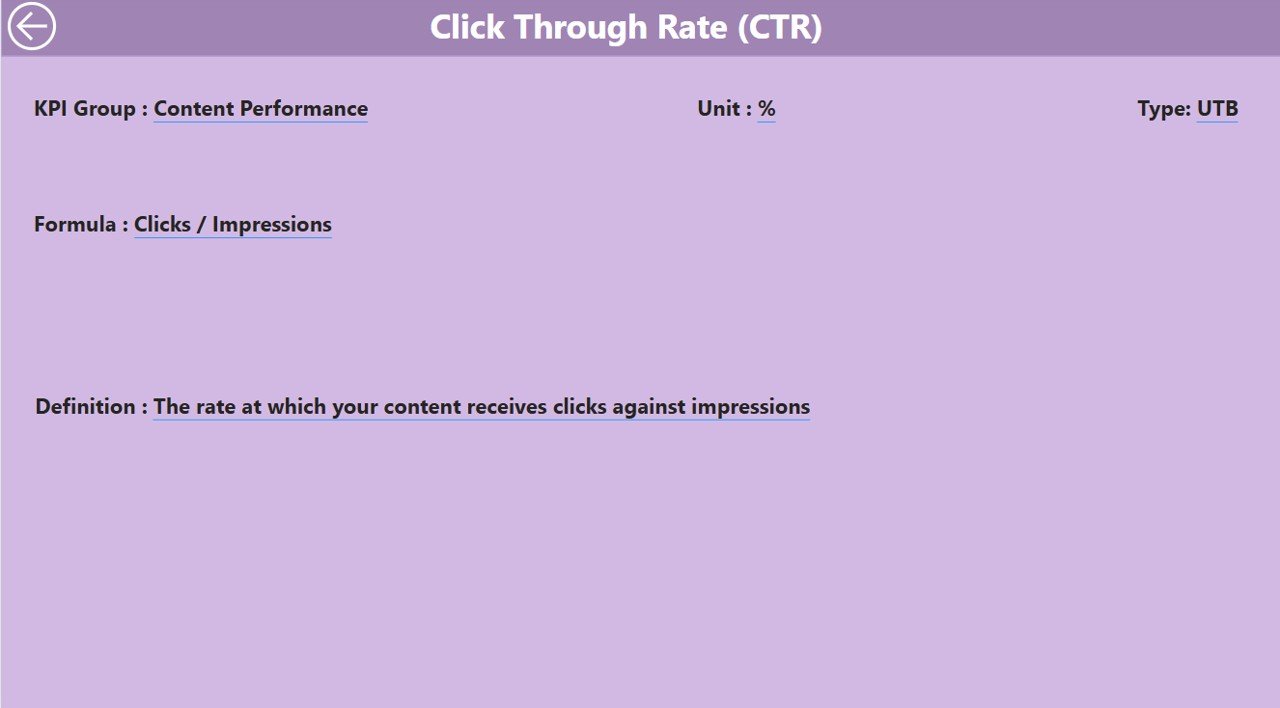
KPI Definition Page: Detailed Information at Your Fingertips
The KPI Definition page is a hidden drill-through page, offering detailed insights into each KPI:
-
Formula: Understand the formula behind each KPI.
-
Definition: A clear explanation of what each KPI represents and why it’s essential for content marketing performance.
Excel Data: The Backbone of Your Dashboard
The dashboard is powered by Excel data. Three key sheets need to be filled in:
-
Input_Actual: This sheet contains actual performance data for each KPI, month, and year-to-date values.
-
Input_Target: Here, you enter target values for the KPIs, providing a benchmark for comparison.
-
KPI_Definition: This sheet captures the technical details of each KPI, including the formula, unit of measurement, and type.
Advantages of Using a Content Marketing KPI Dashboard in Power BI
Content marketing can sometimes feel like navigating in the dark. However, with the right KPIs and data visualization tools, you can turn uncertainty into strategy. Here’s why a Content Marketing KPI Dashboard is essential:
-
Data Centralization: All your content marketing data is in one place, reducing manual work and confusion.
-
Improved Decision Making: Real-time access to KPIs ensures you make quick and informed decisions.
-
Performance Tracking: The dashboard tracks the performance of various content strategies, helping you identify which tactics are working and which need adjustments.
-
Efficient Resource Allocation: By understanding which content pieces perform best, you can allocate resources more effectively, focusing on high-return areas.
Best Practices for Building a Content Marketing KPI Dashboard in Power BI
To ensure the best results from your Content Marketing KPI Dashboard, consider the following best practices:
-
Keep KPIs Aligned with Business Goals
Focus on KPIs that align directly with your business objectives, whether that’s lead generation, brand awareness, or sales conversions. -
Ensure Real-Time Data Updates
Your dashboard must be connected to live data sources to ensure accuracy and timeliness in reporting. -
Simplify User Interface
While it’s tempting to add a lot of features, keep the dashboard simple, so users can quickly access and understand key metrics. -
Make Use of Visual Indicators
Use color-coding and graphical indicators like icons, bars, and trends to highlight important metrics, making it easier to interpret data at a glance. -
Customize for Different Roles
Customize views and access based on the role of the user, ensuring each team member can focus on the KPIs that matter most to them.
How Can Content Marketers Benefit from a KPI Dashboard?
Content marketers can benefit significantly from a KPI dashboard by:
-
Monitoring ROI: Track the effectiveness of your content efforts in terms of traffic, engagement, and conversions.
-
Optimizing Content Strategy: Identify high-performing content, topics, and formats, allowing marketers to replicate successful strategies.
-
Improving Audience Targeting: By analyzing KPIs related to audience behavior, marketers can refine their targeting strategies.
Frequently Asked Questions (FAQ)
Click to Purchases Content Marketing KPI Dashboard in Power BI
1. What KPIs should I track for content marketing?
Essential KPIs include website traffic, engagement rates (likes, shares, comments), conversion rates, lead generation, and customer retention. Tailor these KPIs to your business objectives.
2. How can I customize the Content Marketing KPI Dashboard for my business?
Customize the dashboard by adding or removing KPIs, adjusting data filters, and changing chart types to match your industry needs and business goals.
3. Is the Content Marketing KPI Dashboard in Power BI easy to use?
Yes, Power BI provides an intuitive interface with drag-and-drop features, making it easy to set up and navigate, even for users with minimal technical expertise.
4. Can I integrate this dashboard with other marketing tools?
Yes, Power BI allows integration with various data sources, including social media platforms, email marketing tools, and CRM systems, making it easy to import and visualize data from multiple channels.
5. How often should I update the KPIs in the dashboard?
Ideally, update the KPIs monthly or quarterly, depending on your reporting cycle. If you’re using real-time data sources, you can update them more frequently.
Conclusion
A Content Marketing KPI Dashboard in Power BI is an indispensable tool for content marketers looking to optimize their strategies. By providing a clear, visual representation of content performance, the dashboard empowers businesses to make data-driven decisions. With the right KPIs, trends, and actionable insights, marketers can track performance, optimize efforts, and ultimately drive greater success.
Visit our YouTube channel to learn step-by-step video tutorials


