Crowdfunding has become one of the fastest-growing digital fundraising methods across the world. As more creators, entrepreneurs, and social initiatives turn to online platforms to raise funds, the need for strong analytics becomes more important. Today, successful crowdfunding depends not only on how appealing a campaign looks but also on how well teams analyze performance, track donor behavior, and monitor funding progress.
This is exactly where a Crowdfunding Platforms Dashboard in Power BI becomes a game-changer. Because it visualizes data in simple, interactive charts and cards, it helps you make faster, smarter, and more accurate decisions. Whether you manage a crowdfunding company, run campaigns, or track platform performance, this dashboard gives you complete clarity on fundraising activities.
In this detailed guide, you will explore the features of this dashboard, understand how each page works, learn about its advantages, and discover best practices that help you get maximum value from your data.
Click to Purchases Crowdfunding Platforms Dashboard in Power BI
What Is a Crowdfunding Platforms Dashboard in Power BI?
A Crowdfunding Platforms Dashboard in Power BI is a dynamic reporting system that visually represents all key performance indicators related to donations, campaign performance, platform rating, commission earned, funding progress, and donor trends. It collects structured data and converts it into easy-to-understand visuals so that teams can track performance instantly.
Because Power BI supports slicers, drill-downs, and advanced visual elements, this dashboard becomes a powerful decision-making tool. It helps you monitor:
-
Funding success rate
-
Average donations
-
Commission earned by platform or category
-
Donation trends by region
-
Campaign type performance
-
User satisfaction ratings
This gives you a complete 360-degree view of how your crowdfunding ecosystem performs.
Click to Purchases Crowdfunding Platforms Dashboard in Power BI
Why Analytics Matter in Crowdfunding
Crowdfunding depends heavily on user engagement, trust, campaign quality, and platform reliability. Therefore, deep insights help you identify patterns and make smart adjustments.
A strong dashboard helps you:
-
Measure what drives successful campaigns
-
Improve campaign quality
-
Understand donor behavior
-
Track platform performance
-
Identify weak areas
-
Improve customer support
-
Strengthen marketing strategies
Since all insights are visual, your team can make better decisions in less time.
Click to Purchases Crowdfunding Platforms Dashboard in Power BI
Key Features of the Crowdfunding Platforms Dashboard in Power BI
This dashboard includes five fully interactive pages, each designed to deliver unique insights. Together, they help you understand every aspect of your crowdfunding performance in detail.
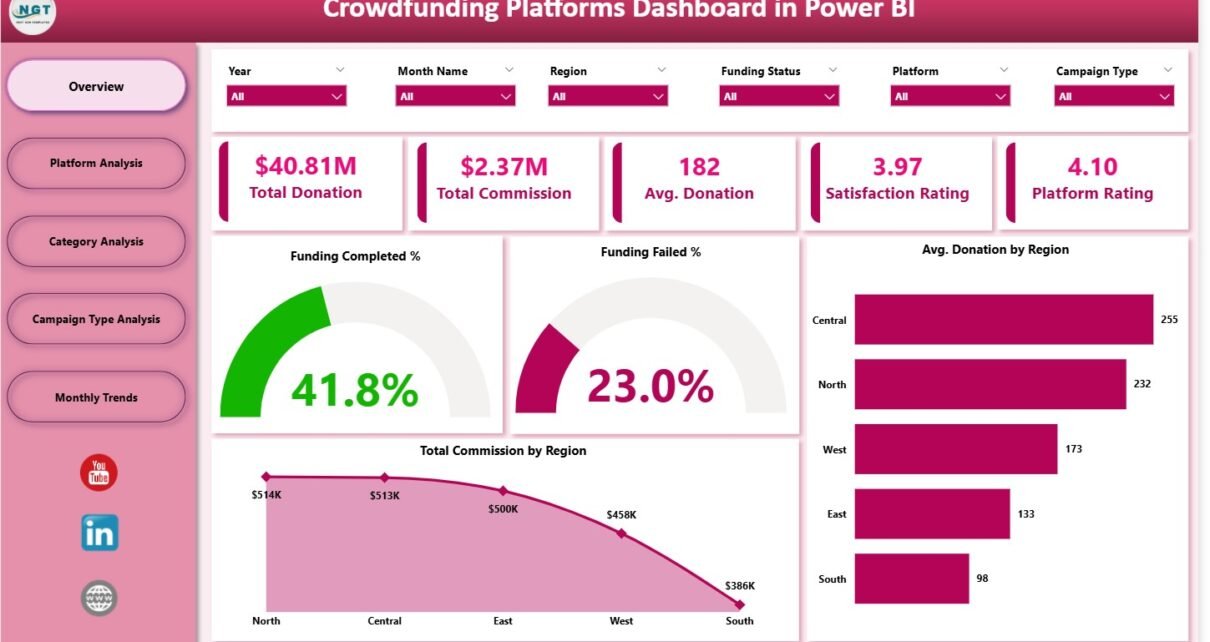
1. Overview Page – The Main Summary Dashboard
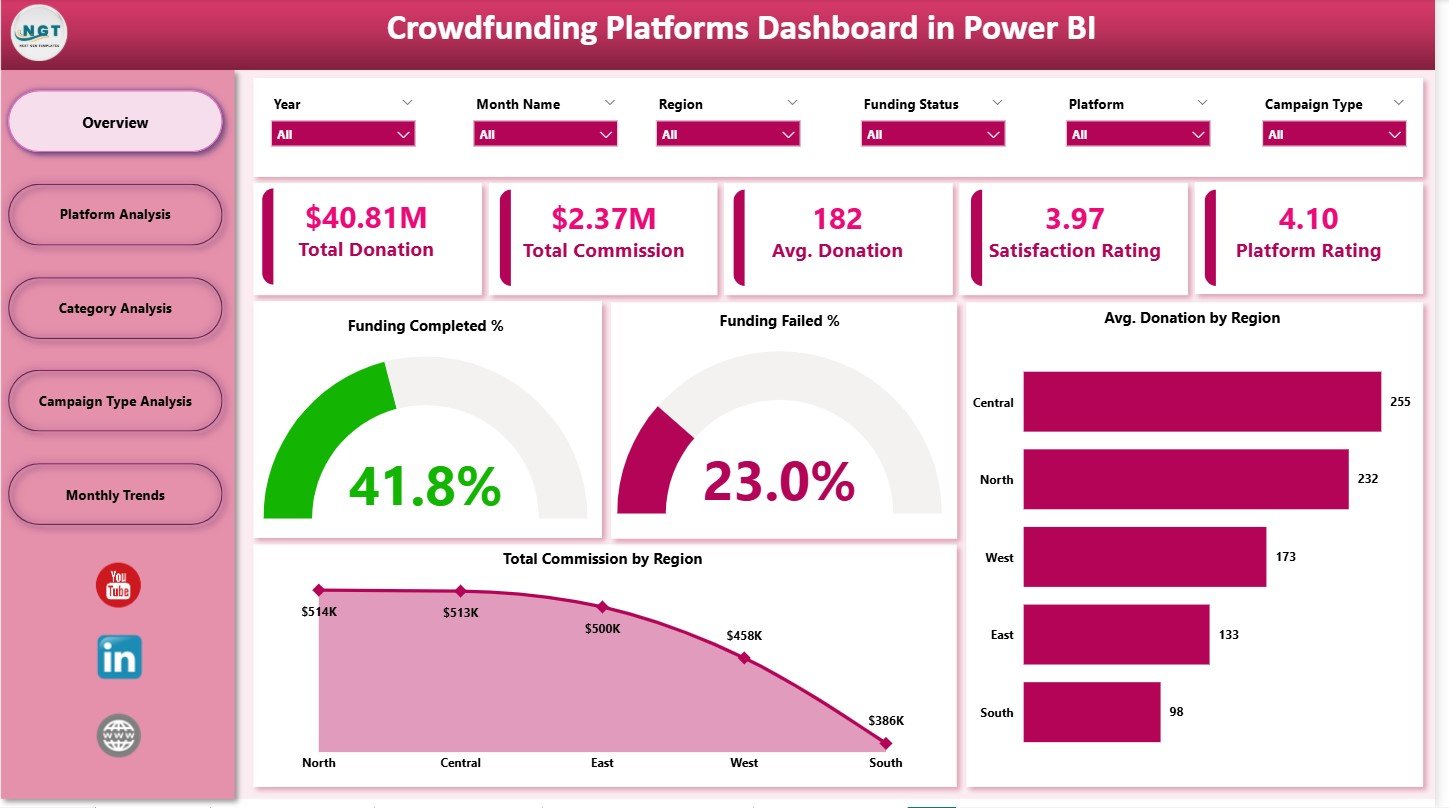
The Overview Page is the heart of the dashboard. It gives a complete snapshot of all important KPIs with the help of cards, slicers, and charts.
✔ Slicers
On the left side, you have slicers that allow you to filter the data by platform, category, month, campaign type, or region depending on the dataset. When you select any option, all visuals update instantly.
✔ KPI Cards
The Overview Page includes five important KPI cards, usually displaying:
-
Funding Completed %
-
Funding Failed %
-
Average Donation
-
Total Donation
-
Total Commission
Because these KPIs appear at the top, you get an instant understanding of your platform’s health.
✔ Visual Charts
The page also includes four powerful charts:
-
Funding Completed %
– Shows the success percentage of campaigns. -
Funding Failed %
– Helps identify gaps or challenges in fundraising. -
Average Donation by Region
– Displays how donor amounts vary across locations. -
Total Commission by Region
– Helps track earnings based on geographical performance.
Because these visuals are clear and interactive, decision-makers can quickly analyze regional growth, donor engagement, and campaign outcomes.
Click to Purchases Crowdfunding Platforms Dashboard in Power BI
2. Platform Analysis – Performance Evaluation by Platform
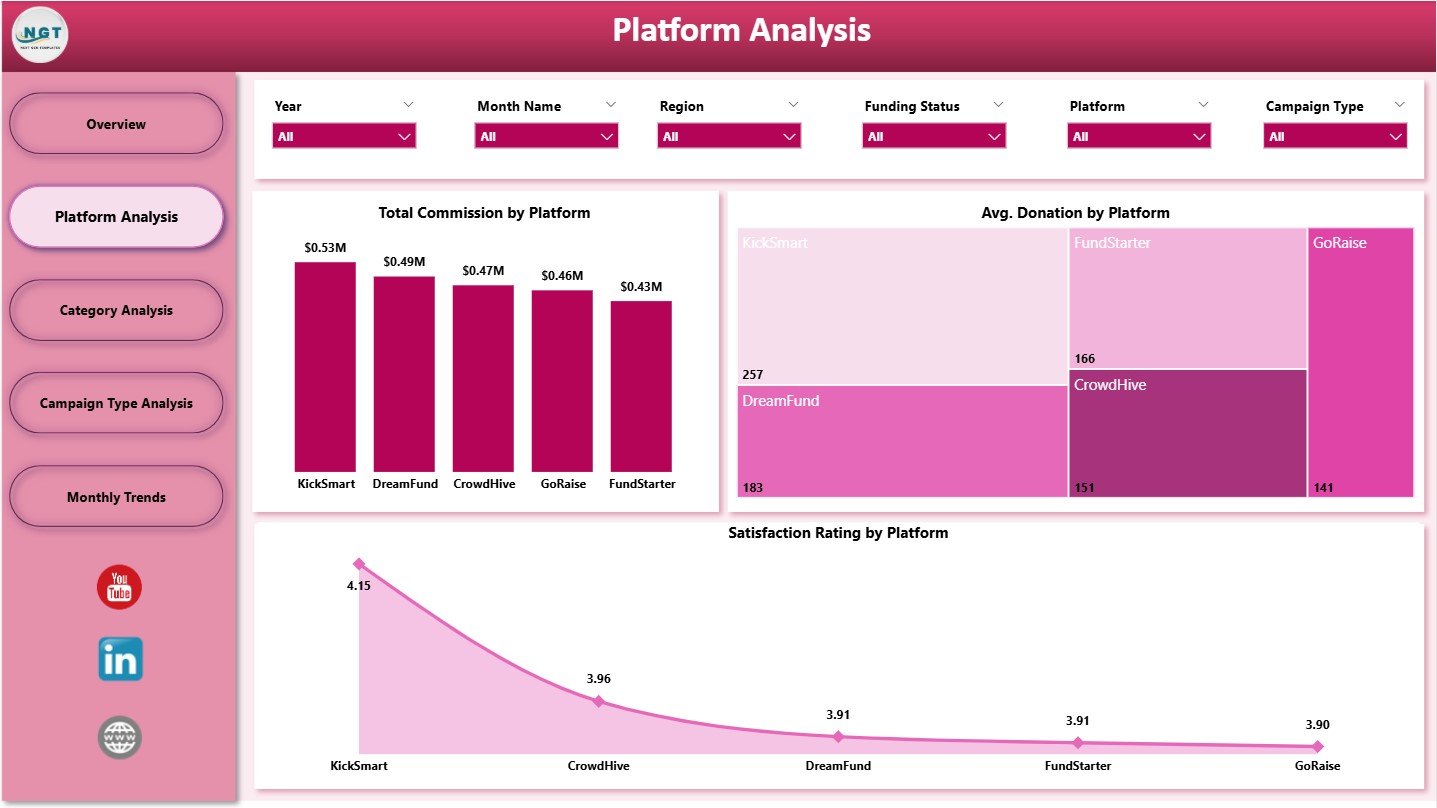
This is the second page of the dashboard and focuses entirely on platform-level insights.
It includes slicers and three deep-analysis charts:
✔ Total Commission by Platform
This chart shows which platform generates the highest earnings. It helps teams:
-
Identify top-performing platforms
-
Allocate resources better
-
Optimize platform partnerships
✔ Average Donation by Platform
This reveals donor behavior for each platform. It helps you understand:
-
Which platforms attract high-value donors
-
Which ones need improvement
-
How donor patterns differ across platforms
✔ Satisfaction Rating by Platform
This chart shows user satisfaction scores, which impact customer trust. Because user experience plays a key role in crowdfunding success, these insights help improve:
-
Platform design
-
Support services
-
Communication strategies
-
Campaign guidelines
The Platform Analysis page helps you analyze performance from a business and user perspective.
Click to Purchases Crowdfunding Platforms Dashboard in Power BI
3. Category Analysis – Know Which Campaign Categories Perform Best
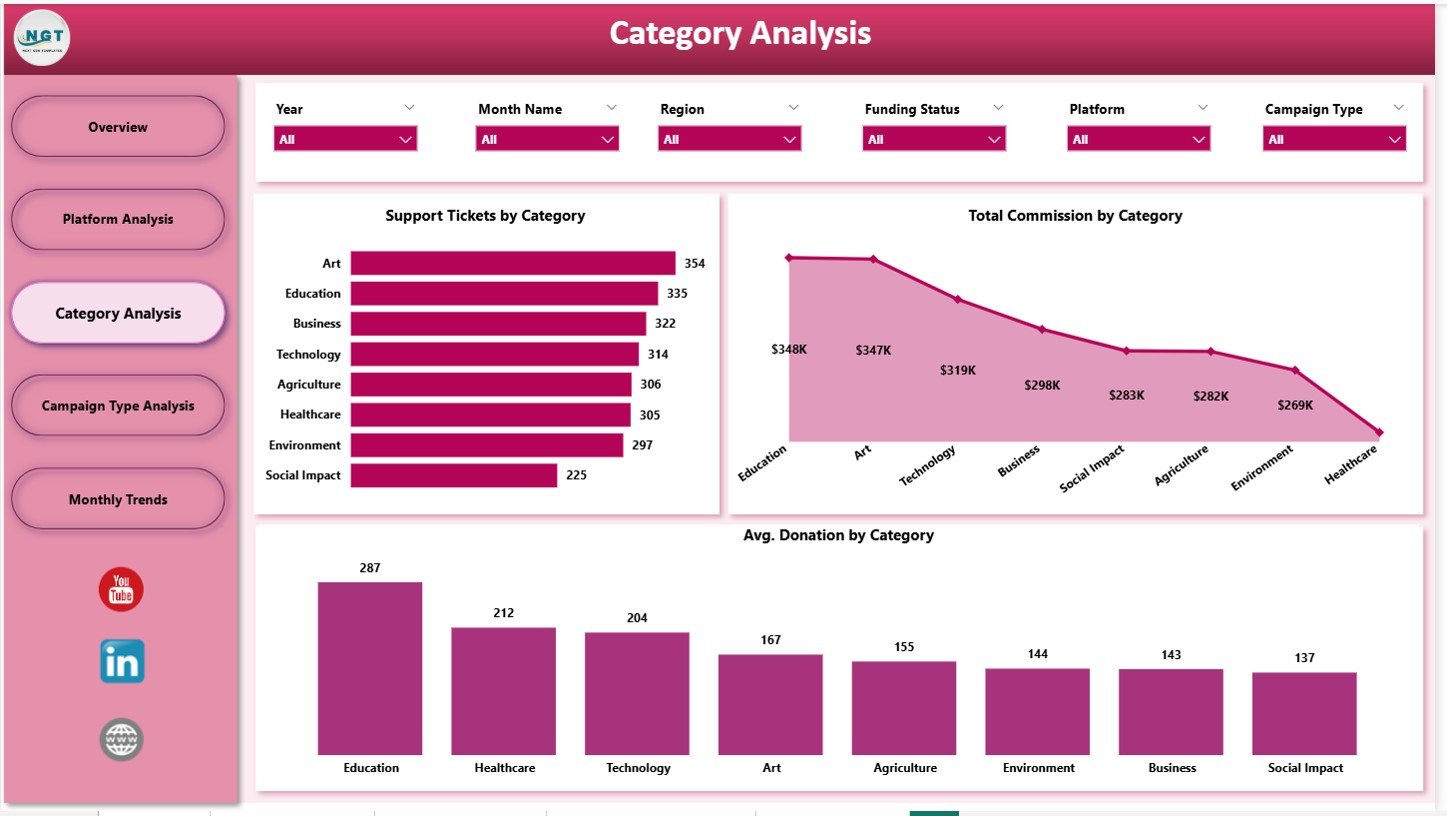
This is the third page of the dashboard and focuses on category-based insights. It includes slicers and three important charts:
✔ Support Tickets by Category
This shows which categories face more customer issues. With this insight, you can:
-
Improve support processes
-
Identify categories with high complaints
-
Boost user satisfaction
✔ Total Commission by Category
This chart displays revenue generated by category. It helps identify the most profitable niches.
✔ Average Donation by Category
This helps you understand which categories attract the highest donor interest. You can analyze:
-
Charity
-
Technology
-
Creative Projects
-
Health
-
Education
-
Social Causes
This page helps you recognize patterns and plan future campaigns more effectively.
4. Campaign Type Analysis – Deep Insight Into Campaign Styles
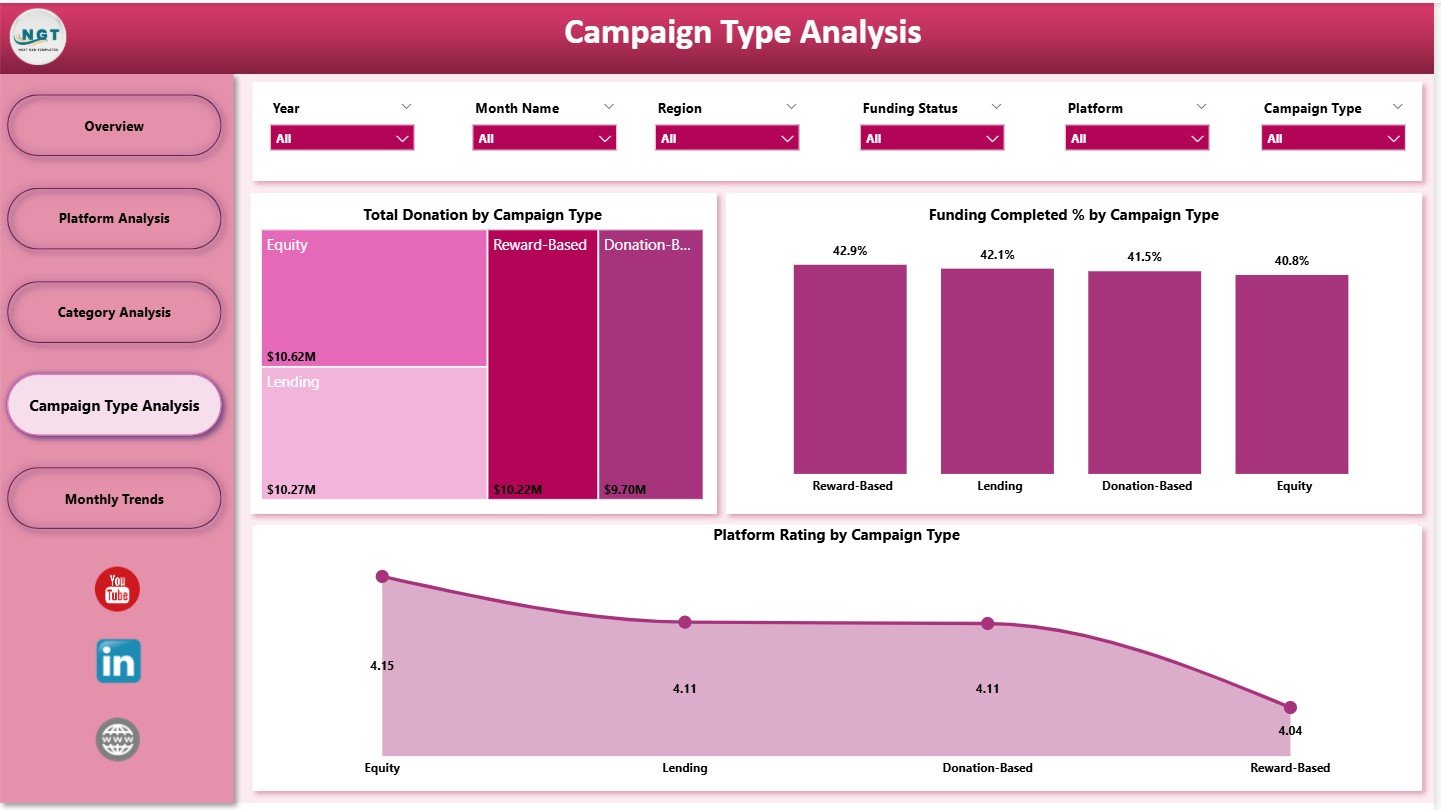
The fourth page of the dashboard focuses on campaign types. Every crowdfunding platform supports multiple campaign styles, such as:
-
All-or-Nothing
-
Keep-it-All
-
Reward-based
-
Donation-based
-
Equity crowdfunding
This page shows three important charts:
✔ Total Donation by Campaign Type
This visual helps identify which campaign style performs best in terms of fundraising.
✔ Funding Completed % by Campaign Type
This chart shows which campaign types meet or exceed their fundraising goals.
✔ Platform Rating by Campaign Type
This helps evaluate campaign quality and donor satisfaction across styles.
Because this page provides detailed campaign-level comparisons, it helps you improve campaign design and marketing strategies.
Click to Purchases Crowdfunding Platforms Dashboard in Power BI
5. Monthly Trends – Month-Wise Performance Tracking
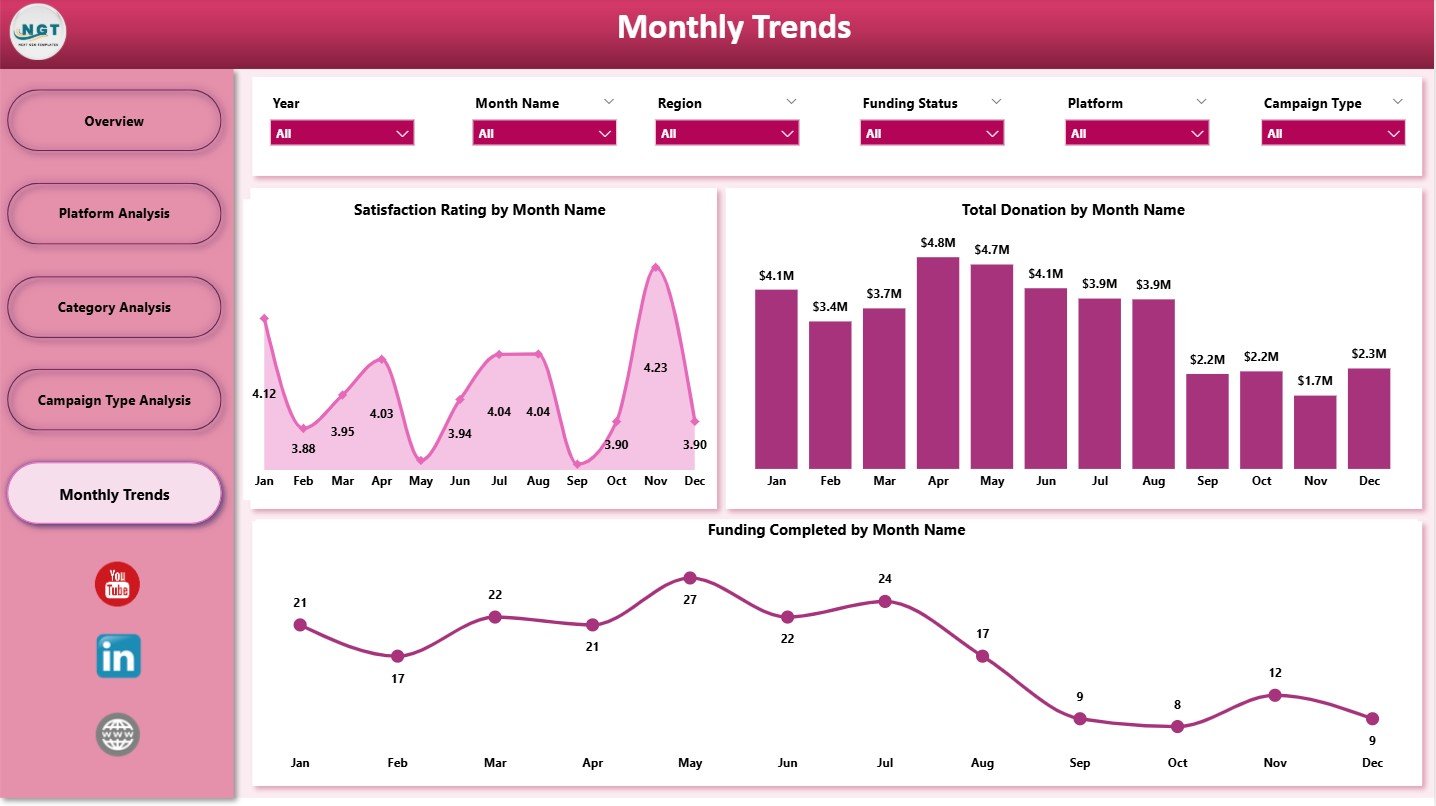
The Monthly Trends page helps monitor:
-
Seasonal donation patterns
-
Funding cycles
-
User engagement
-
Marketing performance
-
Fluctuations in success rates
It contains three powerful trend charts:
✔ Satisfaction Rating by Month
Tracks how user satisfaction changes over the year.
✔ Total Donation by Month
Reveals donation peaks and slow periods. This helps prepare better marketing campaigns.
✔ Funding Completed % by Month
Shows success rate changes month-to-month.
Because month-wise analysis highlights behavior patterns, teams can plan better campaigns, allocate budgets wisely, and improve platform success.
Click to Purchases Crowdfunding Platforms Dashboard in Power BI
Advantages of Using a Crowdfunding Platforms Dashboard in Power BI
Because this dashboard provides complete visibility into campaign and donor performance, it offers many advantages:
✔ 1. Complete Real-Time Insights
Teams get instant clarity through KPI cards and visual charts.
✔ 2. Strong Decision-Making Power
Data-driven decisions help increase campaign success rates.
✔ 3. Better Campaign Strategy
You can analyze donation behavior and plan campaigns accordingly.
✔ 4. Improved User Experience
Satisfaction ratings reveal platform improvement areas.
✔ 5. Strong Revenue Analytics
Commission tracking helps understand earnings better.
✔ 6. High Customization
Teams can add new charts, slicers, KPIs, or filters anytime.
✔ 7. Reduced Manual Reporting
Power BI automates all calculations and visual updates.
✔ 8. Easy Comparison Across Dimensions
You can compare performance by:
-
Region
-
Platform
-
Campaign type
-
Category
-
Month
This gives a deep understanding of business patterns.
Best Practices for Using the Crowdfunding Dashboard
1. Update Data Regularly
Weekly or monthly updates help maintain accurate insights.
2. Use Filters Before Making Decisions
Slicers allow you to view multiple scenarios.
3. Review Monthly Trends Each Cycle
Trend visuals highlight seasonal behaviors.
4. Monitor Satisfaction Ratings Closely
These ratings directly impact campaign success.
5. Use Category Analysis for Future Planning
This helps you choose profitable and high-engagement categories.
6. Standardize KPI Definitions
Clear definitions prevent confusion among team members.
7. Compare Target vs Actual Frequently
This helps identify performance gaps early.
Click to Purchases Crowdfunding Platforms Dashboard in Power BI
Real-World Use Cases of the Crowdfunding Dashboard
✔ Case 1: Improving Campaign Success Rate
A platform noticed low funding completion rates. By analyzing campaign types and categories, they adjusted guidelines and increased the success rate by 30%.
✔ Case 2: Identifying High-Value Donor Regions
Trend charts showed certain regions donated higher amounts. The marketing team focused more on those regions and increased total donations.
✔ Case 3: Reducing Support Tickets
Category analysis showed specific categories had more complaints. Improving those categories brought a 40% drop in tickets.
✔ Case 4: Enhancing Platform Reputation
Satisfaction ratings helped the company identify issues in the checkout process, leading to higher ratings.
Conclusion
The Crowdfunding Platforms Dashboard in Power BI is a powerful analytics system for tracking fundraising results, donor patterns, campaign outcomes, platform performance, and month-wise trends. With interactive slicers, KPIs, and dynamic visual charts, it gives businesses complete insight into every stage of the crowdfunding journey.
Because the dashboard covers all key dimensions—platform, category, campaign type, region, and monthly trends—it becomes an essential tool for improving success, increasing engagement, and maximizing revenue.
Whether you run a small crowdfunding platform or a large global marketplace, this dashboard helps you make smarter decisions and grow faster.
Click to Purchases Crowdfunding Platforms Dashboard in Power BI
Frequently Asked Questions (FAQs)
1. What does the Crowdfunding Dashboard track?
It tracks donations, commissions, platform performance, campaign outcomes, satisfaction ratings, and monthly trends.
2. Can beginners use this dashboard?
Yes. Power BI visuals make it simple for all users.
3. Can I add my own KPIs?
Absolutely. The dashboard is fully customizable.
4. How often should the data be updated?
Monthly updates are ideal, but weekly updates work even better.
5. Does it support filtering?
Yes, slicers allow you to filter by region, platform, category, and more.
6. Can I export visuals?
Yes, Power BI allows exporting to PDF, PowerPoint, or images.
7. Is it useful for campaign managers?
Yes, it helps them plan better campaigns and identify improvement areas.
8. Does it show revenue insights?
Yes, total commission charts show revenue performance clearly.
Click to Purchases Crowdfunding Platforms Dashboard in Power BI
Visit our YouTube channel to learn step-by-step video tutorials