In today’s competitive business environment, sustainability in customer service is no longer a luxury—it’s a necessity. Customers expect fast responses, efficient solutions, and a seamless support experience. But how can businesses monitor and optimize these support systems sustainably?
Enter the Customer Service and Support Sustainability KPI Dashboard in Excel—a powerful, easy-to-use tool designed to track and enhance your service operations while promoting long-term sustainability. Whether you manage a small business or a large-scale support center, this dashboard helps you stay on top of your performance with real-time insights and measurable results.
Click to Purchases Customer Service and Support Sustainability KPI Dashboard in Excel
What Is the Customer Service and Support Sustainability KPI Dashboard?
This Excel-based KPI dashboard template helps service teams track Key Performance Indicators (KPIs) that drive both efficiency and sustainability. By monitoring metrics such as issue resolution time, customer satisfaction rate, and support channel usage, businesses can fine-tune operations for better results.
It includes interactive charts, trend analysis, conditional formatting, and dropdown filters to make data analysis effortless. The dashboard also allows for month-over-month and year-over-year comparisons, promoting informed decision-making.
Why Use an Excel-Based Sustainability Dashboard for Customer Service?
While there are many customer service tools out there, Excel offers several unique benefits:
✅ No Learning Curve – Most teams already use Excel.
📊 Customizable – You can adjust formulas, formats, and layouts.
🔒 Secure and Offline – No cloud dependencies.
🏷️ Cost-Effective – No recurring subscription required.
This dashboard is built to help teams reduce waste, optimize agent workloads, and achieve long-term service excellence—without breaking the bank.
Key Features of the Dashboard
This KPI Dashboard consists of 7 structured worksheets, each serving a unique purpose to deliver a comprehensive view of customer service sustainability:
Home Sheet
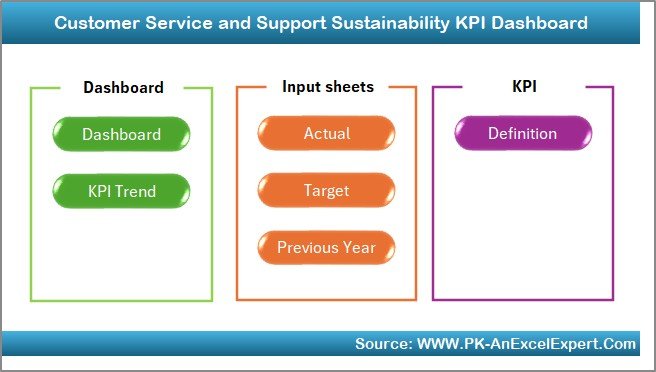
This is the entry point of the dashboard. It features:
-
🧭 Navigation Buttons: Instantly jump to any of the 6 functional tabs.
-
🎯 User-Friendly Design: Helps reduce time spent searching through tabs.
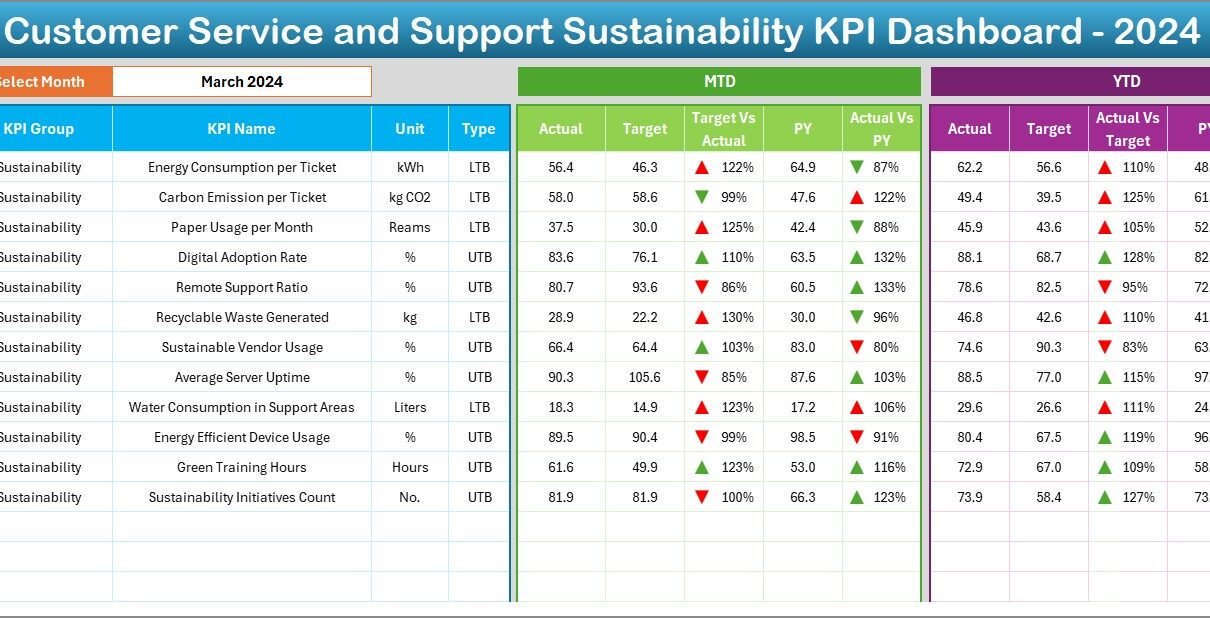
Dashboard Sheet
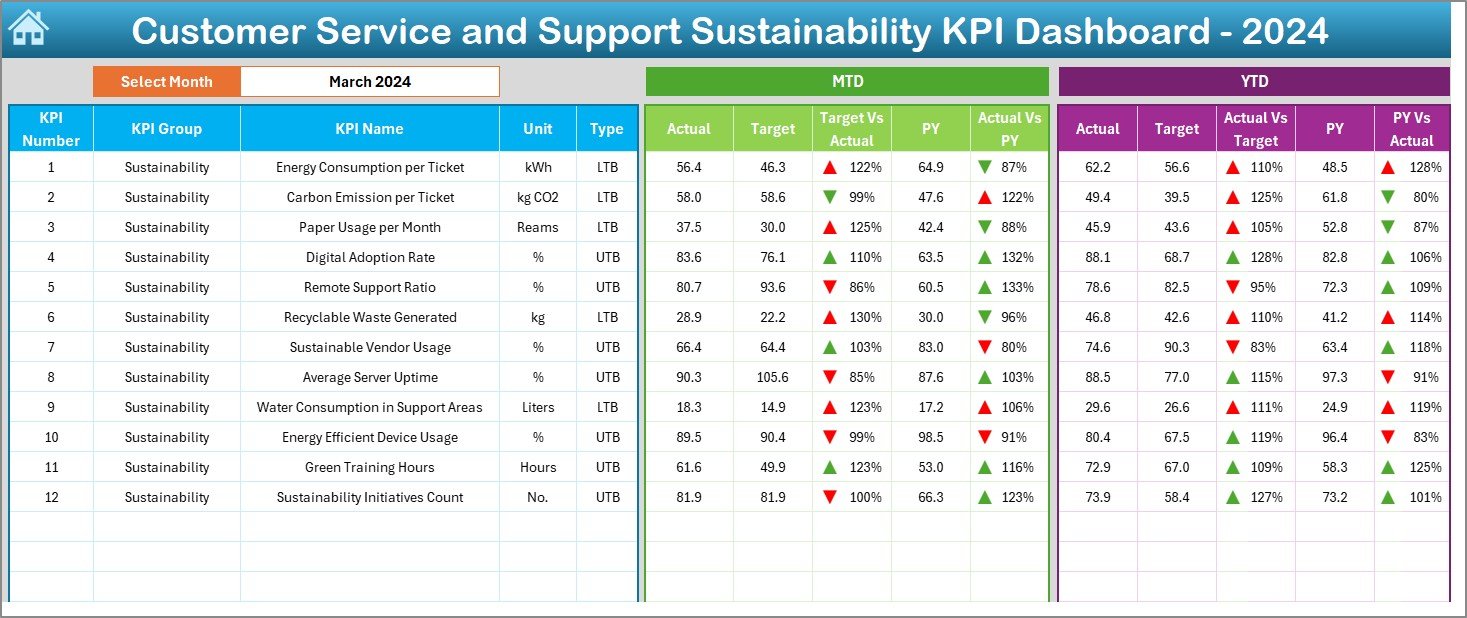
The core analytical view of the system. Key components include:
📅 Month Selection (Cell D3) – Use the dropdown to pick any month.
Click to Purchases Customer Service and Support Sustainability KPI Dashboard in Excel
📈 KPI Cards showing:
- MTD (Month-to-Date) Actual, Target, and Previous Year
- YTD (Year-to-Date) Actual, Target, and Previous Year
-
🔺🔻 Conditional Formatting – Visual cues like arrows to indicate performance trends
-
🎯 Comparison Metrics – Target vs Actual, PY vs Actual
KPI Trend Sheet
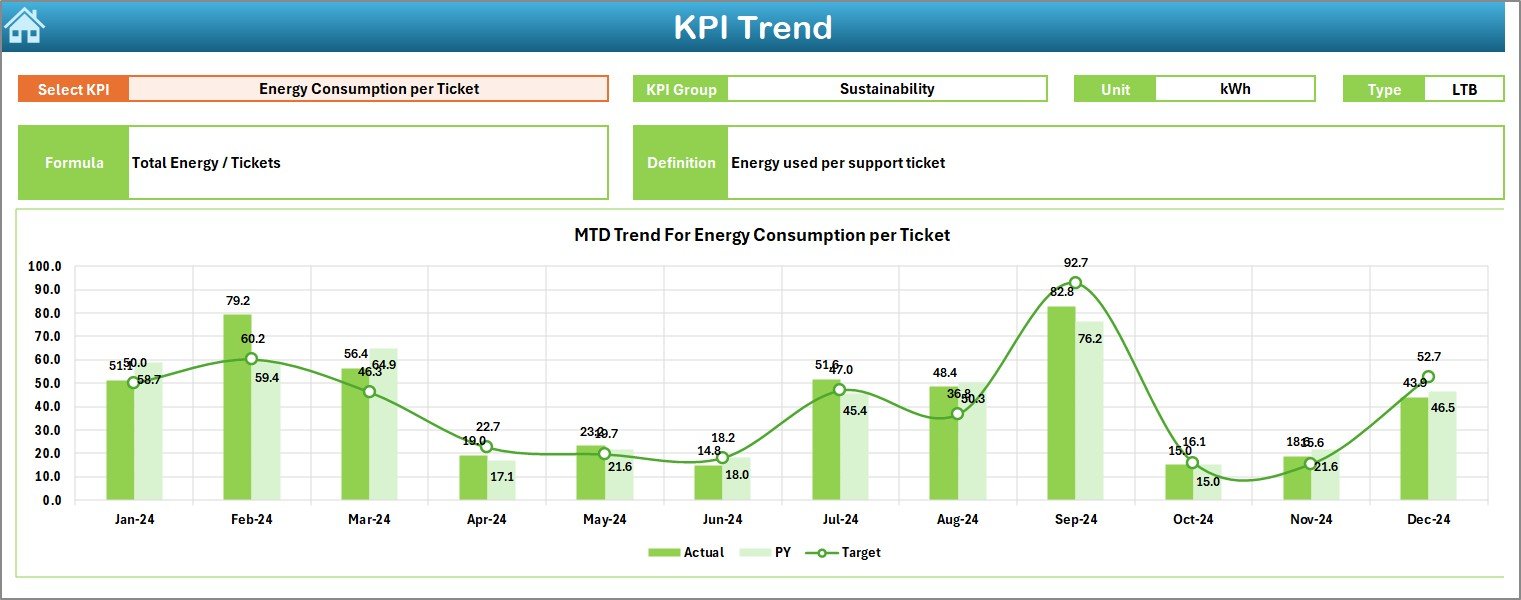
Provides a deeper insight into KPI behavior:
-
📝 KPI Dropdown (Cell C3) – Select any KPI to view its trend.
-
📊 MTD and YTD Trend Charts – Analyze changes over time.
-
📌 KPI Metadata – Includes Group, Unit, Type (LTB/UTB), Formula, and Definition.
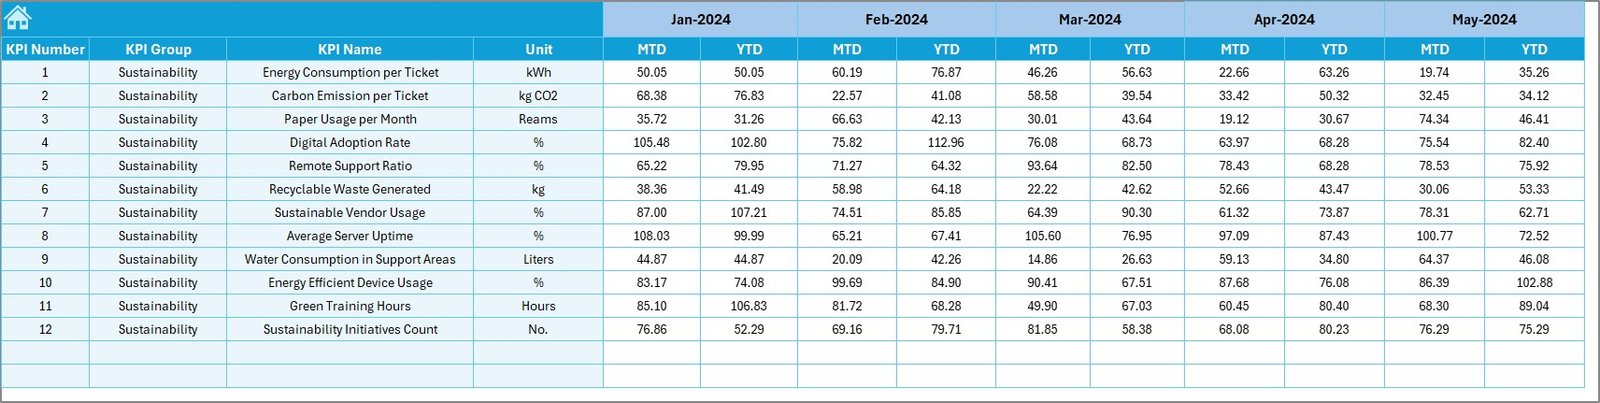
Actual Numbers Input
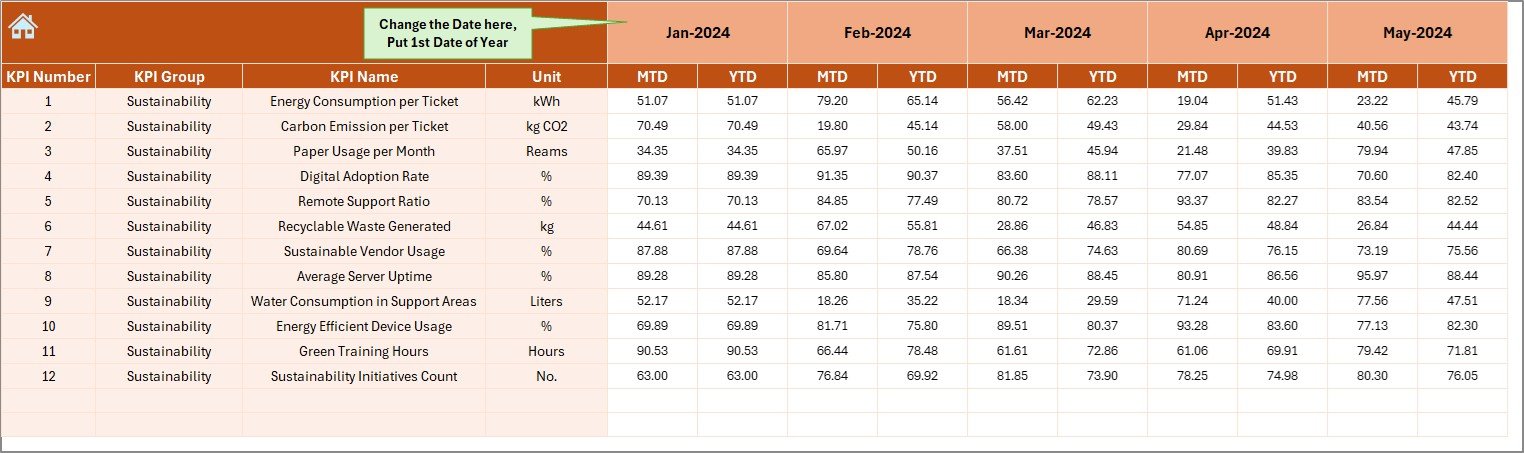
This is where real-time data comes in:
-
🔢 Enter monthly actual figures for both MTD and YTD.
-
📆 Dynamic Start Month (Cell E1) – Set the first month of your fiscal year.
Target Sheet
Input planned performance numbers:
-
🎯 Set monthly targets for each KPI.
-
🔄 Supports both MTD and YTD entries to keep tracking aligned with real performance.
Previous Year Numbers
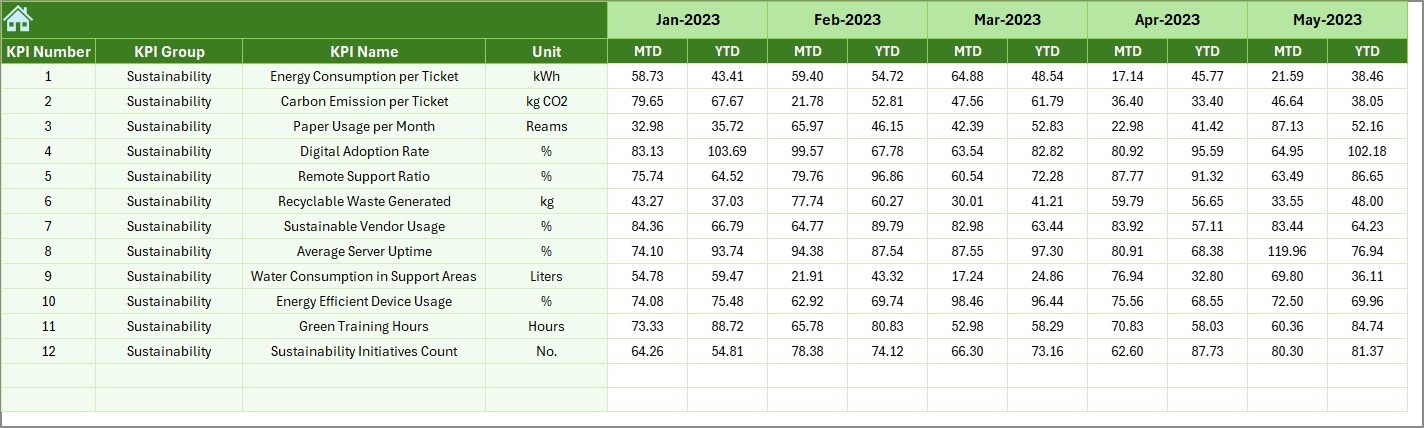
Here, you input last year’s KPI data:
-
⏮️ Compare year-over-year trends to identify improvement or decline.
-
📘 Used in trend charts and dashboard comparisons.
KPI Definition Sheet
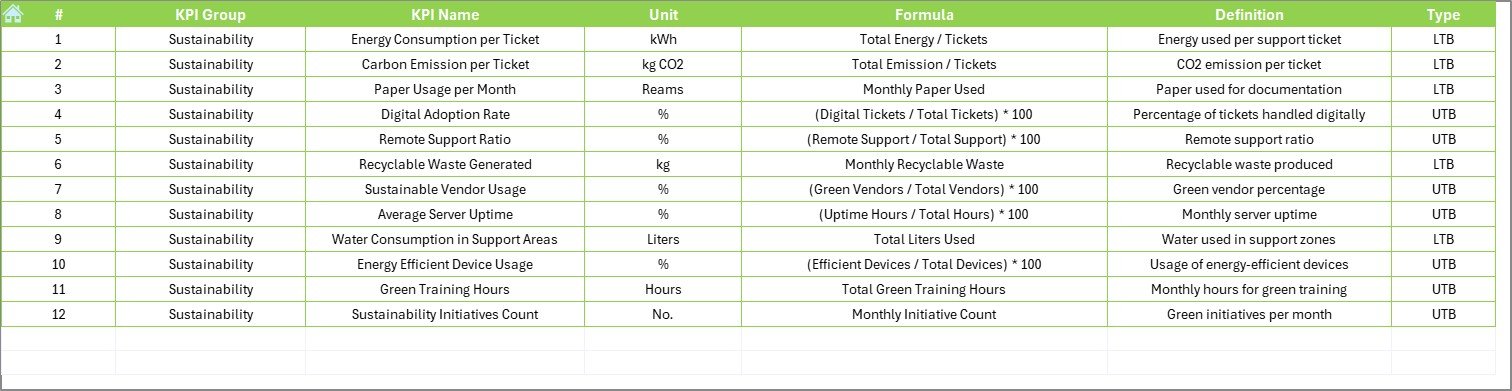
Define your KPIs in a structured format:
-
🔍 Columns include KPI Name, Group, Unit, Formula, and Definition.
-
✅ Essential for alignment and accuracy in performance evaluation.
Advantages of Customer Service and Support Sustainability KPI Dashboard
Click to Purchases Customer Service and Support Sustainability KPI Dashboard in Excel
There are numerous benefits to using this tool, especially when you’re focused on sustainable operations. Some of the major advantages include:
-
✔️ Improved Visibility
Track MTD and YTD data for all important KPIs in one place. -
✔️ Faster Decision-Making
Use actionable data and visuals to take corrective actions quickly. -
✔️ Sustainable Performance
Monitor long-term trends and focus on metrics that support consistent service excellence. -
✔️ Enhanced Customer Experience
Identify bottlenecks and improve service delivery based on KPI insights. -
✔️ Team Accountability
Align agents and managers with transparent performance expectations. -
✔️ Data-Driven Culture
Encourage sustainable practices by evaluating actual vs. target metrics.
Best Practices for Using the Dashboard Effectively
To get the most from the Customer Service and Support Sustainability KPI Dashboard, follow these proven best practices:
-
✅ Define SMART KPIs
Make sure your KPIs are Specific, Measurable, Achievable, Relevant, and Time-bound. -
✅ Update Data Regularly
Keep actual, target, and previous year numbers current to ensure accuracy. -
✅ Review Trends Monthly
Use the KPI Trend sheet to analyze which areas need improvement. -
✅ Use Conditional Formatting Wisely
The up/down arrows give quick insight—don’t ignore them. -
✅ Train Your Team
Ensure your team understands how to interpret the dashboard visuals. -
✅ Align KPIs with Business Goals
Make sure your sustainability KPIs reflect customer retention, service quality, and resource optimization.
What Are Some Common KPIs for Customer Service Sustainability?
Here are some key sustainability-related KPIs that are ideal for this dashboard:
-
Customer Satisfaction Score (CSAT) – Measures immediate feedback.
-
First Response Time – Time taken to respond to initial queries.
-
Resolution Time – How long it takes to fully resolve an issue.
-
Ticket Volume Trend – Monthly fluctuations in support requests.
-
Escalation Rate – Measures service issues passed to higher tiers.
-
SLA Compliance Rate – Percentage of tickets resolved within SLA.
-
Agent Utilization – Workload efficiency of support agents.
-
Support Channel Mix – Distribution of tickets across email, chat, phone, etc.
-
Customer Retention Rate – Measures loyalty over time.
-
Sustainable Resolution % – Resolutions that prevent repeat issues.
-
Customer Effort Score (CES) – How easy it is for a customer to get help.
-
Resource Use Per Ticket – Tracks resource efficiency in resolving issues.
How This Dashboard Supports Sustainable Service Goals
Sustainability in customer service means:
-
✅ Reducing resource waste
-
✅ Improving process efficiency
-
✅ Delivering consistent service quality
This Excel dashboard helps organizations:
-
🎯 Focus on long-term improvements, not just short-term fixes
-
🌿 Minimize redundant tasks through trend analysis
-
👥 Align team efforts toward strategic service goals
In short, it brings together performance and sustainability in one cohesive tool.
How to Get Started with the Template
Getting started is easy:
🎯 Download the pre-built template.
📝 Fill in your actual data in the “Actual Numbers Input” sheet.
🎯 Input targets and past year data in respective tabs.
📈 Explore the dashboard to monitor performance and trends.
🔍 Adjust as needed to align with your evolving sustainability goals.
Conclusion
The Customer Service and Support Sustainability KPI Dashboard in Excel is more than a reporting tool—it’s a strategic asset. It empowers support managers to evaluate performance, improve customer satisfaction, and embed sustainability in everyday operations.
From tracking monthly metrics to evaluating long-term trends, this dashboard equips your team with the insights needed to stay competitive, responsive, and sustainable. Whether you’re a startup or an enterprise, it can transform your service operations—one KPI at a time.
Frequently Asked Questions (FAQs)
1. What is a sustainability KPI in customer service?
A sustainability KPI in customer service measures long-term efficiency, resource use, and service quality. Examples include resolution time, resource usage per ticket, and customer effort score.
2. Can I customize this Excel template?
Yes! The Excel-based format allows full customization of formulas, KPI names, layouts, and visuals.
3. Do I need advanced Excel skills to use the dashboard?
Not at all. It’s designed for ease of use. Basic Excel knowledge is enough to get started.
4. How often should I update the KPI data?
You should update MTD and YTD values monthly. Regular updates ensure accurate trend analysis and actionable insights.
5. What’s the difference between LTB and UTB KPIs?
-
LTB (Lower the Better) – Like resolution time or escalation rate
-
UTB (Upper the Better) – Like CSAT or SLA compliance
6. Can I track year-over-year performance with this dashboard?
Absolutely. The “Previous Year Number” sheet lets you compare current and previous year KPIs side-by-side.
7. Is this dashboard suitable for large teams?
Yes. It supports tracking across various KPIs and can be scaled for departments or multiple agents.
8. How does this dashboard promote sustainability?
By tracking metrics that affect efficiency, resource use, and long-term performance, the dashboard helps organizations create a more sustainable support model.
Visit our YouTube channel to learn step-by-step video tutorials