Modern defense and military organizations operate in one of the most complex environments in the world. Every single day, commanders and decision-makers must track budgets, monitor operations, manage personnel, deploy vehicles, and control costs across multiple regions and mission types. However, when this critical data remains scattered across multiple Excel files or static reports, decision-making slows down and risks increase.
That is exactly why a Defense and Military Dashboard in Excel becomes a powerful and practical solution.
In this detailed article, you will learn what a Defense and Military Dashboard in Excel is, why it is essential, how it works, what sheets and analysis it contains, its advantages, best practices, and frequently asked questions. Moreover, this guide uses clear language, real-world logic, and structured explanations so you can understand everything without technical complexity.
Click to buy Defense and Military Dashboard in Excel
What Is a Defense and Military Dashboard in Excel?
A Defense and Military Dashboard in Excel is a ready-to-use, interactive reporting and analytics tool designed to help defense forces and military organizations track performance, resources, and operational efficiency from one centralized location.
Instead of reviewing dozens of disconnected spreadsheets, this dashboard consolidates budget data, personnel deployment, vehicle usage, operational metrics, and regional performance into clear visual charts and KPIs.
As a result, leadership teams gain instant visibility into:
- How budgets get allocated and spent
- Where resources deploy across operations and regions
- Which areas show cost overruns or efficiency gaps
- How deployment trends change month over month
Because Excel remains widely used and trusted across organizations, this dashboard delivers powerful insights without requiring advanced software or complex systems.
Why Do Defense and Military Organizations Need a Dashboard?
Defense and military operations demand precision, accountability, and speed. Therefore, leadership teams cannot afford delays caused by manual reporting or unclear data.
A Defense and Military Dashboard in Excel helps organizations:
- Monitor mission readiness in real time
- Control operational and maintenance costs
- Improve budget utilization
- Enhance transparency across commands and regions
Moreover, this dashboard supports strategic planning, risk management, and resource optimization across multiple operational layers.
What Makes a Defense and Military Dashboard in Excel So Effective?
Several factors make this dashboard highly effective:
- First, it provides centralized visibility across departments.
- Second, it transforms raw numbers into visual insights.
- Third, it allows quick comparisons across regions, operation types, and months.
- Finally, it supports data-driven decisions without complex tools.
Because Excel supports slicers, pivot charts, and formulas, users can analyze large datasets easily and confidently.
What Sheets Are Available in the Defense and Military Dashboard in Excel?
This ready-to-use dashboard includes multiple structured sheet tabs, each designed to answer specific operational questions.
Let us explore each sheet in detail.
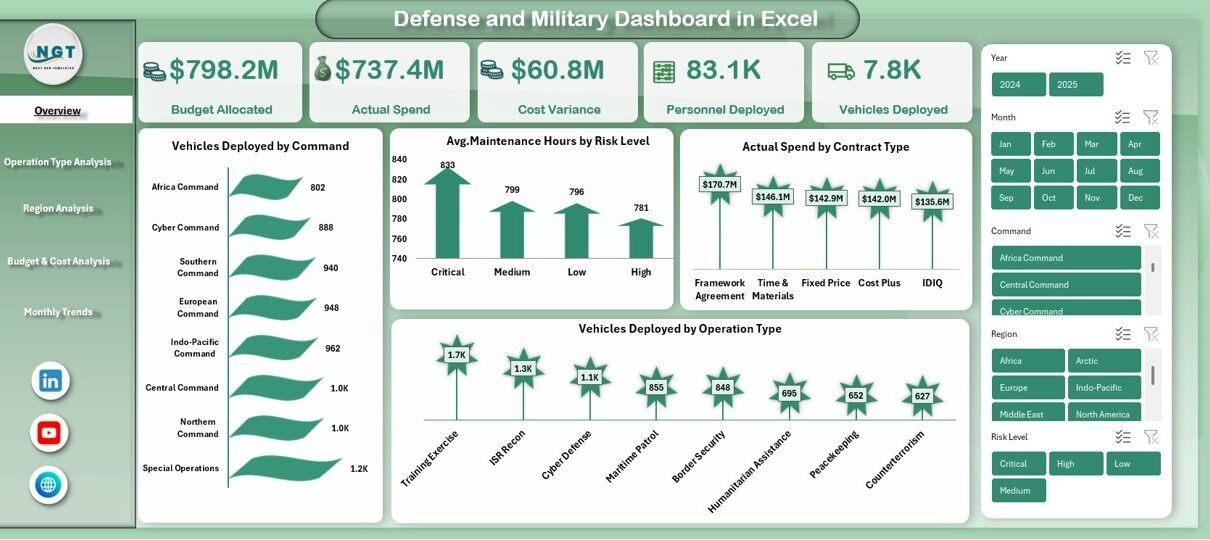
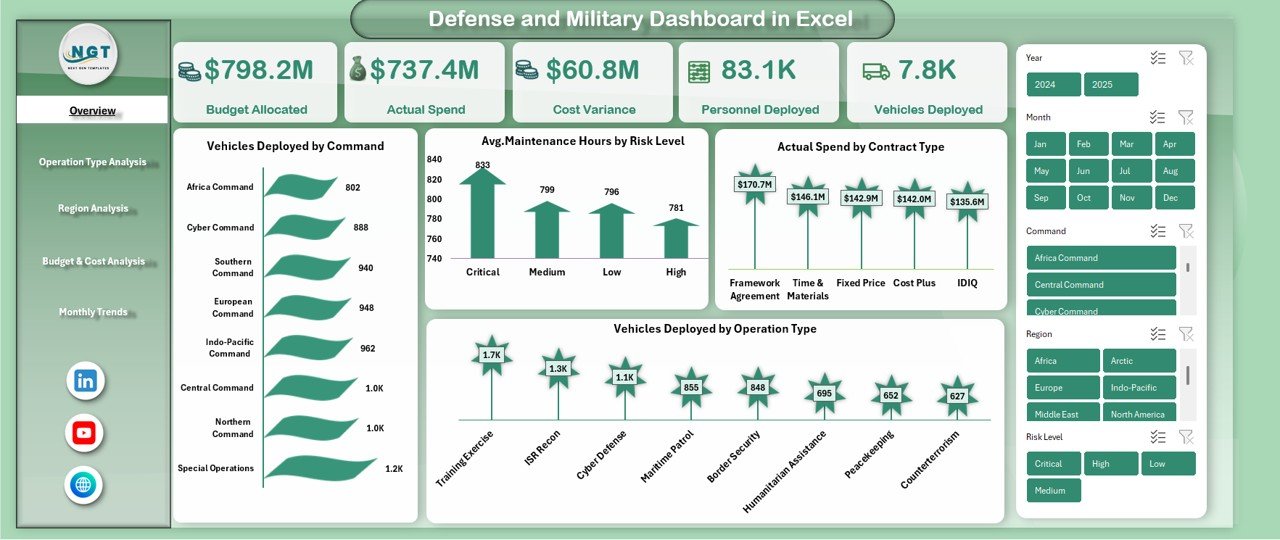
Overview Sheet
The Overview Sheet acts as the command center of the dashboard. It provides a high-level snapshot of overall performance and deployment status.
Key Metrics Available on the Overview Sheet
- Budget Allocated – Displays total approved defense budget
- Actual Spend – Shows how much budget has been utilized
- Cost Variance – Highlights over-spending or savings
- Personnel Deployed – Tracks total deployed personnel
- Vehicles Deployed – Displays total deployed vehicles
Key Charts on the Overview Sheet
- Vehicles Deployed by Command – Helps compare deployment levels across commands
- Average Maintenance Hours by Risk Level – Identifies high-risk assets
- Actual Spend by Contract Type – Tracks spending behavior
- Vehicles Deployed by Operation Type – Analyzes mission distribution
Because all major KPIs appear on one page, leadership teams can assess the overall situation within seconds.
Click to buy Defense and Military Dashboard in Excel
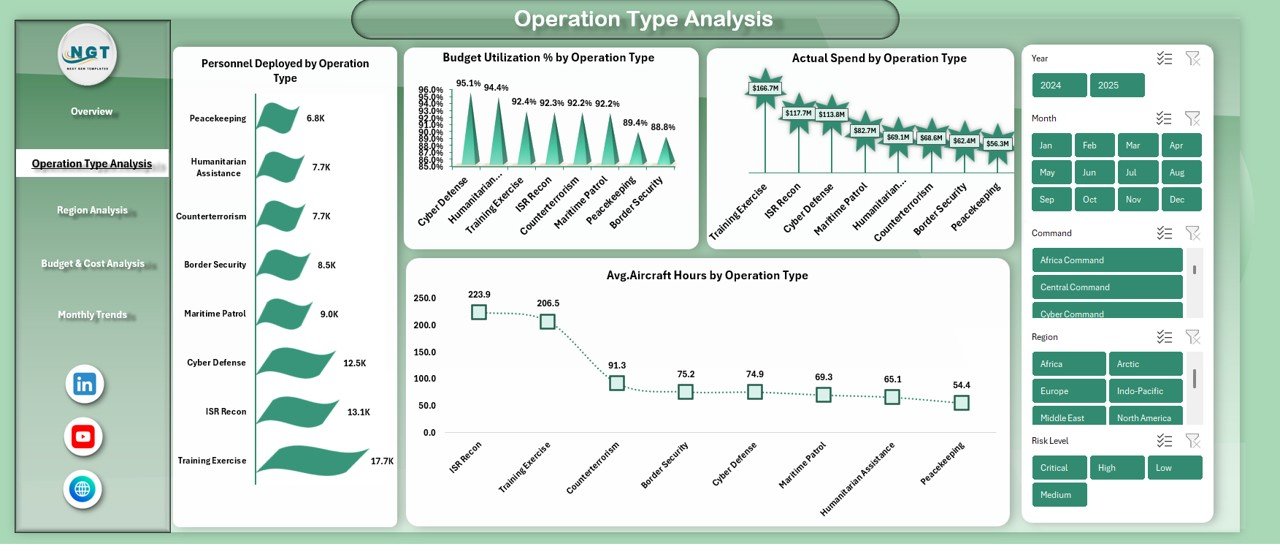
Operation Type Analysis
The Operation Type Analysis Sheet focuses on mission-level insights. It helps decision-makers understand how different operation types consume resources.
Key Analysis Available
- Personnel Deployed by Operation Type
- Budget Utilization Percentage by Operation Type
- Actual Spend by Operation Type
- Average Aircraft Hours by Operation Type
Because different missions require different levels of resources, this sheet helps commanders allocate assets more effectively and avoid unnecessary strain.
Click to buy Defense and Military Dashboard in Excel
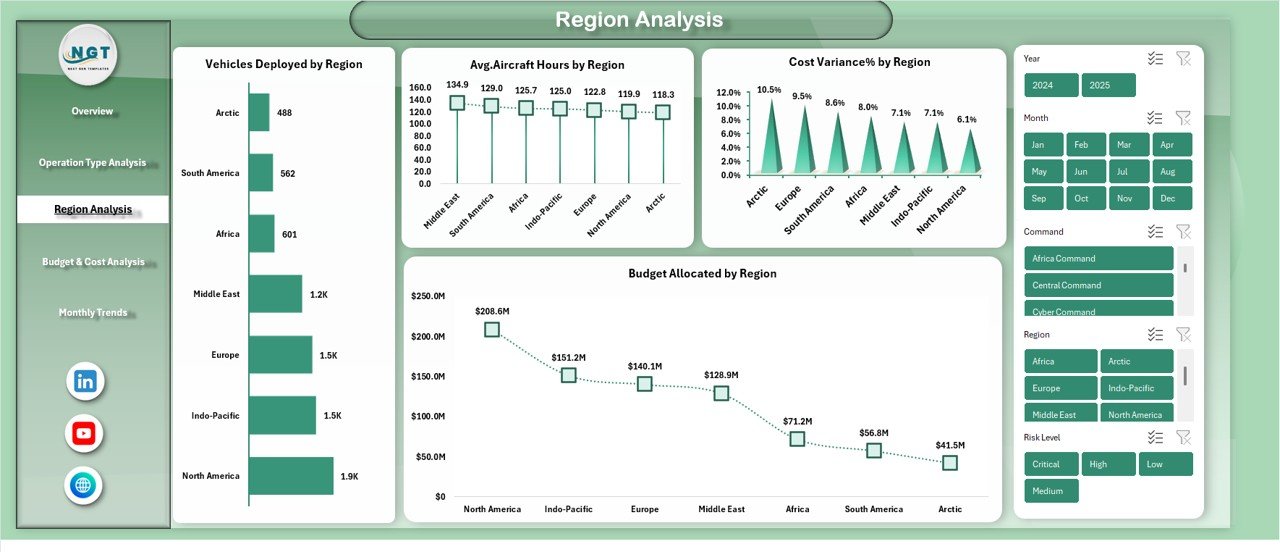
Region Analysis
Military operations span multiple regions, each with unique challenges. Therefore, the Region Analysis Sheet becomes essential for regional commanders and planners.
Key Insights Available on Region Analysis Sheet
- Vehicles Deployed by Region
- Average Aircraft Hours by Region
- Cost Variance Percentage by Region
- Budget Allocated by Region
With these insights, leadership can identify:
- Regions with high operational intensity
- Areas with budget overruns
- Regions requiring additional support or optimization
Click to buy Defense and Military Dashboard in Excel
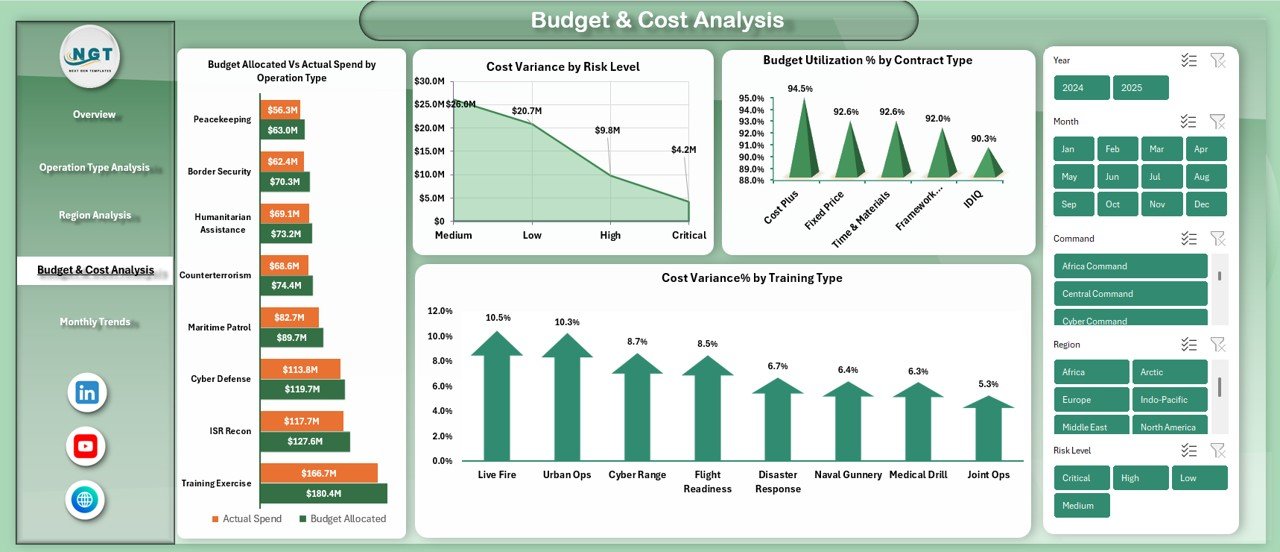
Budget & Cost Analysis
Defense budgets involve massive investments. Therefore, tight financial control becomes non-negotiable.
The Budget & Cost Analysis Sheet provides detailed financial comparisons.
Key Financial Charts
- Budget Allocated vs Actual Spend by Operation Type
- Cost Variance by Risk Level
- Budget Utilization Percentage by Contract Type
- Cost Variance Percentage by Training Type
These insights help finance teams and commanders detect inefficiencies early and take corrective action before problems escalate.
Click to buy Defense and Military Dashboard in Excel
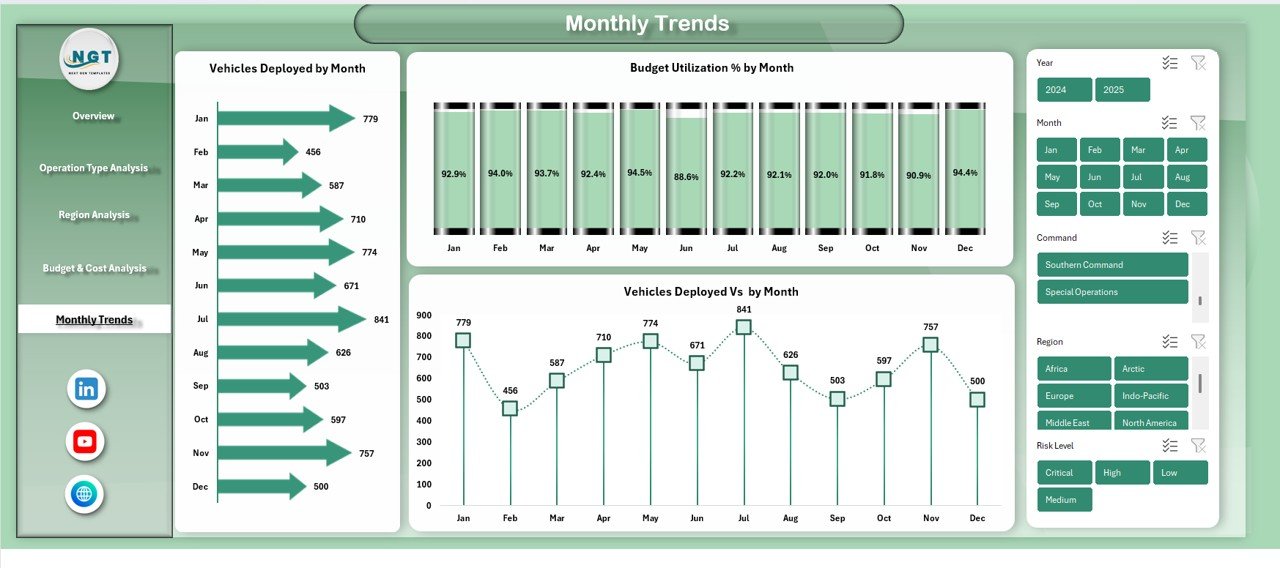
Monthly Trends
Operational intensity changes over time. Therefore, understanding trends becomes crucial.
The Monthly Trends Sheet tracks performance over months.
Key Monthly Trend Metrics
- Vehicles Deployed by Month
- Budget Utilization Percentage by Month
- Vehicles Deployed vs Budget by Month
Because trends reveal patterns, this sheet supports forecasting, planning, and readiness assessments.
Click to buy Defense and Military Dashboard in Excel
Advantages of Defense and Military Dashboard in Excel
A Defense and Military Dashboard in Excel offers multiple strategic and operational advantages.
- Centralized Decision-Making
The dashboard brings all key metrics into one place. As a result, leaders no longer search through multiple reports.
- Improved Budget Control
By tracking allocated budget versus actual spend, organizations reduce waste and overspending.
- Enhanced Operational Visibility
Commanders gain clear insights into personnel, vehicles, and mission readiness.
- Faster Strategic Decisions
Visual dashboards reduce analysis time and improve response speed.
- Easy Customization
Because Excel allows flexibility, teams can add KPIs, regions, or operation types easily.
- No Advanced Software Required
The dashboard works entirely in Excel, making it accessible across all levels.
Who Can Benefit from a Defense and Military Dashboard in Excel?
This dashboard supports multiple roles, including:
- Defense leadership and senior commanders
- Operations and mission planning teams
- Finance and budget control departments
- Logistics and fleet management teams
- Maintenance and risk assessment units
Because it aligns operational and financial data, it benefits both strategic and tactical users.
Best Practices for the Defense and Military Dashboard in Excel
To get maximum value, organizations should follow proven best practices.
- Maintain Accurate Source Data
Always ensure data accuracy before loading it into the dashboard.
- Update the Dashboard Regularly
Frequent updates keep insights relevant and reliable.
- Use Standard KPI Definitions
Consistent KPI definitions improve clarity across teams.
- Apply Data Validation Rules
Validation prevents incorrect entries and reporting errors.
- Review Trends Monthly
Monthly trend analysis helps anticipate future challenges.
- Limit Dashboard Overload
Focus on critical KPIs instead of overwhelming users.
How Does This Dashboard Support Strategic Defense Planning?
This dashboard aligns budget planning, resource deployment, and operational analysis into one framework.
As a result, leadership can:
- Identify under-utilized resources
- Improve mission allocation
- Enhance financial accountability
- Strengthen long-term planning
Because Excel supports historical analysis, teams can also compare past operations and refine future strategies.
Conclusion: Why Defense and Military Dashboard in Excel Is a Strategic Asset
A Defense and Military Dashboard in Excel transforms complex defense data into actionable intelligence. Instead of relying on fragmented reports, organizations gain a single source of truth.
This dashboard improves:
- Operational visibility
- Budget control
- Mission readiness
- Strategic decision-making
Because it remains flexible, easy to use, and cost-effective, this dashboard serves as a powerful analytics tool for modern defense organizations.
Frequently Asked Questions (FAQs)
What is a Defense and Military Dashboard in Excel used for?
A Defense and Military Dashboard in Excel tracks budgets, personnel, vehicles, operations, and regional performance in one centralized report.
Can this dashboard handle large datasets?
Yes, Excel dashboards can handle large datasets efficiently when designed with pivot tables and structured data models.
Do users need advanced Excel skills to use this dashboard?
No, the dashboard remains user-friendly and requires only basic Excel knowledge for interaction.
Can organizations customize the dashboard?
Yes, teams can easily add KPIs, regions, operation types, or charts based on requirements.
How often should the dashboard be updated?
Organizations should update the dashboard weekly or monthly depending on operational needs.
Is Excel secure enough for defense reporting?
When organizations apply proper access controls and security policies, Excel dashboards remain secure and effective.
Watch the step-by-step video tutorial:
Visit our YouTube channel to learn step-by-step video tutorials
Click to buy Defense and Military Dashboard in Excel