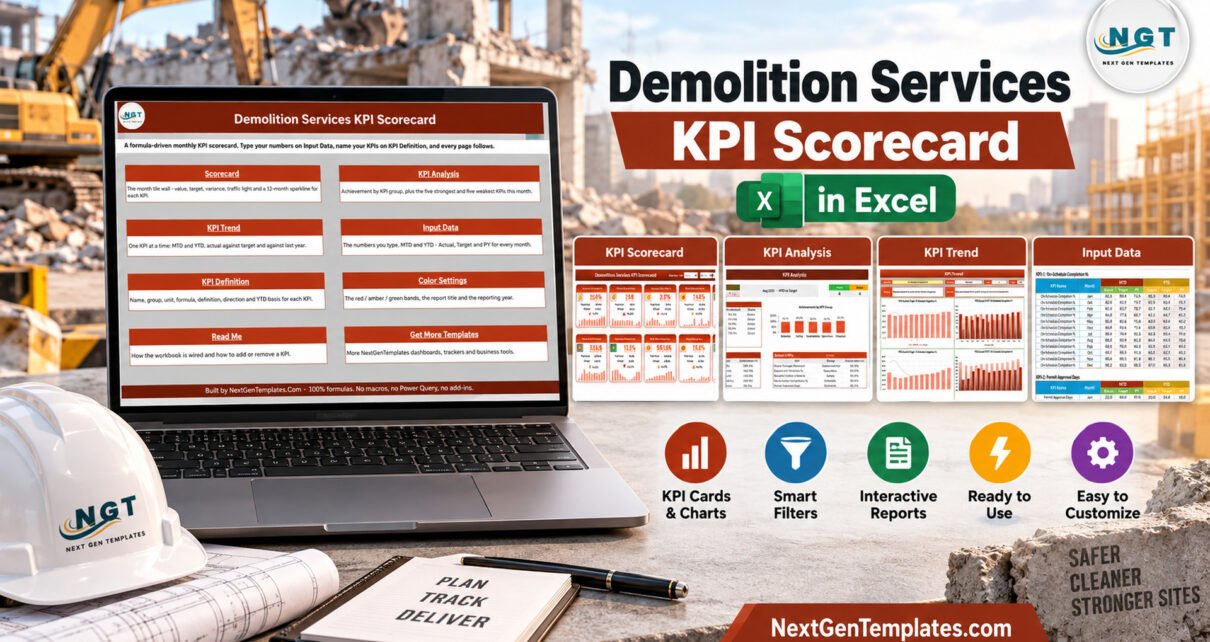
The Demolition Services KPI Scorecard in Excel puts 10 demolition KPIs on a single tile-wall page, grouped into Schedule, Safety, Sustainability, Operations and Financial. It comes with 9 visible sheets, room for 20 KPIs, four header controls and a full 2025 sample year. In the August 2025 sample, 4 KPIs read green, 4 amber and 2 red, and every number on every page comes from formulas, with no macros at all.
Demolition contractors collect plenty of numbers: permit turnaround, incident rates, tonnes hauled, machine hours, margins. They are usually scattered across job files, and the monthly management meeting ends up reading from five different spreadsheets. This scorecard gives those numbers one home, compares each against a target and last year, and colours it by whether a higher or lower value is good.
Scorecard or dashboard? This article covers the KPI Scorecard edition. We also make a separate Demolition Services KPI Dashboard in Excel, part of our KPI Dashboard family, which tracks 14 KPIs in a row-by-row table across 10 pages. The two share a topic but not a layout, so pick the one that matches how many KPIs your team reviews.
Key Features of the Demolition Services KPI Scorecard in Excel
- Ten KPIs, pre-built for demolition work. On-Schedule Completion %, Permit Approval Days, Incident Rate (TRIR), Rework / Callback Rate %, Debris Diversion Rate %, Waste Tonnage Removed, Equipment Utilisation %, Dust & Noise Compliance %, Revenue per Project and Project Margin %.
- Direction-aware status. Seven KPIs are Upper-the-Better and three are Lower-the-Better: Permit Approval Days, Incident Rate (TRIR) and Rework / Callback Rate %. The traffic light and the change arrow both respect that direction.
- Four header controls. Select Month (Jan-2025 to Dec-2025), MTD or YTD, a Vs. picker for Target, PY or Prior Month, and a KPI set picker for slots 1-10 or 11-20.
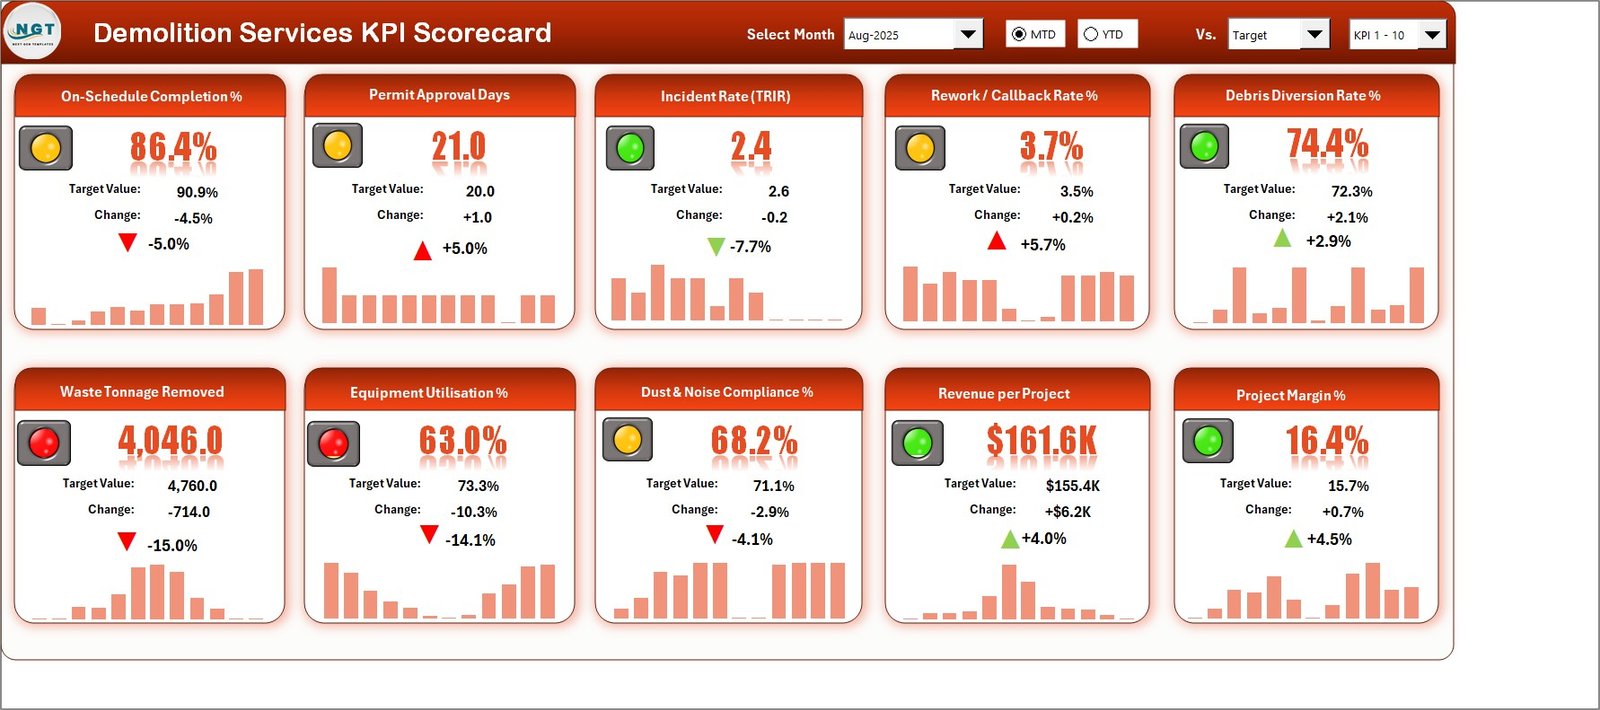
- A complete tile. Each card shows the value, the comparison value, the absolute change, the percentage change with an arrow, a traffic light and a 12-month sparkline.
- Editable thresholds. Green means at or above target, amber within 10% and red beyond 10% by default. The bands are ordinary cells on Color Settings, and the status formulas read them directly.
- Room to grow. Twenty numbered slots on both KPI Definition and Input Data, with a Check column that warns about duplicate KPI names.
Scorecard Sheets Explanation
Home
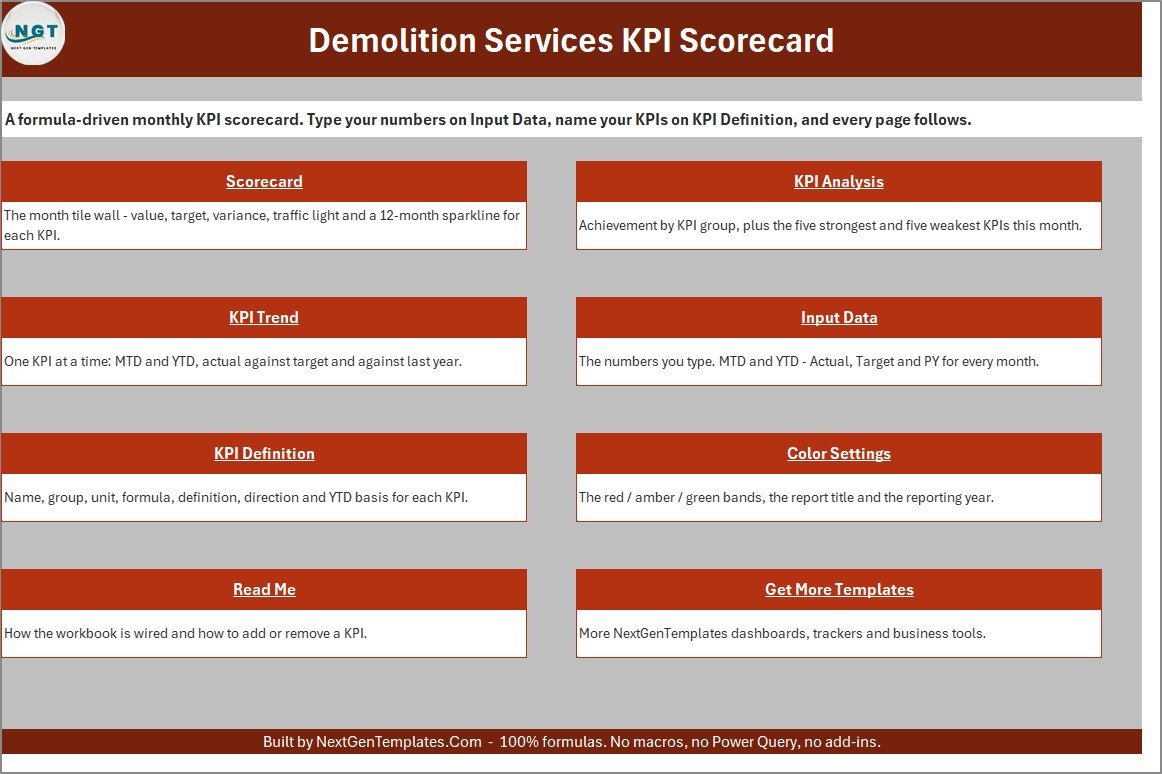
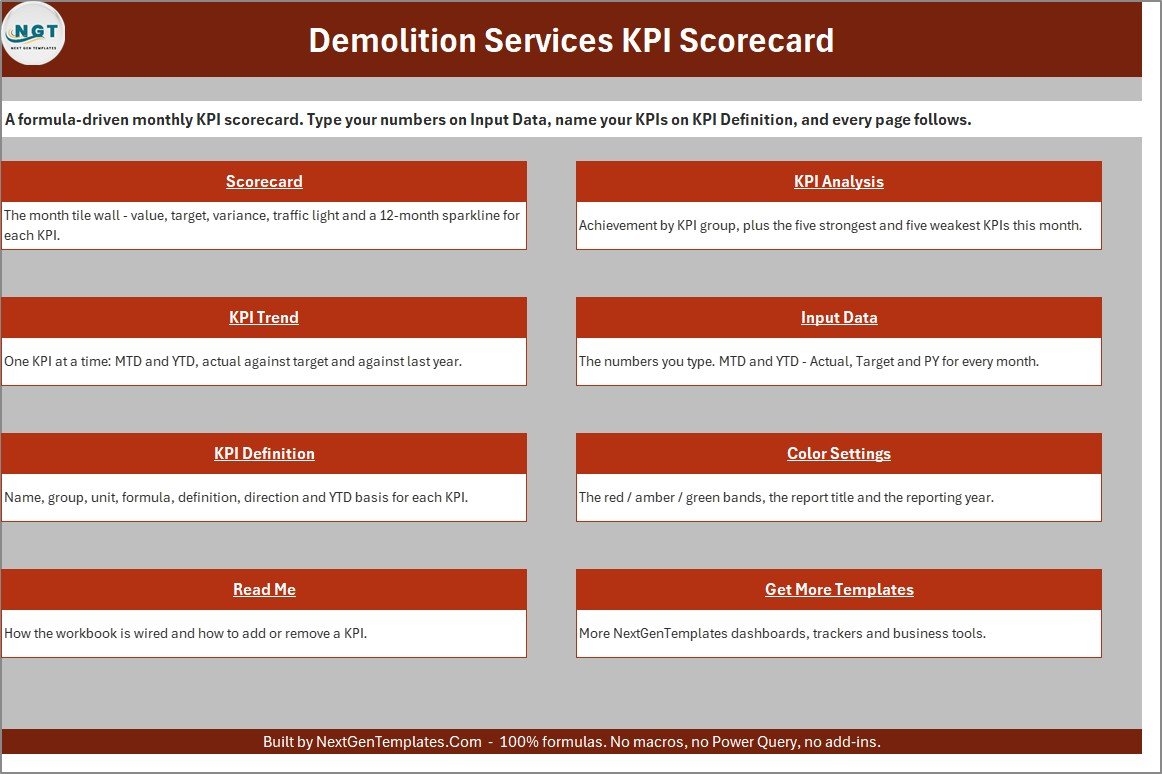
A navigation page with eight buttons, each with a one-line description of the sheet behind it, plus a footer confirming the file is 100% formulas.
Scorecard
Ten tiles in two rows. For August 2025 the sample shows Incident Rate (TRIR) at 2.4 against a 2.6 target (green, because lower is better), Permit Approval Days at 21 against 20 (amber), Equipment Utilisation % at 63.0% against 73.3% (red) and Project Margin % at 16.4% against 15.7% (green).
KPI Analysis
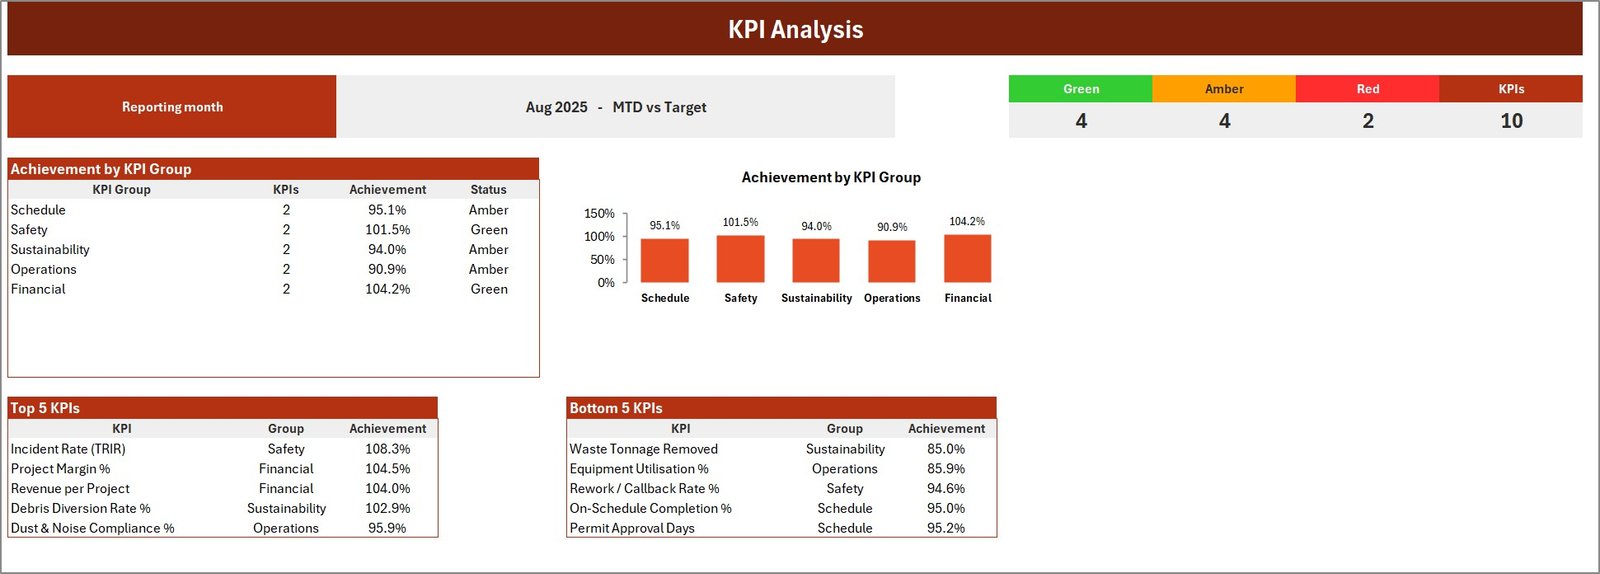
The month in one view: RAG counts (4 green, 4 amber, 2 red of 10), Achievement by KPI Group as a table and chart, and the Top 5 and Bottom 5 KPIs. Financial leads the groups at 104.2% and Operations trails at 90.9%.
KPI Trend
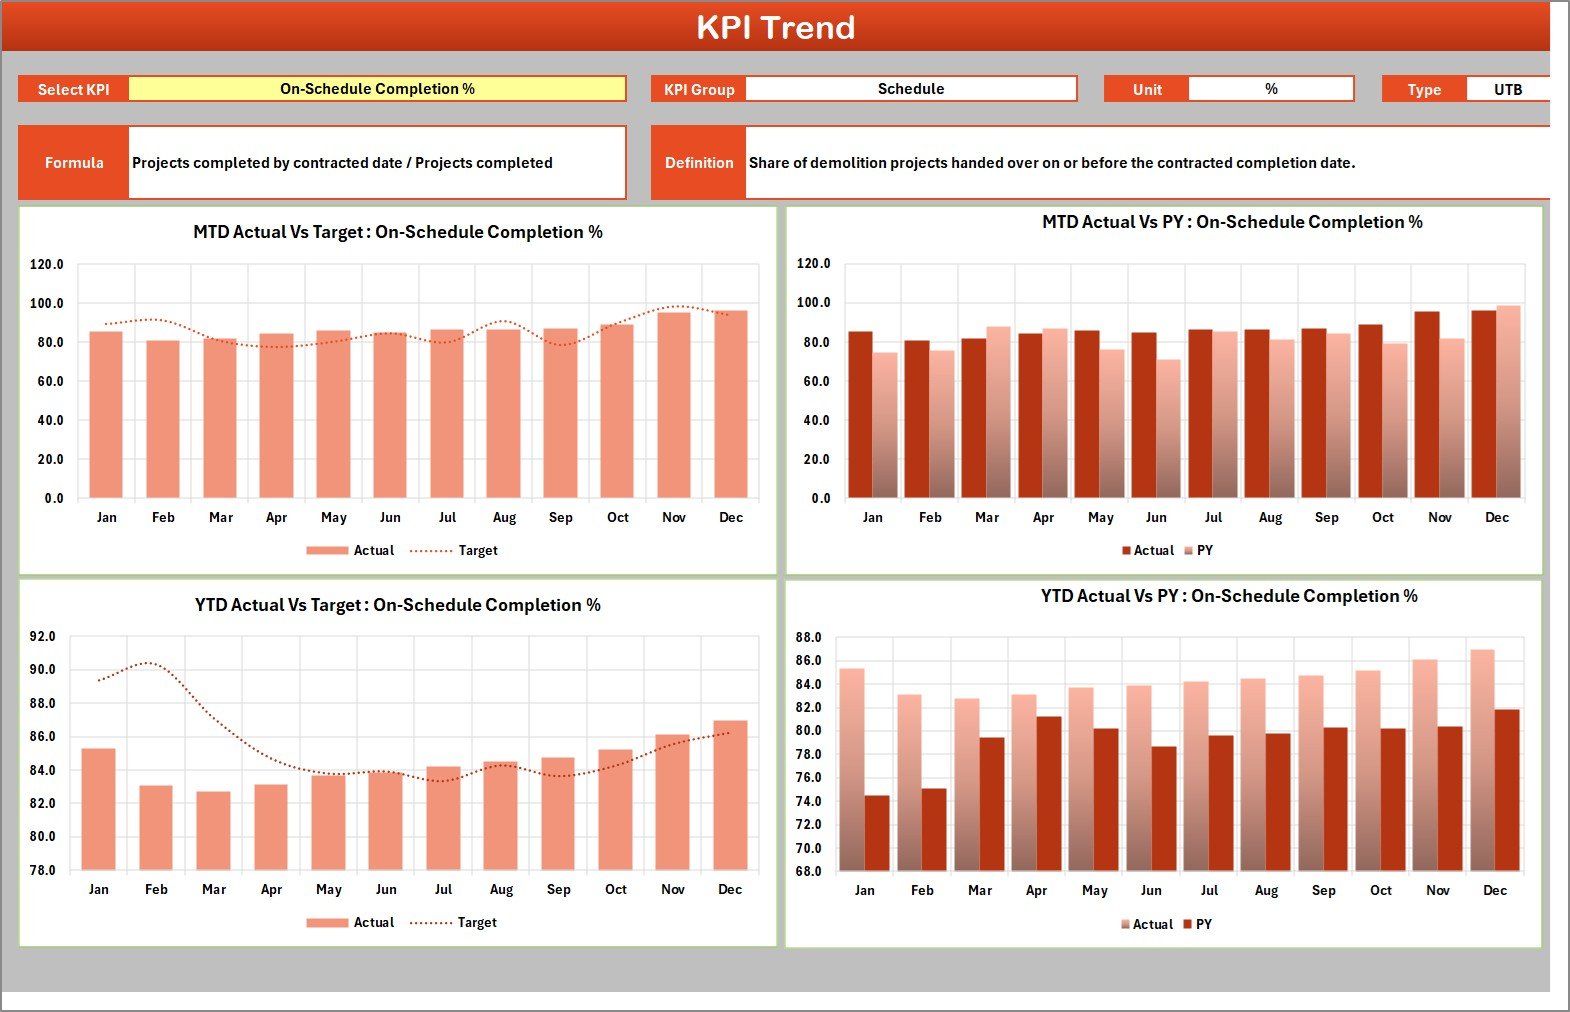
Select a single KPI to see its group, unit, type, formula and definition above four charts: MTD Actual vs Target by Month, MTD Actual vs PY by Month, YTD Actual vs Target by Month and YTD Actual vs PY by Month.
Input Data
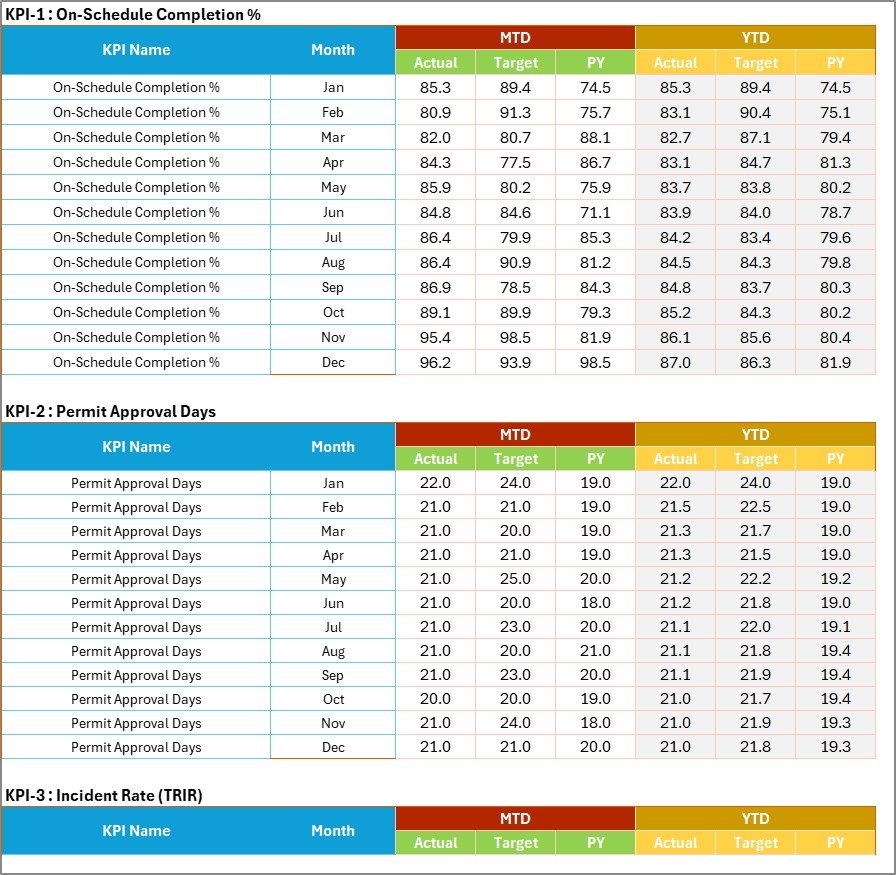
Twenty KPI blocks with 12 monthly rows each. You enter MTD Actual, Target and PY, and the YTD Actual, Target and PY values. The block titles pick up the KPI names from KPI Definition automatically.
KPI Definition
The master list: group, KPI name, unit, formula, definition, type (UTB or LTB), YTD basis and Check. Nine of the ten sample KPIs roll up YTD as an average; Waste Tonnage Removed rolls up as a sum.

Color Settings
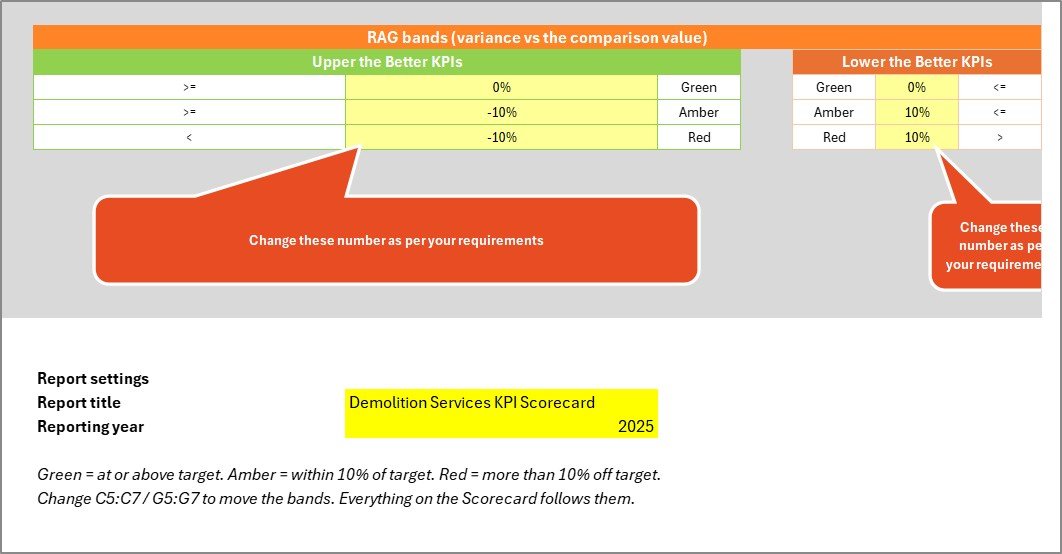
Separate bands for Upper-the-Better and Lower-the-Better KPIs, the report title and the reporting year. The year labels the month picker, so it reads Aug-2025 rather than Aug.
Read Me
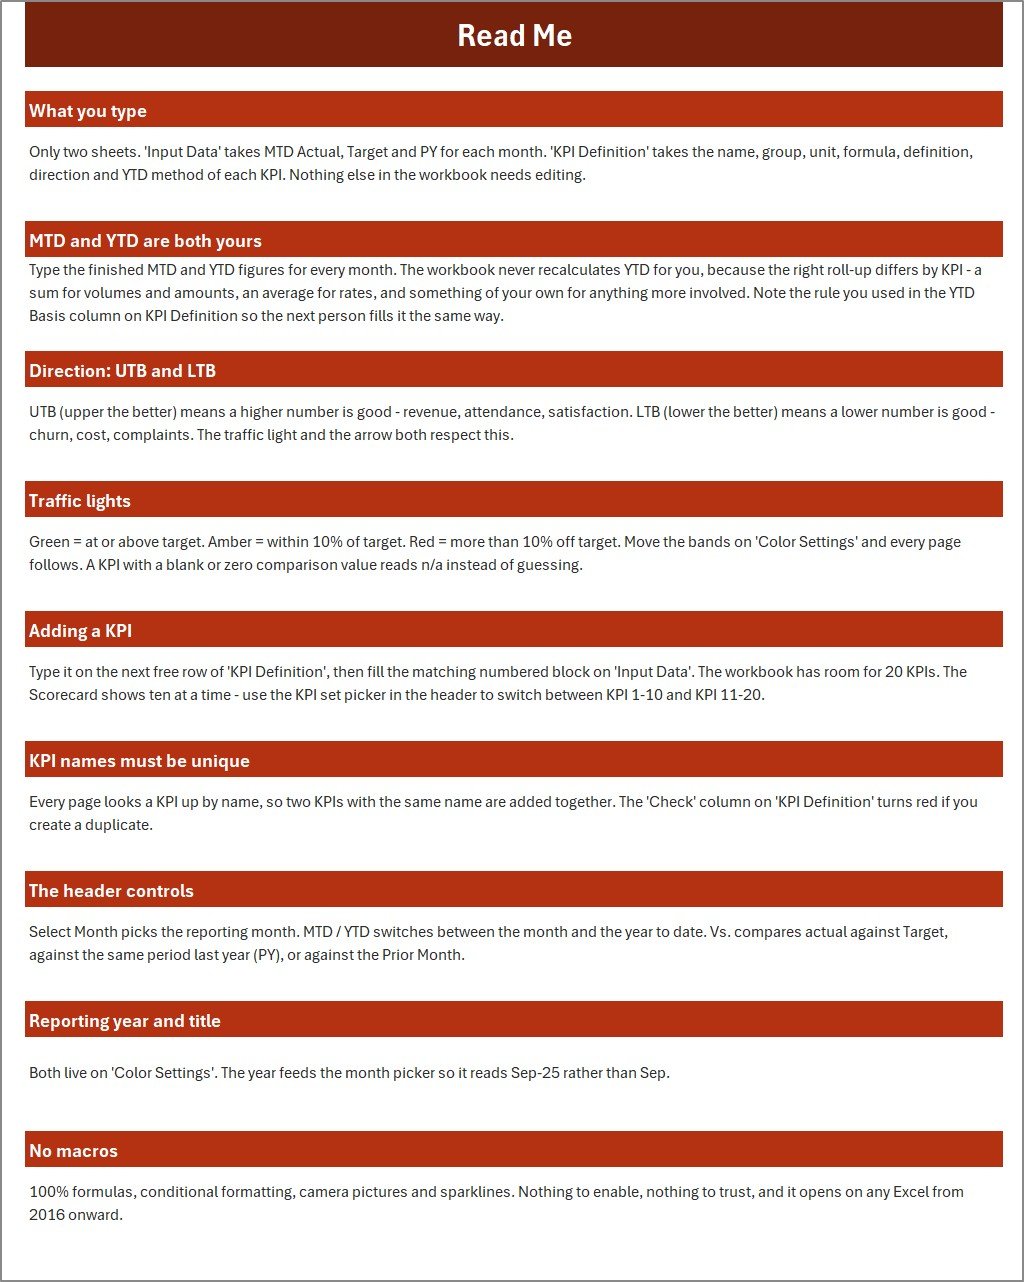
A plain-language guide to the wiring: what to type, how MTD and YTD work, what UTB and LTB mean, how to add a KPI and what each header control does.
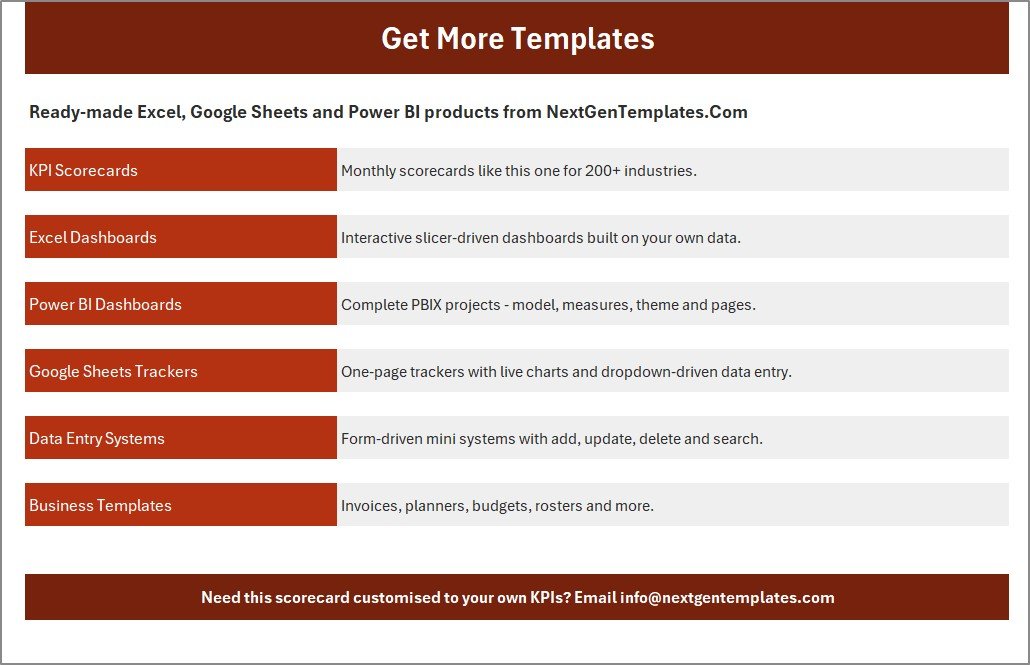
Get More Templates
Links to other NextGenTemplates families and a contact line for customisation.
Excel Scorecard vs. Google Sheets vs. Construction Software — Feature Comparison
| Feature | This Excel demolition scorecard | Build-your-own Google Sheets KPI sheet | Construction management SaaS (Procore / Buildertrend) |
|---|---|---|---|
| Cost | ✅ $9.99 one-time | Free app, your time to build | Recurring subscription, usually quoted per company |
| Platform | Desktop Excel 2016 or later | Browser | Web and mobile apps |
| Setup time | ✅ Minutes with the sample layout | Days to build | An onboarding project |
| Real-time team collaboration | Share the file; not built for co-editing | ✅ Live co-editing | ✅ Multi-user roles |
| Mobile access | View only; dropdowns need desktop Excel | ✅ Yes | ✅ Native apps |
| Customizable KPIs | ✅ 20 slots with your own names, units and bands | ✅ Whatever you build | Within the vendor’s reports |
| Traffic lights and sparklines ready | ✅ On all 10 tiles | ❌ Build yourself | Varies by module |
| Year-1 cost at 5 users | ✅ $9.99 once | Staff time | Subscription fees every year |
| Job-level field records | ❌ Monthly totals only | ❌ Unless you build it | ✅ Daily logs and documents |
For demolition firms that want a clear monthly KPI review without paying for a full project platform, the Demolition Services KPI Scorecard in Excel sits in the sweet spot.
Who Should Use This Template
Perfect for:
- Owners and operations managers at small and mid-sized demolition contractors
- Finance leads who report revenue and margin against target and prior year
- Project controls staff preparing monthly director or client packs
- Sustainability coordinators logging monthly debris diversion and tonnage totals
Not a fit if:
- You need per-job daily logs, timesheets or a permit register by site
- You want software that checks asbestos surveys, structural assessments, permits or HSE / OSHA compliance – this workbook only reports figures you enter
- Your team works only in Excel for the web or must co-edit in real time
Real-World Use Cases
An operations director at a 40-person demolition contractor opens the Scorecard for August and sees Equipment Utilisation % in red at 63.0% against 73.3%. Before approving another excavator hire, the team uses KPI Trend to check whether utilisation has been falling for months or dipped only once.
A finance manager at a regional demolition firm switches the Vs. control to PY. Revenue per Project ($161.6K) and Project Margin % (16.4%) both sit ahead of last year, and the YTD view gives the directors the year-to-date picture in the same layout.
A sustainability coordinator types monthly Debris Diversion Rate % and Waste Tonnage Removed from the firm’s own weighbridge and recycling records. The scorecard does not calculate diversion from tickets; it presents the monthly totals against target. For background on recovering demolition materials, the US EPA page on construction and demolition materials is a useful starting point.
Advantages of the Demolition Services KPI Scorecard in Excel
- One-time cost. $9.99 on sale replaces a per-user reporting subscription for the monthly review.
- No macros to trust. Formulas, conditional formatting, linked pictures and sparklines only, so there is nothing to enable.
- Fair colours. Lower-the-Better KPIs are scored the right way round, which matters for incident rates and permit delays.
- Consistent monthly pack. The same three views every month: tiles, group analysis and a single-KPI trend.
- Easy to hand over. The Read Me and KPI Definition sheets document every KPI, so a new admin can keep it updated.
Opportunities for Improvement
- YTD values are typed, not calculated. The workbook deliberately leaves the roll-up to you, which is flexible but adds typing and room for error.
- One reporting year per file. The month picker covers twelve months of the year set on Color Settings; keep a copy per year for history.
- Monthly totals only. There is no project, site or crew breakdown, so the scorecard cannot drill into which job pulled a KPI down.
- Global thresholds. The amber and red bands apply to every KPI of the same direction, not per KPI.
- Desktop-first. The dropdowns are form controls, which are not interactive in Excel for the web.
- Generic manual. The PDF in the download covers the Excel KPI Scorecard layout in general rather than demolition specifically; the in-file Read Me fills that gap.
Best Practices
- Agree each KPI’s formula and data source before the first month, and write it on KPI Definition.
- Set targets for all twelve months at the start of the year so amber and red mean the same thing every month.
- Choose the YTD roll-up per KPI (sum for tonnage and revenue totals, average for rates) and apply it consistently.
- Keep Incident Rate (TRIR) on the same hours base every month so the trend is comparable.
- Review Bottom 5 first in meetings, then use KPI Trend to separate one-off dips from real declines.
- Learn the basics of the formulas behind the tiles with Microsoft’s overview of formulas in Excel.
Explore Relevant Templates
More scorecards in the same layout, written up on this blog:
- Glass Installation KPI Scorecard in Excel
- Solar Panel Installation KPI Scorecard in Excel
- Window and Door Installation KPI Scorecard in Excel
- Elevator Maintenance KPI Scorecard in Excel
- Fire Safety Services KPI Scorecard in Excel
Construction templates on NextGenTemplates:
- Concrete Contractor KPI Scorecard in Excel
- Paving Contractor KPI Scorecard in Excel
- Drywall Contractor KPI Scorecard in Excel
- Scaffolding Services KPI Scorecard in Google Sheets
- 💎 Construction Project Intelligence Kit – six construction templates across Excel, Power BI and Google Sheets
Frequently Asked Questions
What does the Demolition Services KPI Scorecard in Excel include?
The download holds one .xlsx workbook and a PDF user manual. The workbook has 9 visible sheets (Home, Scorecard, KPI Analysis, KPI Trend, Input Data, KPI Definition, Color Settings, Read Me and Get More Templates), 10 demolition KPIs, room for 20, and a full 2025 sample year.
Which KPIs are Lower-the-Better?
Three of the ten: Permit Approval Days, Incident Rate (TRIR) and Rework / Callback Rate %. For these, a value below target turns green. The other seven, including Debris Diversion Rate % and Project Margin %, are Upper-the-Better. You can change any KPI’s direction on KPI Definition.
How long does setup take?
If the sample KPIs suit your firm, set the year and title on Color Settings and type twelve months of MTD and YTD values on Input Data, typically under an hour. Renaming or replacing KPIs on KPI Definition takes a few minutes more.
Does it need macros or a particular Excel version?
No macros are used. The file relies on formulas, conditional formatting, form controls, linked pictures and sparklines, and runs in desktop Excel 2016 or later. Excel for the web shows the sheets but does not operate the dropdown controls.
Does the template verify safety, asbestos or permit compliance?
No. It is a reporting tool that displays the numbers you type, including Incident Rate (TRIR) and Dust & Noise Compliance %. It does not survey, certify, apply for permits or confirm HSE, OSHA or environmental compliance, which stay with your firm and its qualified advisers.
How does this compare to Procore or Buildertrend?
Procore and Buildertrend run projects day to day with documents, logs and team apps on a subscription. This scorecard handles the monthly management summary for a one-time price. Many contractors keep site records in software and use a spreadsheet scorecard for the director-level review.
About the Author
Built by PK — Microsoft Certified Professional with 15+ years of Excel, Google Sheets, and Power BI experience. Founder of NextGenTemplates, reaching 300K+ subscribers across YouTube channels. Every template is hand-built and tested before release.
Conclusion
A demolition business lives or dies on schedule, safety, plant utilisation and margin. This scorecard puts those ten numbers on one page each month, scores them the right way round and shows how the year is building. It will not replace your site systems or your compliance process, but it gives the management meeting a single, consistent view.
👉 Click here to Purchase the Demolition Services KPI Scorecard in Excel
✅ Instant download · One-time payment · No subscription
🎥 Watch more tutorials at Youtube.com/@PKAnExcelExpert
Last updated: September 2026