Managing a dental clinic requires constant monitoring of patient satisfaction, treatment costs, insurance coverage, discounts, and performance across branches and specialties. However, most dental teams still track all this information in multiple spreadsheets, manual reports, and scattered files. This creates confusion, delays decisions, and hides valuable insights that can improve operations.
A Dental Services Dashboard in Power BI solves these problems instantly. It turns raw dental service data into clear visuals that show trends, performance gaps, financial growth, and patient experience—all in one place. You can track month-wise performance, compare specialty costs, measure profits, and analyze treatment patterns within seconds.
In this detailed article, you will learn what a Dental Services Dashboard in Power BI is, why it matters, how each page works, and how you can use it to improve decision-making across your dental clinic or dental service network.
Click to Purchases Dental Services Dashboard in Power BI
What Is a Dental Services Dashboard in Power BI?
A Dental Services Dashboard in Power BI is a ready-to-use analytical reporting system that dental clinics, dental groups, and multi-branch dental care providers use to visualize their operational and financial performance. It captures data from Excel or any other source and converts it into interactive visuals.
The dashboard helps you:
-
Monitor treatments, specialties, and tooth types
-
Track patient satisfaction and insurance coverage
-
Analyze discounts, billing, region-wise profit, and specialty-wise costs
-
Understand monthly trends for better planning
Since the dashboard works on Power BI, you can refresh it anytime with updated data without rebuilding reports.
Why Do Dental Clinics Need a Power BI Dashboard?
Dental care operations involve many moving parts. Clinics manage appointments, treatments, discounts, insurance approvals, patient satisfaction, and branch-wise performance. When teams track these metrics manually, they lose clarity.
A Power BI dashboard helps because it:
-
Shows information in real time
-
Helps managers spot problems early
-
Brings all KPIs into one view
-
Supports monthly, quarterly, and yearly analysis
-
Makes decision-making faster and more accurate
With this dashboard, dental managers no longer rely on assumptions. They can see the exact numbers behind performance.
Key Features of the Dental Services Dashboard in Power BIAirlines KPI Dashboard in Power BI
Your Dental Services Dashboard includes five interactive pages:
-
Overview Page
-
Tooth Type Analysis
-
Treatment Analysis
-
Specialty Analysis
-
Monthly Trends
Let’s explore each page in detail.
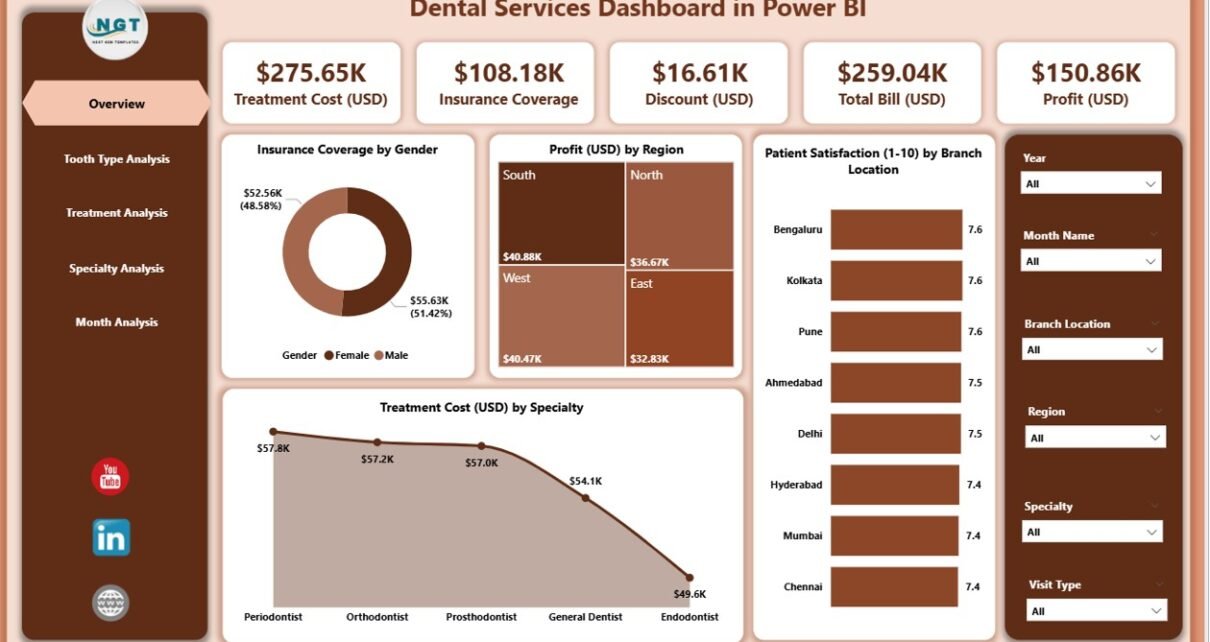
1. Overview Page – What Does It Show?
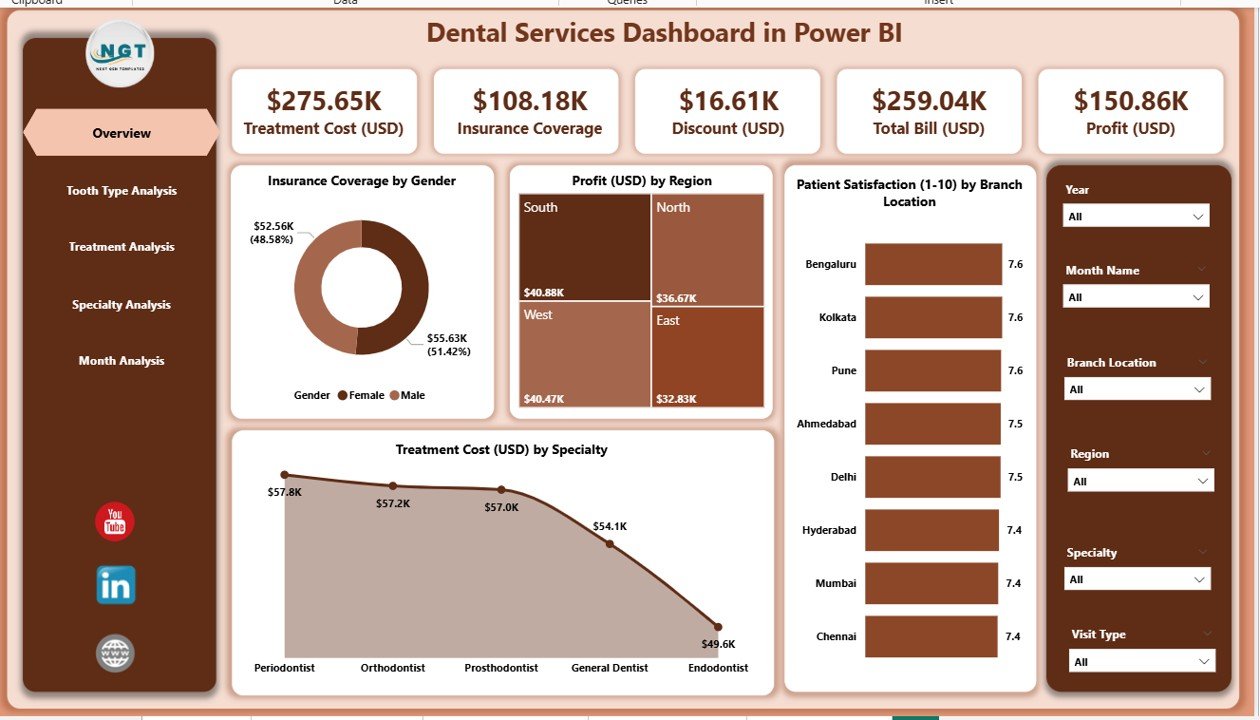
The Overview Page acts as the main summary section of the dashboard. It brings high-level insights into one place so you can understand current performance at a glance.
Key Insights on This Page
✔ Four KPI Cards
These cards show:
-
Total Insurance Coverage
-
Total Profit (USD)
-
Patient Satisfaction Score
-
Total Treatment Cost
These KPIs help managers understand overall performance instantly.
✔ Four Interactive Charts
The Overview Page includes the following charts:
-
Insurance Coverage by Gender – See how male and female patients use insurance.
-
Profit (USD) by Region – Compare regional profitability.
-
Patient Satisfaction by Branch Location – Identify branches performing well or falling behind.
-
Treatment Cost (USD) by Specialty – Understand which specialties cost more.
The slicers on the top allow you to filter data by month, region, or specialty for deeper insight.
2. Tooth Type Analysis – What Can You Learn From It?
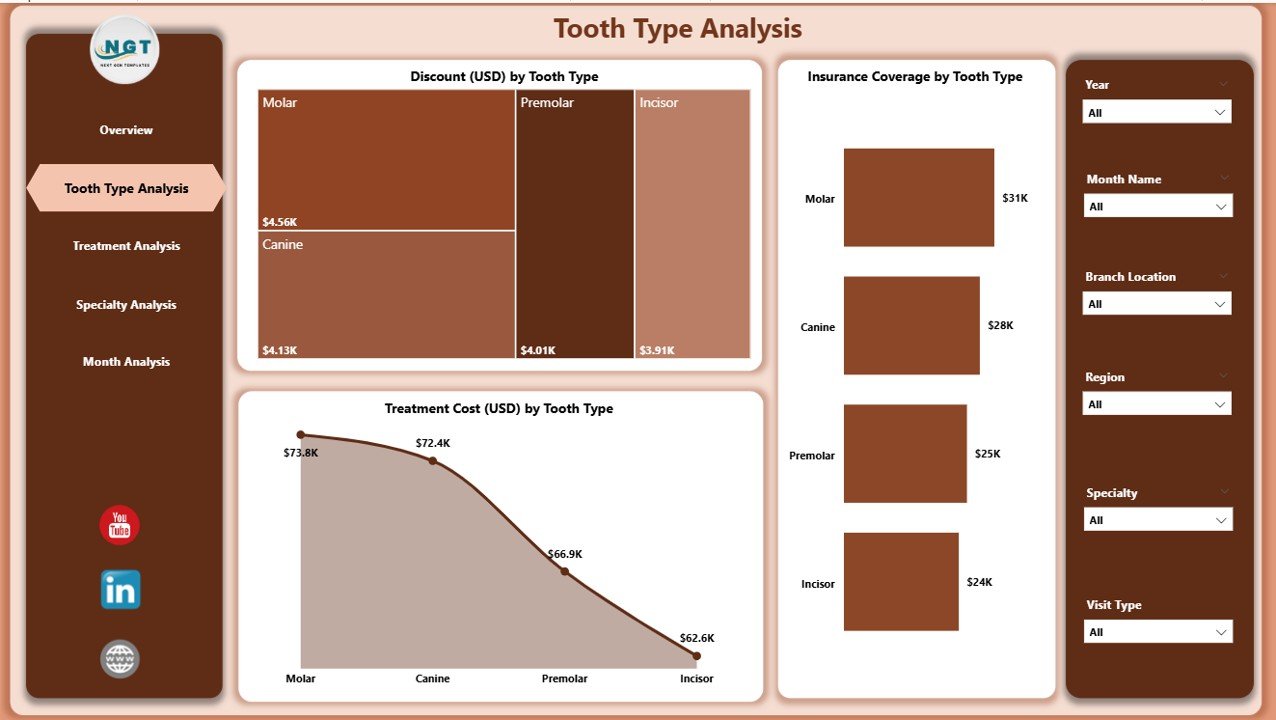
Tooth type plays an important role in planning treatments, estimating costs, and approving insurance claims. This dashboard page shows how each tooth type affects revenue, insurance coverage, and discount trends.
Main Charts on This Page
✔ Discount (USD) by Tooth Type
This helps you see which tooth types receive higher discounts and why.
✔ Insurance Coverage by Tooth Type
Understand which tooth categories are most commonly covered by insurance.
✔ Treatment Cost (USD) by Tooth Type
This chart helps clinics identify high-cost treatment areas.
Why This Page Matters
It helps dental clinics:
-
Understand patient needs
-
Plan better pricing strategies
-
Negotiate insurance claims
-
Identify cost-intensive tooth types
3. Treatment Analysis – How Does Treatment Type Affect Performance?
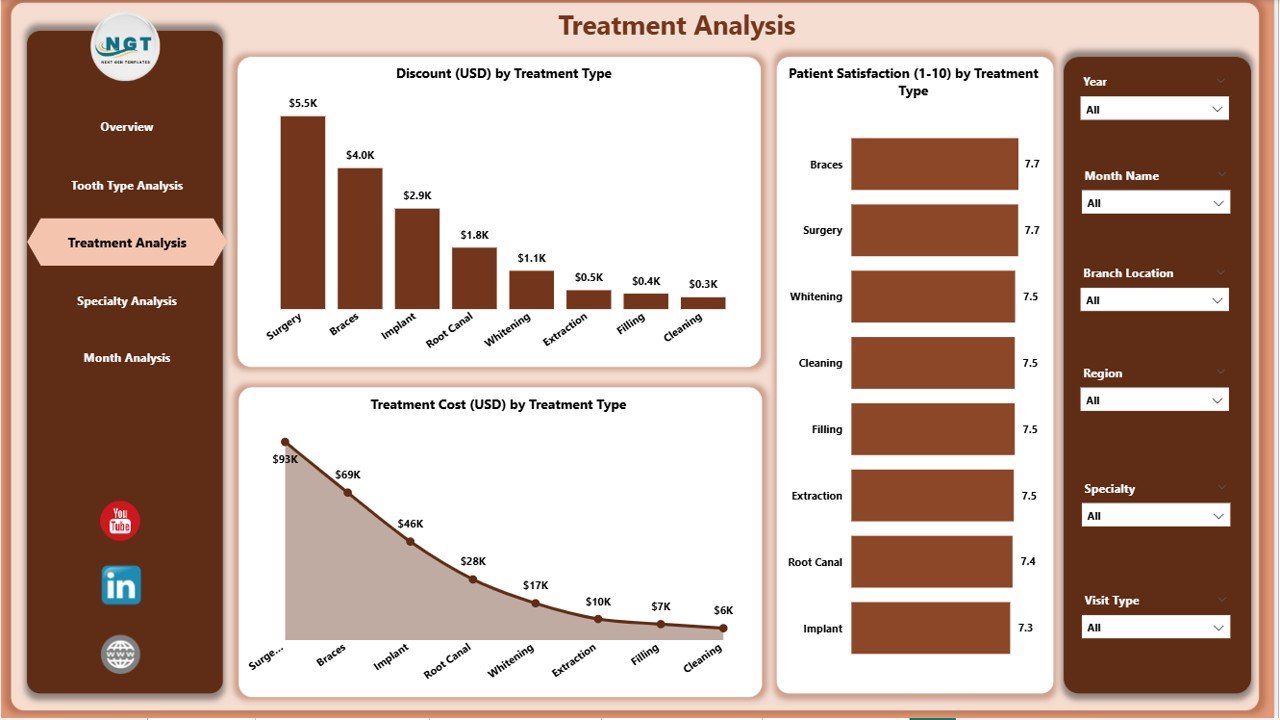
Every dental clinic offers different treatment types—cleaning, fillings, root canals, braces, whitening, implants, and more. This page helps you compare these treatments side by side.
Charts Included in Treatment Analysis
✔ Discount (USD) by Treatment Type
You see which treatments require frequent promotional discounts.
✔ Patient Satisfaction by Treatment Type
Identify which treatments deliver the best experience or need improvement.
✔ Treatment Cost (USD) by Treatment Type
Track high-cost treatments and analyze cost variations.
Why This Analysis Helps
It helps managers:
-
Improve patient experience
-
Optimize pricing
-
Reduce unnecessary costs
-
Identify top-performing treatments
Click to Purchases Dental Services Dashboard in Power BI
4. Specialty Analysis – What Insights Can You Get?
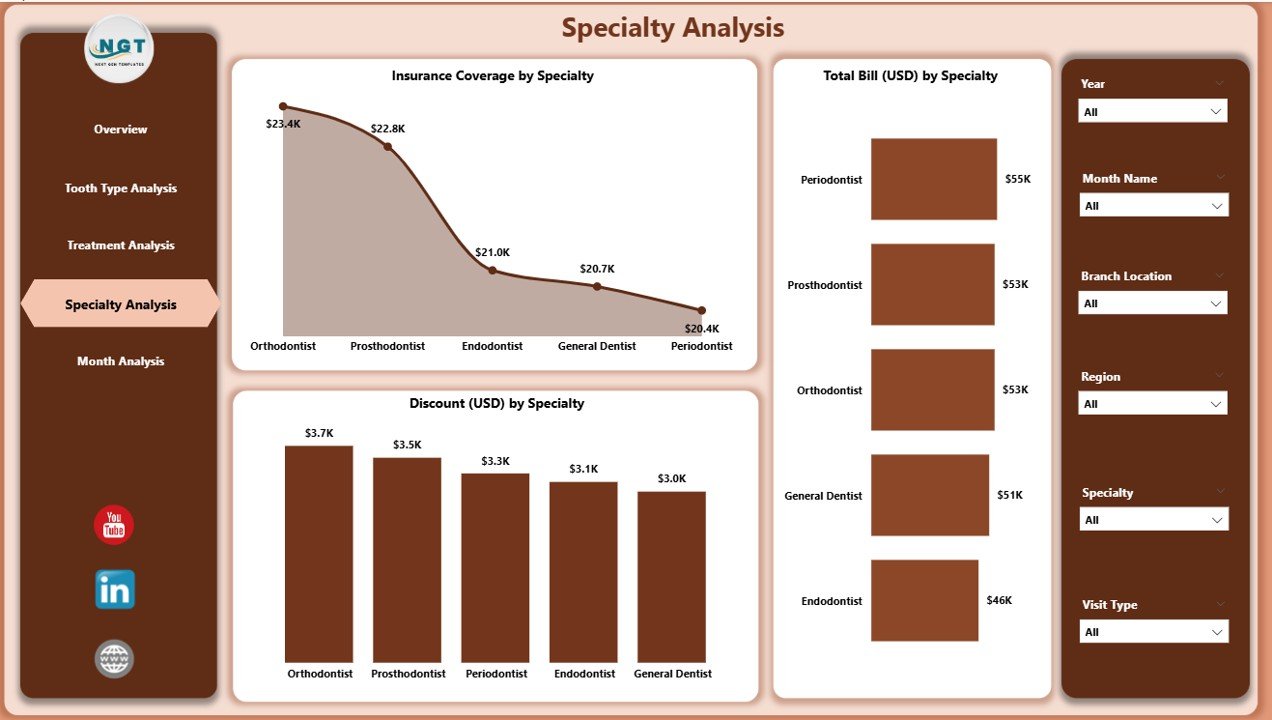
Dental clinics offer many specialties such as orthodontics, prosthodontics, endodontics, pediatric dentistry, and cosmetic dentistry. This page helps you analyze each specialty in detail.
Charts on the Specialty Analysis Page
✔ Insurance Coverage by Specialty
See which specialties receive the most insurance approvals.
✔ Total Bill (USD) by Specialty
Understand revenue contribution per specialty.
✔ Discount (USD) by Specialty
Track discount patterns for each specialty.
Benefits of This Page
-
Helps improve pricing strategies
-
Supports budgeting and forecasting
-
Shows which specialties contribute most to total revenue
-
Highlights areas needing attention
5. Monthly Trends – What Performance Patterns Can You Track?
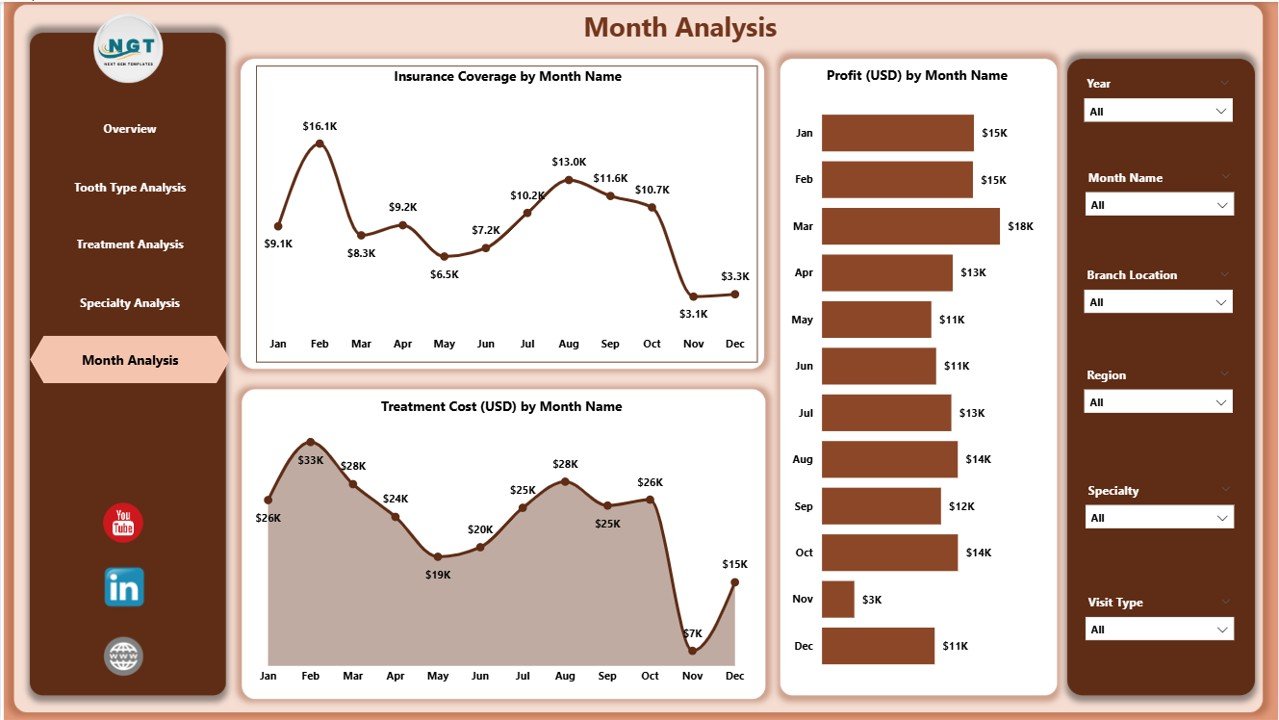
Every dental clinic needs month-wise analysis to understand growth, cost behavior, profit cycles, and insurance claim patterns. This page solves that need.
Charts in Monthly Trends Page
✔ Insurance Coverage by Month
Track coverage approvals throughout the year.
✔ Treatment Cost (USD) by Month
See how treatment costs rise or fall over time.
✔ Profit (USD) by Month
Understand profitability trends and seasonal patterns.
Why It Matters
Monthly trend analysis helps in:
-
Business planning
-
Seasonal forecasting
-
Marketing promotions
-
Financial budgeting
Advantages of a Dental Services Dashboard in Power BI
A dedicated dashboard offers several powerful benefits for dental clinics. Below are the major advantages explained in simple language.
1. Better Visibility Across All KPIs
Managers see everything—from satisfaction to costs—on one screen.
2. Faster and Smarter Decisions
Real-time visuals help teams take action without waiting for long reports.
3. Clear Understanding of Treatments and Specialties
Clinics can compare costs, discounts, and patient satisfaction for each service.
4. Improved Patient Satisfaction
When clinics understand problem areas, they improve service quality faster.
5. Accurate Financial Insights
Tracking billing, insurance coverage, and profit becomes effortless.
6. Saves Time and Reduces Manual Work
Power BI automates reporting and eliminates manual spreadsheets.
7. Helps in Business Expansion
Clear insights help clinics plan new branches, services, and marketing strategies.
Best Practices for the Dental Services Dashboard in Power BI
To get the best results, follow these simple best practices.
1. Keep the Excel or Data Source Updated
The dashboard works best when you refresh accurate data regularly.
2. Use Filters and Slicers Effectively
Slicers help you analyze performance by month, region, specialty, or treatment type.
3. Review Monthly Trends Frequently
Monthly checks help you identify early performance drops.
4. Engage Your Dental Team
Share dashboard insights with staff so they understand improvement areas.
5. Track Discounts Carefully
Unplanned discounts reduce revenue, so monitor them closely.
6. Compare Branch Performance Regularly
This helps identify high-performing and low-performing locations.
7. Plan Budgets Based on Dashboard Insights
Make better financial decisions using profit and cost trends.
How Does This Dashboard Improve Daily Operations?
The dashboard adds clarity to daily tasks. You see:
-
Which specialty is performing well
-
Which treatment brings more satisfaction
-
How discounts affect profit
-
Which branch needs improvement
-
What cost trends look like month after month
As a result, managers stay aware of every activity inside the clinic.
Conclusion
A Dental Services Dashboard in Power BI is one of the most effective tools for dental clinics, dental groups, and multi-branch service providers. It turns raw data into meaningful insights that support decision-making, financial planning, performance improvement, and patient satisfaction.
Since the dashboard includes pages for overview, treatment analysis, tooth type analysis, specialty performance, and monthly trends, it gives you complete visibility of operations. Any dental team that wants better performance, faster reporting, and long-term growth can rely on this dashboard.
Frequently Asked Questions (FAQs)
1. What is a Dental Services Dashboard in Power BI?
It is an analytical reporting system that tracks KPIs such as patient satisfaction, treatment cost, profit, and insurance coverage.
2. Who can use this dashboard?
Dental clinics, dental groups, multi-branch dental service providers, and healthcare analysts can use it.
3. Does the dashboard work with Excel data?
Yes. You can connect it with Excel or any other data source.
4. Can I track month-wise performance?
Yes. The Monthly Trends page shows month-wise insights for profit, insurance, and treatment cost.
5. Is it easy to use?
Yes. The dashboard is designed with simple slicers, clear visuals, and user-friendly navigation.
6. Can I compare specialties and treatments?
Yes. The Specialty and Treatment Analysis pages allow full comparison across categories.
7. How often should I refresh the data?
Refresh the data weekly or monthly for best accuracy.
8. Will this dashboard reduce manual work?
Yes. It eliminates manual reporting and automates performance analysis.
9. Can I customize the visuals?
You can modify colors, charts, and fields in Power BI based on your needs.
10. Why is Power BI useful for dental clinics?
It offers real-time insights, auto-refresh, and interactive visuals that improve management decisions.
Visit our YouTube channel to learn step-by-step video tutorials