Custody desks keep excellent records and terrible reports. The balances are in one export, the fee billing is in another, the wallet split is in a third, and the monthly board pack gets rebuilt by hand every time. The Digital Asset Custodians Dashboard in Excel is a five-page workbook that takes one flat custody log and reads it back as assets under custody, cold storage coverage, fee revenue against operating cost, settlement performance and account status – with four slicers that filter all five pages at once.
Before anything else, what this is and is not. It is a reporting spreadsheet. It does not connect to any blockchain, wallet, exchange, custodian or price feed. It holds no keys, signs nothing and moves nothing. Every figure in this article comes from the 500 rows of fictional sample data that ship in the file, which you are expected to replace with your own. Nothing here is investment, tax, legal or regulatory advice.
Key Features of the Digital Asset Custodians Dashboard in Excel
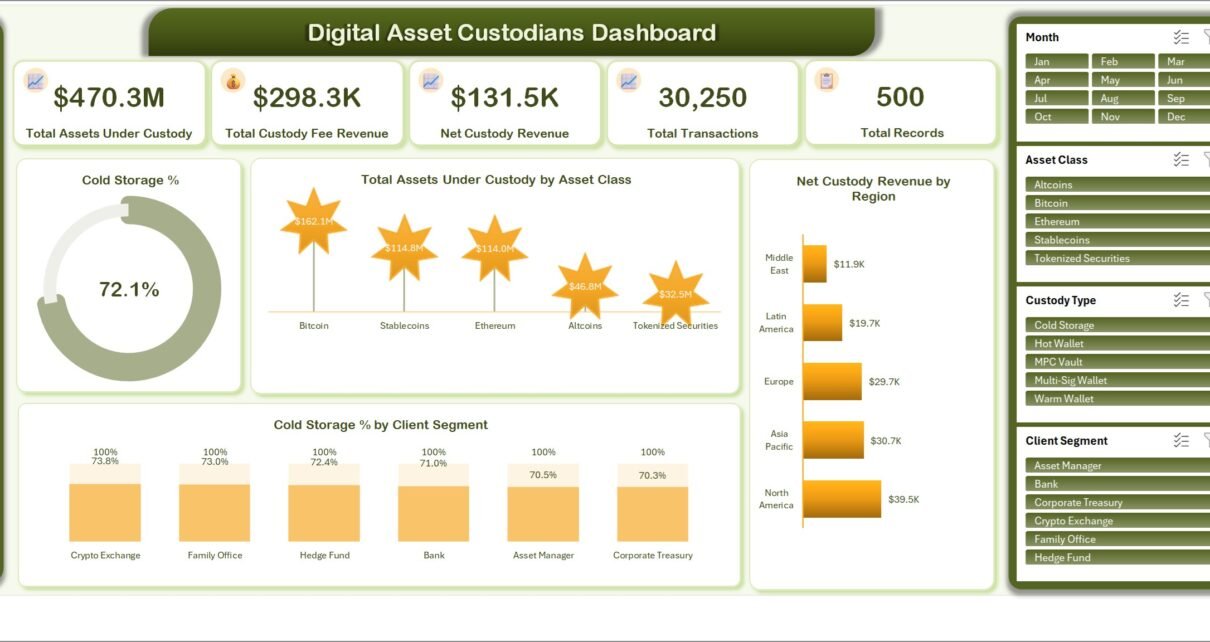
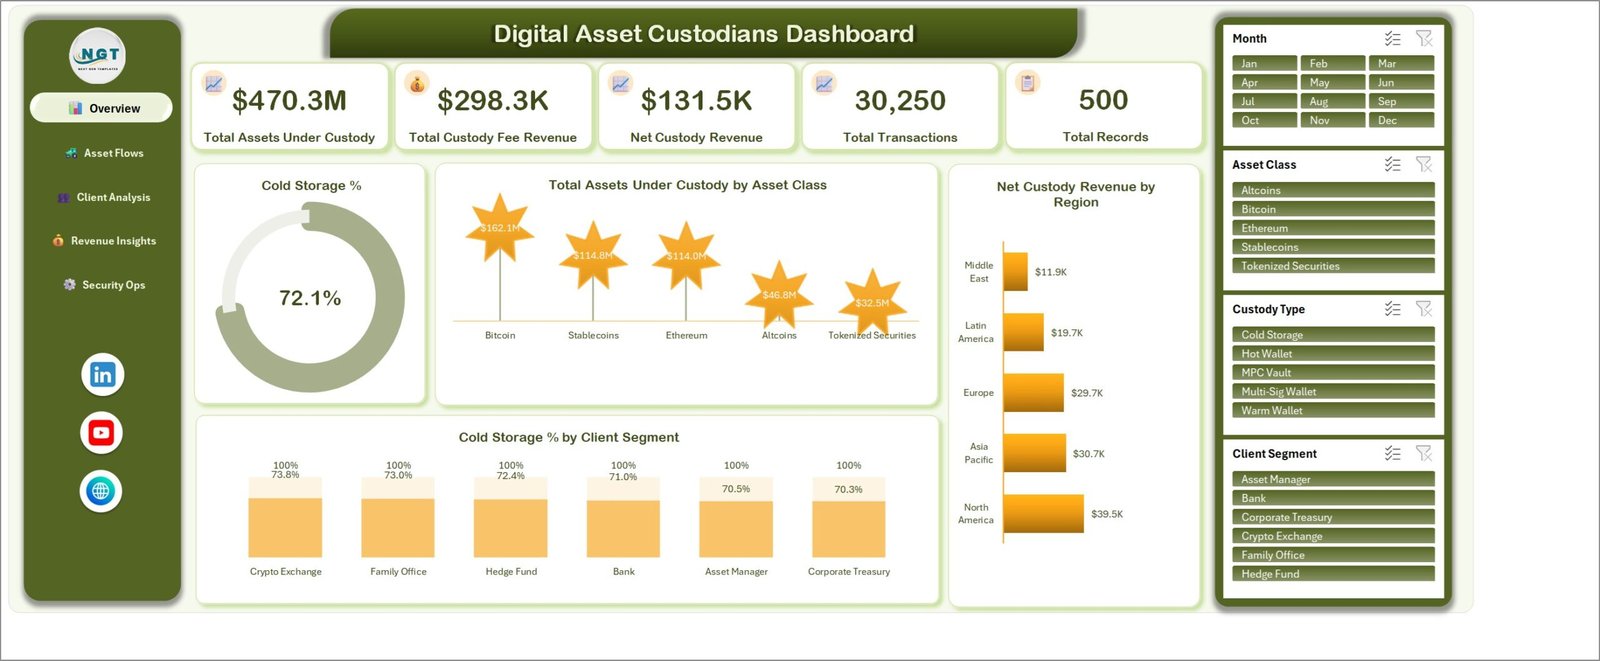
- Five KPI cards on the Overview page – Total Assets Under Custody, Total Custody Fee Revenue, Net Custody Revenue, Total Transactions and Total Records – reading $470.3M, $298.3K, $131.5K, 30,250 and 500 on the sample year.
- A Cold Storage % gauge at 72.1%, so the protection profile is the first thing on screen instead of a calculation you run afterwards.
- Five asset classes (Bitcoin, Ethereum, Stablecoins, Altcoins, Tokenized Securities) and five custody types (Cold Storage, MPC Vault, Multi-Sig Wallet, Warm Wallet, Hot Wallet) throughout.
- Six client segments – Hedge Fund, Crypto Exchange, Asset Manager, Bank, Family Office, Corporate Treasury – and four service tiers.
- Cost next to revenue. Operating Cost is a real column, so Net Custody Revenue and regional margin are figures, not estimates.
- 25 pivot tables and 20 charts driven by a single 31-column Excel table named TblData.
- Four synced slicers – Month, Asset Class, Custody Type, Client Segment.
- No macros, no add-ins, no connections. A plain .xlsx for Excel 2016+ and Microsoft 365 on Windows and Mac.
Dashboard Pages Explanation
Overview
The five KPI cards run across the top. Below them sit the Cold Storage % gauge, Total Assets Under Custody by Asset Class – Bitcoin $162.1M, Stablecoins $114.8M, Ethereum $114.0M, Altcoins $46.8M and Tokenized Securities $32.5M on the sample – and Net Custody Revenue by Region, which ranks North America $39.5K, Asia Pacific $30.7K, Europe $29.7K, Latin America $19.7K and Middle East $11.9K. Across the bottom, Cold Storage % by Client Segment shows a tight band from Crypto Exchange at 73.8% down to Corporate Treasury at 70.3% – useful precisely because it is tight: when a segment drifts out of that band on your own data, you can see it.
Asset Flows
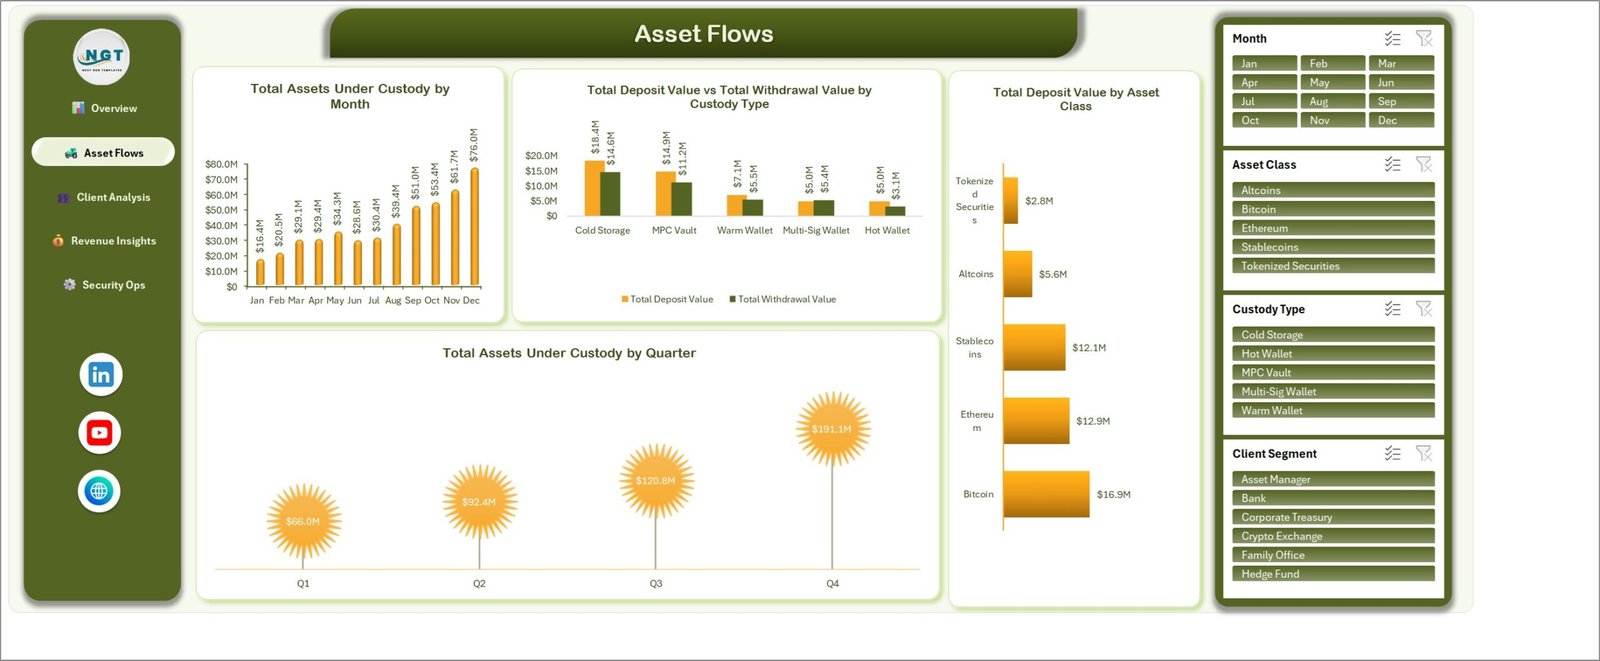
Four charts on movement rather than position. Total Assets Under Custody by Month climbs from $16.4M in January to $76.0M in December on the sample. Total Deposit Value vs Total Withdrawal Value by Custody Type puts inflow beside outflow for each wallet type – Cold Storage $18.4M in against $14.6M out, MPC Vault $14.9M against $11.2M, and so on down to Hot Wallet. Total Deposit Value by Asset Class ranks Bitcoin $16.9M, Ethereum $12.9M, Stablecoins $12.1M, Altcoins $5.6M and Tokenized Securities $2.8M. Total Assets Under Custody by Quarter gives the four-point view: Q1 $66.0M, Q2 $92.4M, Q3 $120.8M, Q4 $191.1M.
Client Analysis
Who the book actually belongs to. Assets Under Custody vs Cold Storage Value by Client Segment pairs balance with protected value – Hedge Fund $121.5M with $88.0M in cold storage, Crypto Exchange $100.2M with $73.9M, down to Corporate Treasury $26.3M with $18.5M. Total Custody Fee Revenue by Client Segment ranks Hedge Fund $79.8K, Crypto Exchange $61.9K, Asset Manager $60.1K, Bank $46.2K, Family Office $32.9K and Corporate Treasury $17.4K. Total Records by Service Tier counts Premium 165, Standard 138, Institutional 113 and Enterprise 84, and Total Assets Under Custody by Onboarding Channel compares Direct Sales $143.1M, Partner Referral $136.1M, Digital Onboarding $98.4M and Broker Network $92.6M.
Revenue Insights
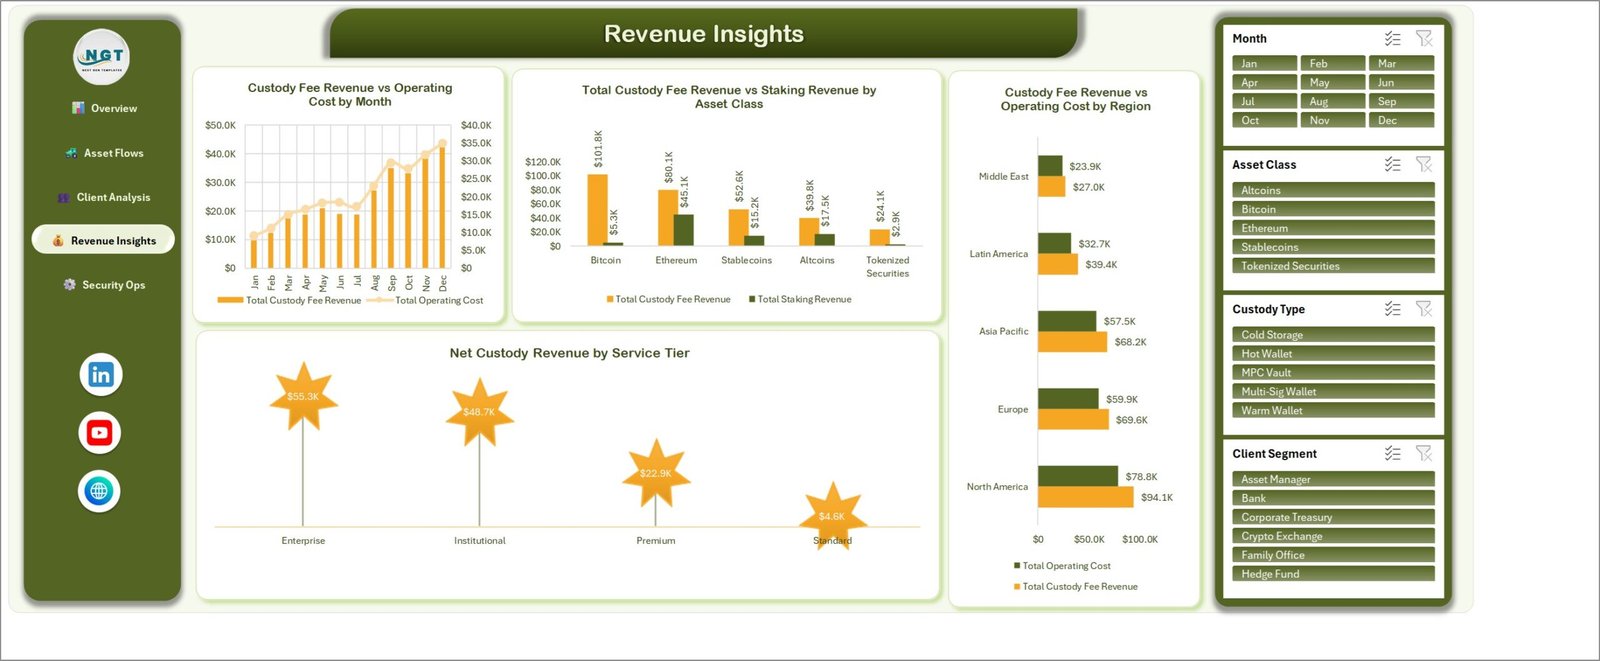
The margin page. Custody Fee Revenue vs Operating Cost by Month is a combo chart with cost as a line over revenue columns. Total Custody Fee Revenue vs Staking Revenue by Asset Class shows how differently the two streams behave – Bitcoin earns $101.8K in fees against only $5.3K of staking revenue, while Ethereum earns $80.1K in fees against $45.1K of staking. Custody Fee Revenue vs Operating Cost by Region puts the two bars side by side for each region, and Net Custody Revenue by Service Tier shows where margin lands: Enterprise $55.3K, Institutional $48.7K, Premium $22.9K, Standard $4.6K.
Security Ops
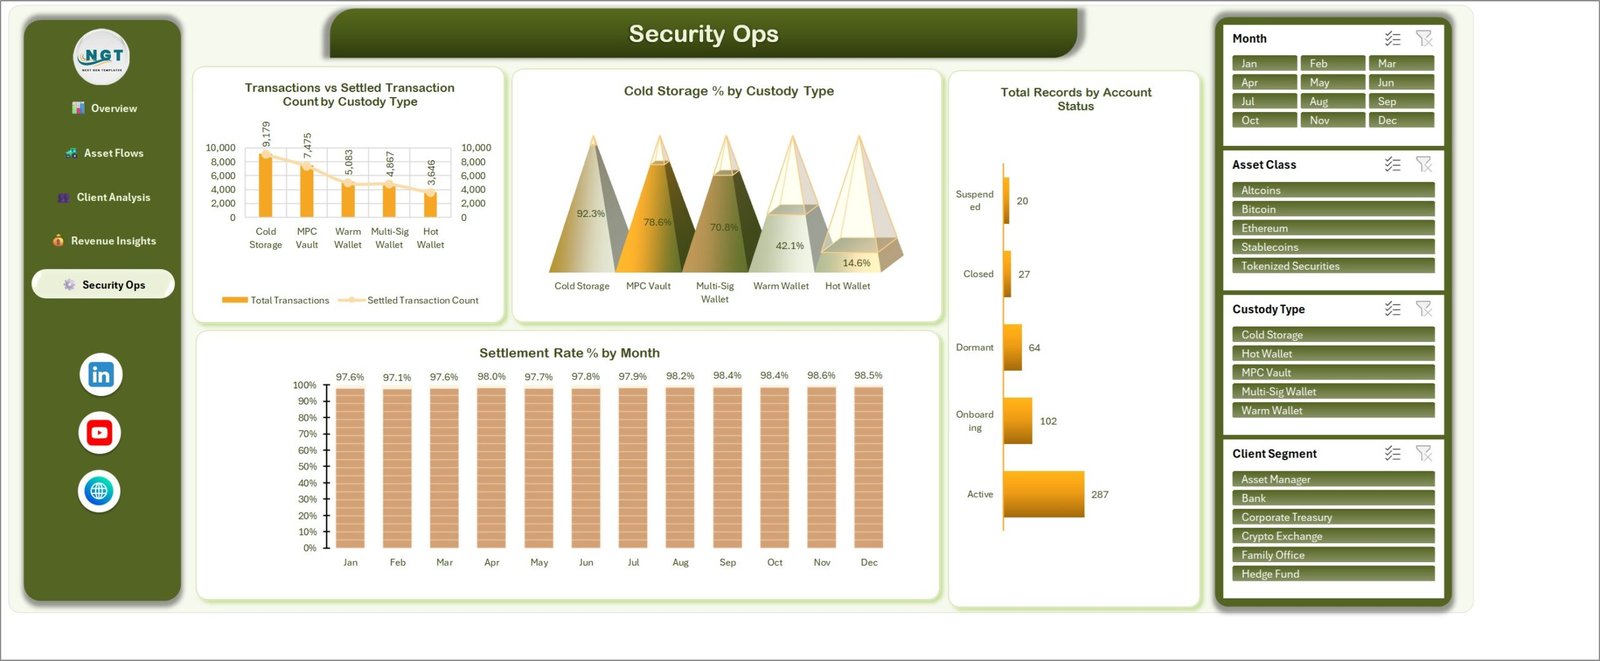
Operational quality rather than money. Transactions vs Settled Transaction Count by Custody Type ranks Cold Storage 9,179 transactions, MPC Vault 7,475, Warm Wallet 5,083, Multi-Sig Wallet 4,867 and Hot Wallet 3,646 – adding to the 30,250 on the KPI card. Cold Storage % by Custody Type is the chart most custody teams will screenshot: 92.3% on Cold Storage, 78.6% on MPC Vault, 70.8% on Multi-Sig Wallet, 42.1% on Warm Wallet and 14.6% on Hot Wallet. Total Records by Account Status counts Active 287, Onboarding 102, Dormant 64, Closed 27 and Suspended 20, and Settlement Rate % by Month runs from 97.1% to 98.6% across the twelve months.
Digital Asset Custodians Dashboard in Excel vs. Google Sheets vs. Platform Reporting – Feature Comparison
| This Excel dashboard | A Google Sheets build | Your custody platform’s reports | |
|---|---|---|---|
| Cost | One payment, yours permanently | Free tool, your build time | Bundled into platform fees |
| Setup | Paste your log, Refresh All | Days of chart building | Already there, but fixed |
| Several custodians in one view | Yes – one row per record, any source | Yes, if you build it | No |
| Live balances | No – paste or export | No, unless scripted | Yes |
| Cold storage share by wallet type | Built in, on two pages | You would build it | Varies by vendor |
| Operating cost beside revenue | Yes, a real column | You would build it | Rarely |
| Rename fields | All 31 columns | Yes | Fixed schema |
| Works offline | Yes | No | No |
Who Should Use This Template
Digital asset custodians and trust companies producing monthly client and board reporting; crypto exchanges with a custody arm; fund administrators and asset servicers covering tokenized holdings; and operations or finance teams that already export a custody log and want it read back without rebuilding charts every cycle.
It is the wrong tool if you want a custody system, a ledger, a proof-of-reserves attestation or anything that touches keys or transactions. It performs none of those. It also contains no investment guidance – no forecasts, no allocation logic, no scoring of any asset – and the asset names in the sample data are spreadsheet labels, not recommendations.
Real-World Use Cases
Reporting cold storage coverage upward. The gauge gives the headline share and Cold Storage % by Custody Type gives the split behind it, so a board conversation starts at “why is Warm Wallet at 42.1%” rather than “can someone work out the number”.
Finding where margin actually is. Custody Fee Revenue vs Operating Cost by Region and Net Custody Revenue by Service Tier together show that a tier can carry meaningful revenue and almost no margin – Standard contributes $4.6K of net revenue on the sample year against Enterprise’s $55.3K.
Preparing a quarterly client review. Set the Month slicer to the quarter and the Client Analysis page gives balance, protected value and fee contribution per segment in two screenshots.
Advantages of the Digital Asset Custodians Dashboard in Excel
- One flat table drives everything, so there is one place to paste and one button to press.
- Cost is modelled, not assumed – most billing exports stop at revenue.
- Custody type and asset class are separate dimensions, so “which wallet type” and “which coin” are different questions with different answers.
- It is source-agnostic: several custodians, exchanges or sub-books can sit in the same table.
- Offline, self-contained, and auditable – a reviewer can trace any chart back to rows they can read.
Opportunities for Improvement
- There is no auto-refresh. If you paste and forget Ctrl+Alt+F5, you are reading the previous numbers.
- Month, Year and Quarter are stored columns, not formulas, so they must be filled to match each Date.
- The five account status counters are 1/0 columns you maintain; leaving them blank empties the Account Status chart.
- Slicers need the Excel desktop app – Excel for the web renders the pages but slicer behaviour is limited.
- The workbook reports the rows currently in the table; it does not archive history, so save a dated copy per period if you need one.
Best Practices
- Keep one row per client, month, asset class and custody type combination – mixing grains is the fastest way to double-count a balance.
- Decide your valuation convention once (period-end rate, cost basis, or whatever your policy says) and record it beside the file, because the workbook does not value anything itself.
- Never paste keys, seed phrases, wallet addresses or client identifiers into the Data sheet; the dashboard needs none of them.
- Refresh All after every paste, then spot-check the Total Records card against your row count before you send anything.
- Save a dated copy each month so a restatement is visible rather than silent.
- Rename chart titles if you rename columns – the titles are plain text and will not follow you.
Explore Relevant Templates
Neighbouring five-page dashboards in the same family: Digital Wallets KPI Dashboard in Excel, Blockchain Finance Dashboard in Excel, Blockchain Development Dashboard in Excel, NFT Art Marketplaces Dashboard in Excel and Crowdsourced Investment Platforms Dashboard in Excel. On other platforms, see the Blockchain and Cryptocurrency Dashboard in Google Sheets and the Crypto Portfolio Dashboard in Power BI.
Frequently Asked Questions
Does it connect to a blockchain, exchange or wallet?
No. There is no API, node, wallet connection or price feed anywhere in the file. Every figure comes from rows you paste onto the Data sheet.
Does it hold keys or move assets?
No. It stores no keys, seed phrases or credentials, cannot sign or broadcast a transaction, and has no ability to move anything. It reports on custody activity after the fact.
Are the numbers in this article real?
No. They come from 500 fictional sample rows covering a 2025 calendar year, shipped so you can see the dashboard working before your own data goes in.
Is any of this financial advice?
No. The workbook contains no forecasts, no valuations of its own, no allocation logic and no scoring of any asset. Decisions about digital assets, and whether your reporting satisfies your regulator or auditor, are yours.
Do I need macros, an add-in or Power Query?
No. It is a plain .xlsx built on pivot tables, slicers and standard charts.
Which Excel versions work?
Excel 2016 and later, plus Microsoft 365, on Windows and Mac. Slicers need the desktop app.
What happens past 500 rows?
The source range is an Excel table, so pasting below the last row extends it. Run Refresh All and every pivot and chart picks up the new rows.
Can I rename the asset classes, custody types and segments?
Yes – they are values in the data, not hard-coded lists. Type your own and refresh, then edit the chart titles to match.
About the Author
Built by PK – Microsoft Certified Professional with 15+ years of Excel, Google Sheets, and Power BI experience. Founder of NextGenTemplates, reaching 300K+ subscribers across YouTube channels. Every template is hand-built and tested before release.
Conclusion
If your custody reporting currently means three exports and an hour of copy-paste, this workbook replaces the assembly, not the judgement. Paste one table, press Refresh All, and the balance, the protection profile, the margin and the settlement record are all on screen and all filterable together. Get the Digital Asset Custodians Dashboard in Excel on NextGenTemplates – instant download, lifetime access, and free updates to the file.